Work with Model explorer
With Model explorer in the Model view in Power BI, you can view and work with complex semantic models with many tables, relationships, measures, roles, calculation groups, translations, and perspectives.
Find Model explorer
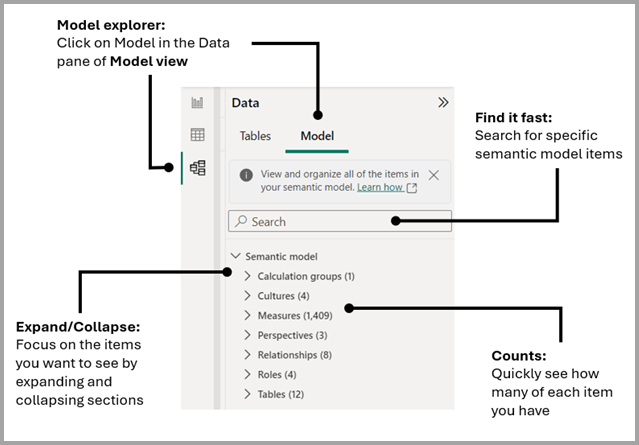
In Power BI when you have a local model open, navigate to Model view. In the Data pane of Model view you'll see options to select Tables or Model at the top of the pane, select Model to see Model explorer.

Anatomy of Model explorer
Model explorer shows all the semantic model items at-a-glance. Find items fast with the search. Focus on what you want to do by expanding and collapsing different item sections. Know how many of each item you have with counts on each section. The following image shows Model explorer.
Items shown in Model explorer
A semantic model can have many different items not shown in the Data pane because they're not used directly on visuals, but such items impact how the report and model data behave for report authors and consumers.
Semantic model
The semantic model is all the metadata about your data, and it impacts how your data shows in reports and DAX queries. A properties pane shows the properties of the semantic model.
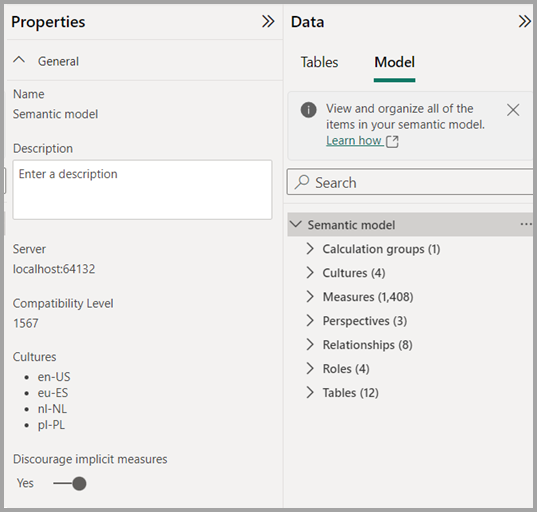
Discourage implicit measures
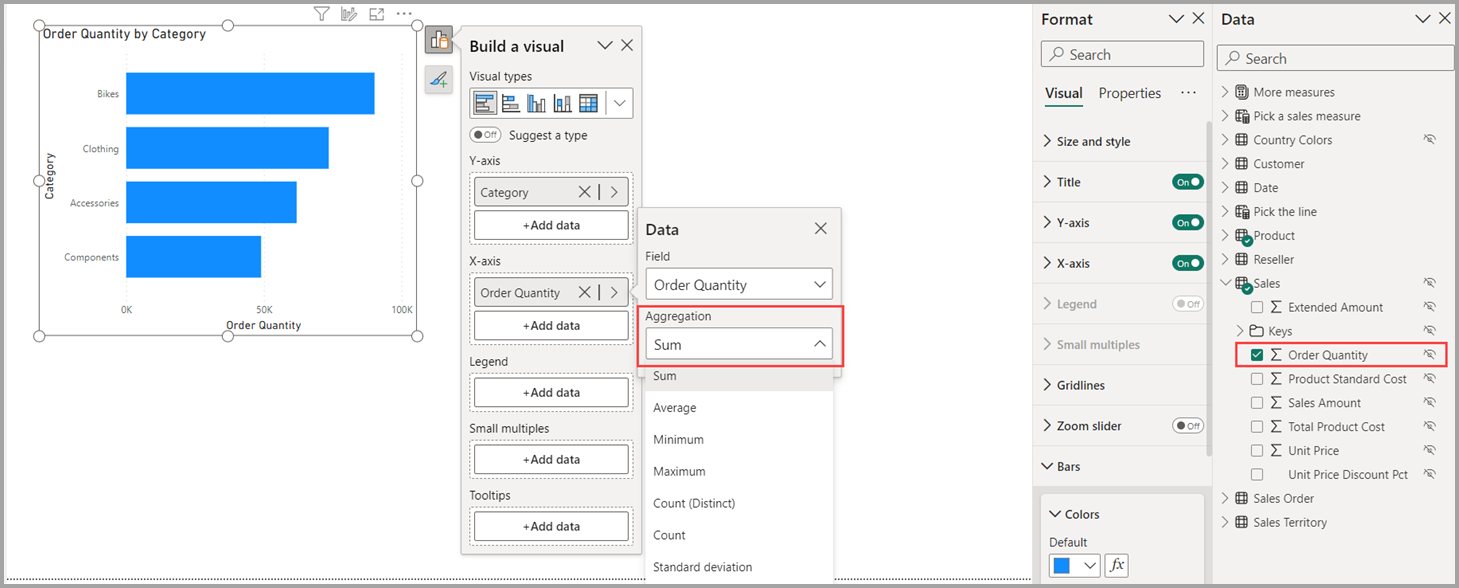
An implicit measure occurs when, in the Report view, you use a data column from the Data pane directly in the visual. The visual allows you to aggregate it as a SUM, AVERAGE, MIN, MAX, or some other basic aggregation, which becomes an implicit measure. Enabling the discourage implicit measure property on a semantic model discourages the creation of such implicit measures by no longer showing the summation symbol next to the data columns in the Data pane, and blocks adding the data columns to the visuals directly on aggregation axis or as values, and in visual conditional formatting. Existing implicit measures already created in visuals will continue to work.
Model authors would want to set this property to ensure measures are used when aggregating data when the measure’s DAX expression contains logic that should always be applied. Enabling this property can also lead to performance improvement with the Filter pane by not generating queries to show counts of each value.
A measure or explicit measure occurs when you create a New measure and define the DAX expression to aggregate a data column. Explicit measures can also have conditional logic and filters, taking full advantage of what you can do with DAX. Learn more in the Create your own measures tutorial article.
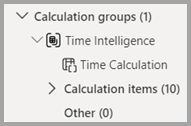
Calculation groups
You can create or edit calculation groups to reduce redundant measures. You can learn more about calculation groups in the Create calculation groups article.
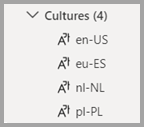
Cultures
In the Cultures area of Model explorer, you can view all translated versions of the data model. Learn more in the Translations in tabular models article.
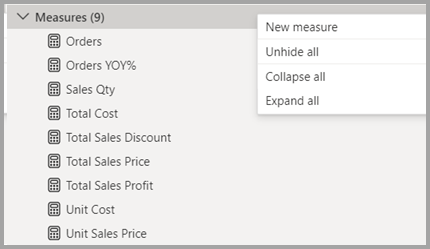
Measures
You can create or edit a measure and view all the measures in your model together, even when they reside in different tables or folders. Learn more in the Create your own measures tutorial article.
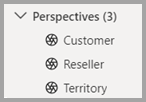
Perspectives
View perspectives created by hiding tables, columns, or measures. Perspectives are commonly used in personalized visuals. Learn more about perspectives in the Perspectives in Analysis Services article.
Relationships
You can create or edit relationships between tables in Model explorer. Learn more about table relationships in the Create and manage relationships in Power BI Desktop article.
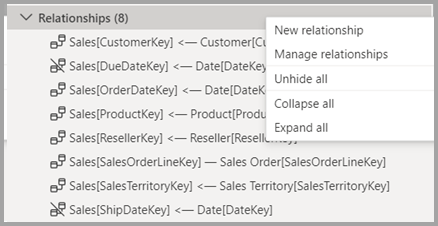
Model explorer also introduces creating a relationship in the Properties pane. Right-click the context menu of the Relationships section and select New relationship to open a blank relationship properties pane that you can fill out, then select Apply changes when you're done. Using Model explorer to create relationships avoids the need to run queries to provide data preview and validation as you select different options.

Roles
You can create or edit security roles in Model explorer. Learn more about security roles in the Row-level security (RLS) with Power BI article.

Tables
You can create or edit tables in your model in Model explorer. The approach is similar to the Tables area in the Data pane, but the information here in Model explorer includes subsections for each table, organizing your items.

Related content
The following articles describe more about data models, and also describe DirectQuery in detail.
- Work with Modeling view in Power BI Desktop
- Automatic aggregations
- Use composite models in Power BI Desktop
- Manage storage mode in Power BI Desktop
- Many-to-many relationships in Power BI Desktop
DirectQuery articles:
Feedback
Coming soon: Throughout 2024 we will be phasing out GitHub Issues as the feedback mechanism for content and replacing it with a new feedback system. For more information see: https://aka.ms/ContentUserFeedback.
Submit and view feedback for