Interact with small multiples in Power BI
APPLIES TO: ![]() Power BI Desktop
Power BI Desktop ![]() Power BI service
Power BI service
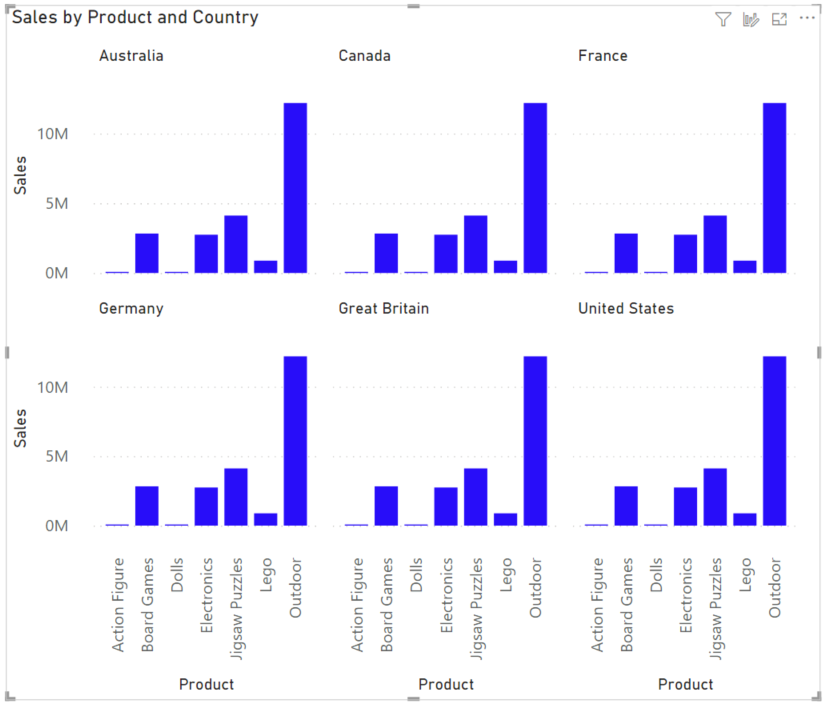
Small multiples, or trellising, split a visual into multiple versions of itself. This article explains how to get the most out of interacting with them.
Want to create small multiples? See Create small multiples in Power BI.
Scroll in a small multiple
Small multiples may contain more individual charts that can fit in the grid. If so, you can scroll down to see the rest of your categories.
For a categorical X axis with many categories, you also see a scroll bar for each copy of that axis. Scrolling on that axis moves them all together. If you're using a scroll wheel, hold Shift to scroll the categorical axes.
Select data to cross-highlight
You can select different subsets of data by selecting different parts of the visual.
Select data points
Hover over the data point on one multiple to show the tooltip in that multiple. You also see a guide line on the X axis for line charts. Select that data point to cross-highlight other visuals by both the axis value and the small-multiple category, and dim the other multiples.

Select a categorical axis value
Select a category label to cross-highlight other visuals by that axis value.

Select a title
Select the title of a multiple to cross-highlight other visuals by the category in that subheader.

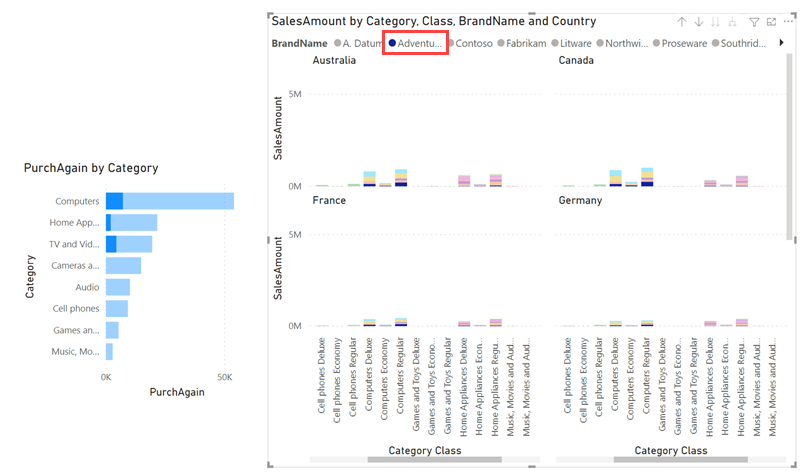
Legend
Select a legend category to cross-highlight other visuals and cross-highlight other multiples.
Sort
With the sort functionality, you can sort multiple aspects of a visual at once. Sort by the category, and also by the axis in each multiple.

Related content
Feedback
Coming soon: Throughout 2024 we will be phasing out GitHub Issues as the feedback mechanism for content and replacing it with a new feedback system. For more information see: https://aka.ms/ContentUserFeedback.
Submit and view feedback for