Query folding examples
This article provides some example scenarios for each of the three possible outcomes for query folding. It also includes some suggestions on how to get the most out of the query folding mechanism, and the effect that it can have in your queries.
The scenario
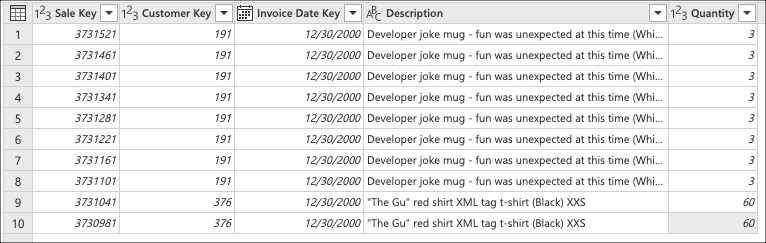
Imagine a scenario where, using the Wide World Importers database for Azure Synapse Analytics SQL database, you're tasked with creating a query in Power Query that connects to the fact_Sale table and retrieves the last 10 sales with only the following fields:
- Sale Key
- Customer Key
- Invoice Date Key
- Description
- Quantity
Note
For demonstration purposes, this article uses the database outlined on the tutorial on loading the Wide World Importers database into Azure Synapse Analytics. The main difference in this article is the fact_Sale table only holds data for the year 2000, with a total of 3,644,356 rows.
While the results might not exactly match the results that you get by following the tutorial from the Azure Synapse Analytics documentation, the goal of this article is to showcase the core concepts and impact that query folding can have in your queries.
This article showcases three ways to achieve the same output with different levels of query folding:
- No query folding
- Partial query folding
- Full query folding
No query folding example
Important
Queries that rely solely on unstructured data sources or that don't have a compute engine, such as CSV or Excel files, don't have query folding capabilities. This means that Power Query evaluates all the required data transformations using the Power Query engine.
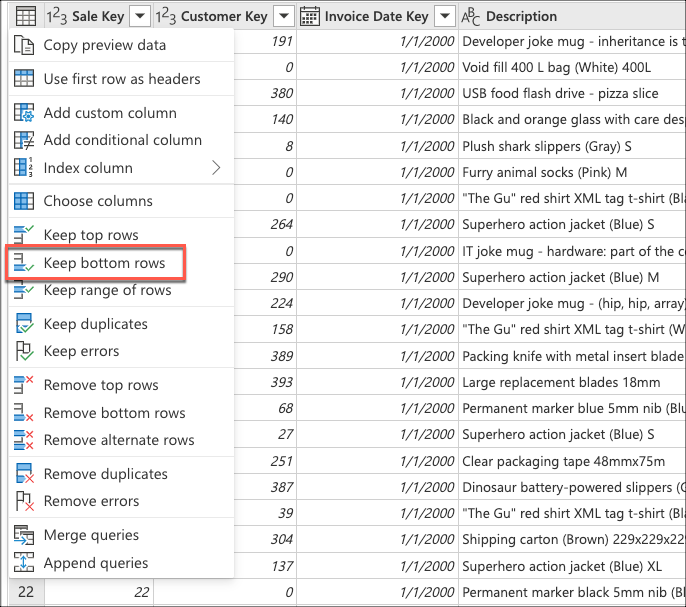
After connecting to your database and navigating to the fact_Sale table, you select the Keep bottom rows transform found inside the Reduce rows group of the Home tab.
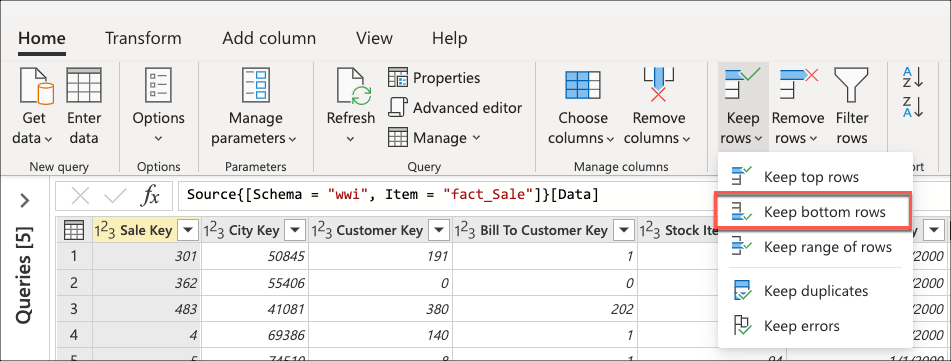
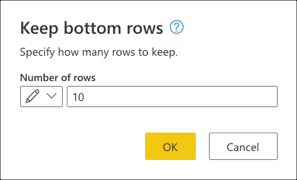
After selecting this transform, a new dialog appears. In this new dialog, you can enter the number of rows that you'd like to keep. For this case, enter the value 10, and then select OK.

Tip
For this case, performing this operation yields the result of the last ten sales. In most scenarios, we recommend that you provide a more explicit logic that defines which rows are considered last by applying a sort operation on the table.
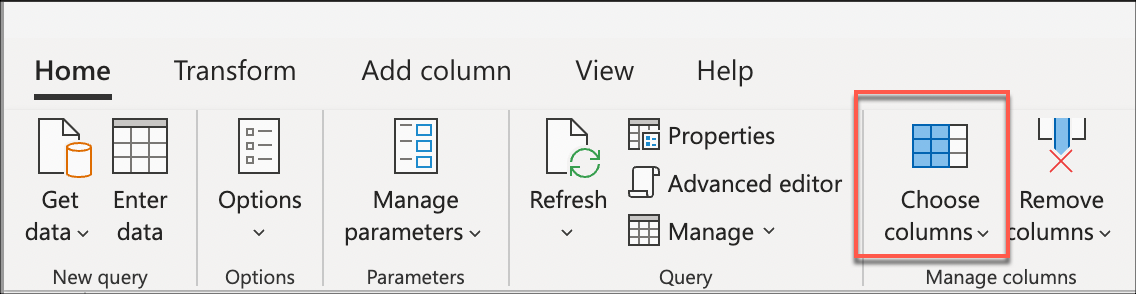
Next, select the Choose columns transform found inside the Manage columns group of the Home tab. You can then select the columns you want to keep from your table and remove the rest.
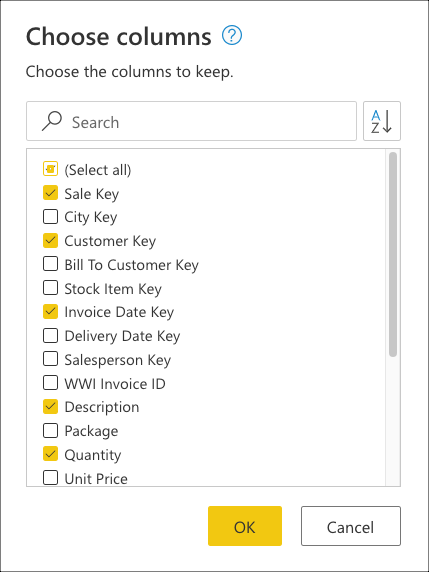
Lastly, inside the Choose columns dialog, select the Sale Key, Customer Key, Invoice Date Key, Description, and Quantity columns, and then select OK.
The following code sample is the full M script for the query you created:
let
  Source = Sql.Database(ServerName, DatabaseName),
  Navigation = Source{[Schema = "wwi", Item = "fact_Sale"]}[Data],
  #"Kept bottom rows" = Table.LastN(Navigation, 10),
  #"Choose columns" = Table.SelectColumns(#"Kept bottom rows", {"Sale Key", "Customer Key", "Invoice Date Key", "Description", "Quantity"})
in
  #"Choose columns""
No query folding: Understanding the query evaluation
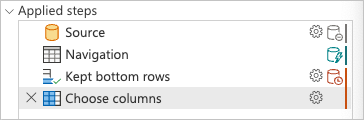
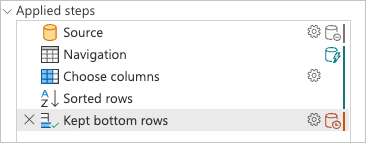
Under Applied steps in the Power Query editor, you’ll notice that the query folding indicators for Kept bottom rows and Choose columns are marked as steps that will be evaluated outside the data source or, in other words, by the Power Query engine.
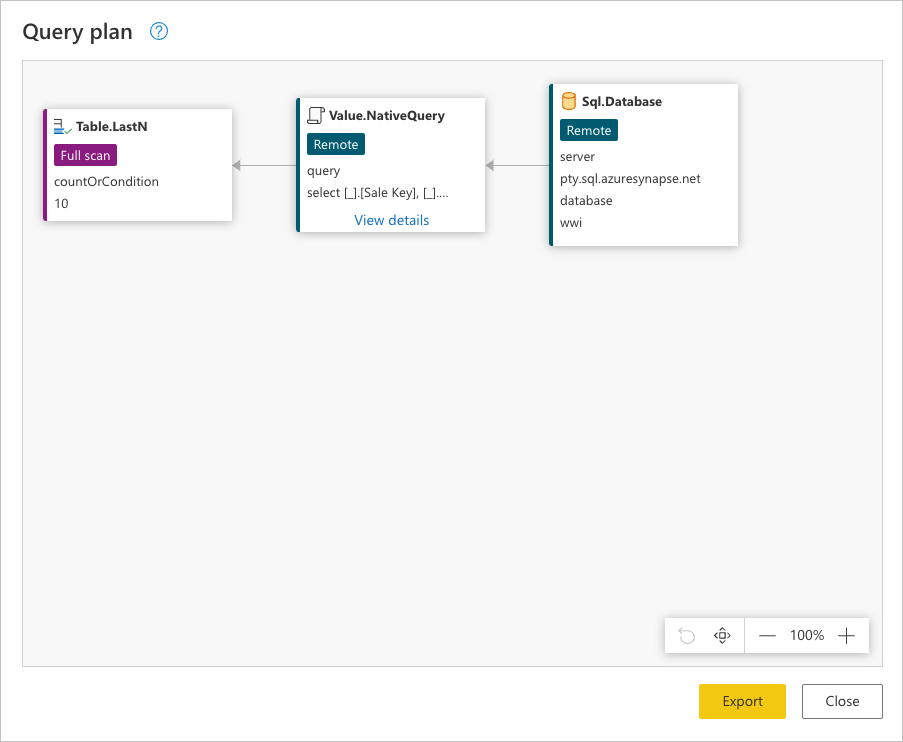
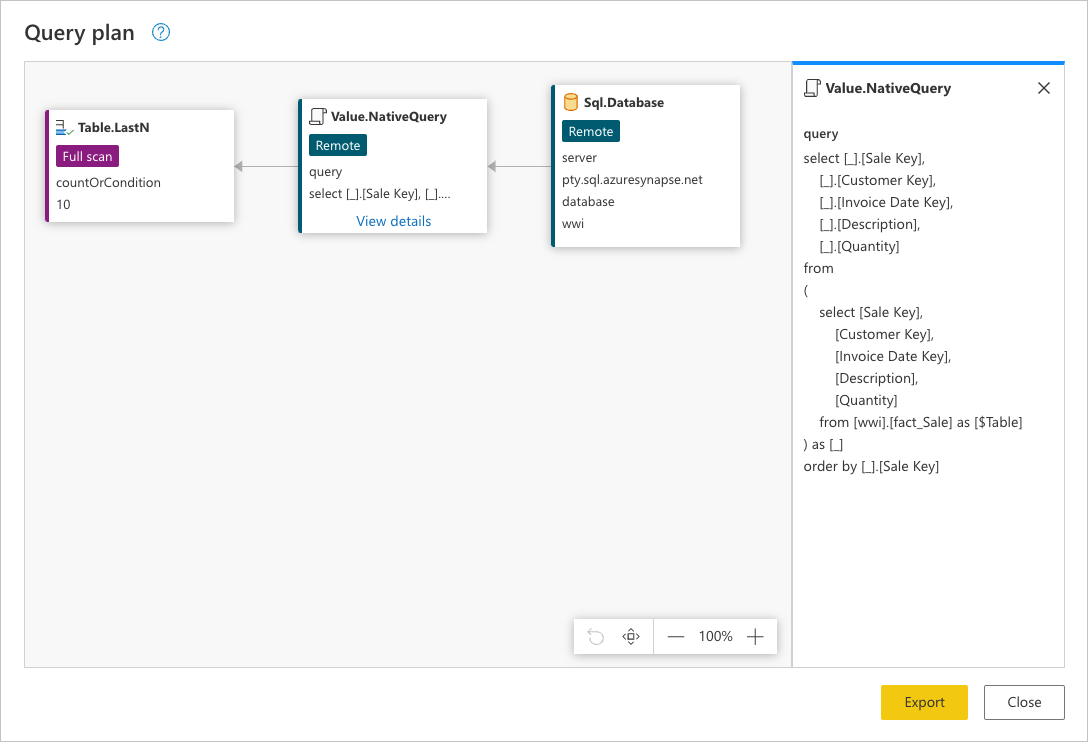
You can right-click the last step of your query, the one named Choose columns, and select the option that reads View Query plan. The goal of the query plan is to provide you with a detailed view of how your query is run. To learn more about this feature, go to Query plan.
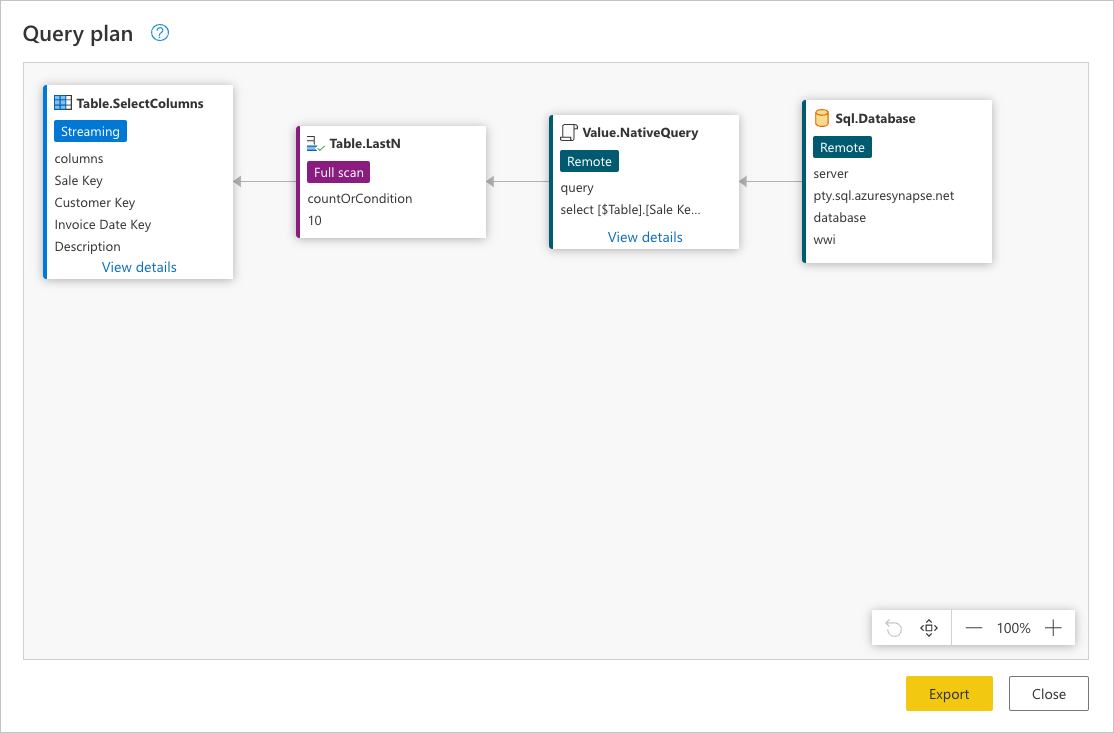
Each box in the previous image is called a node. A node represents the operation breakdown to fulfill this query. Nodes that represent data sources, such as SQL Server in the example above and the Value.NativeQuery node, represent which part of the query is offloaded to the data source. The rest of the nodes, in this case Table.LastN and Table.SelectColumns highlighted in the rectangle in the previous image, are evaluated by the Power Query engine. These two nodes represent the two transforms that you added, Kept bottom rows and Choose columns. The rest of the nodes represent operations that happen at your data source level.
To see the exact request that is sent to your data source, select View details in the Value.NativeQuery node.
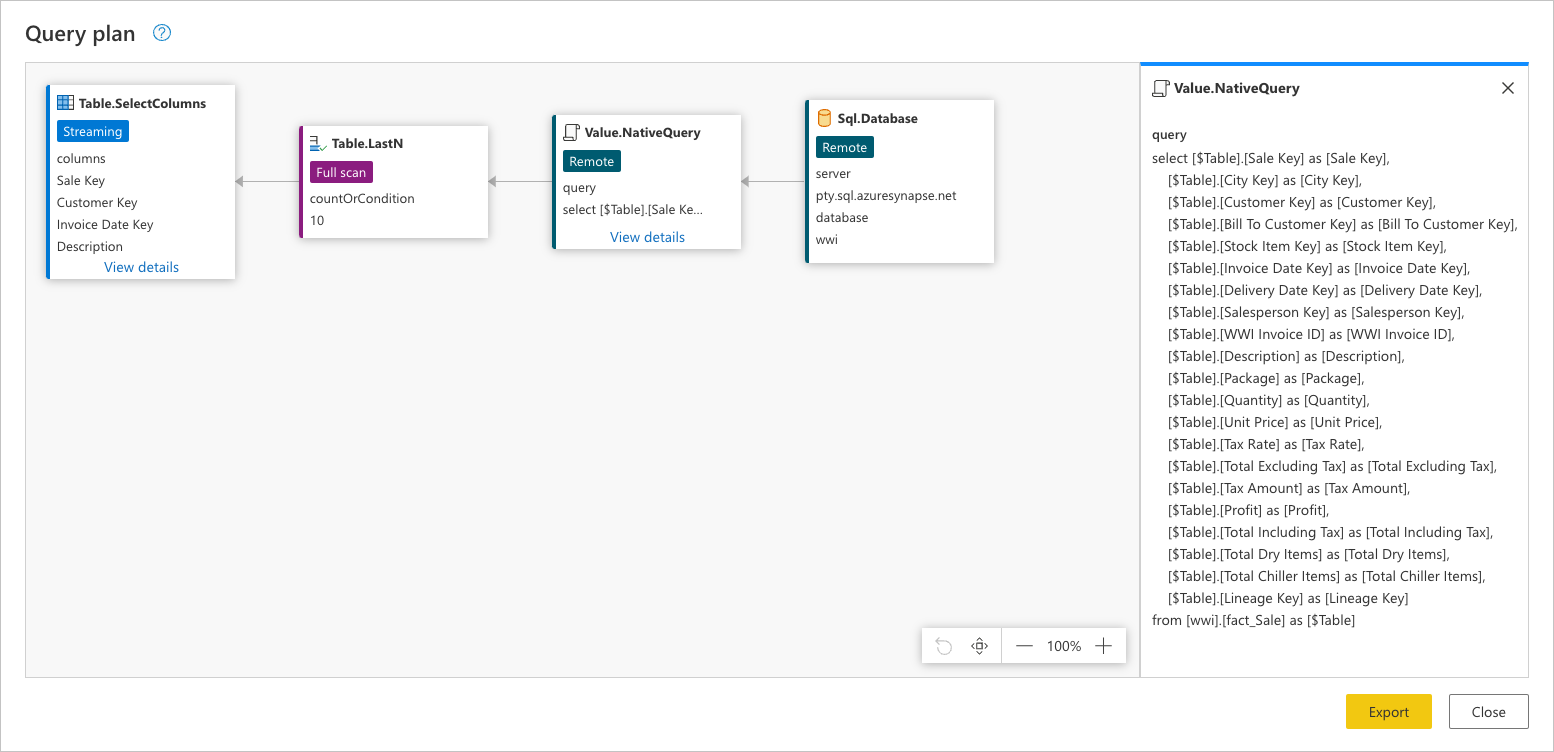
This data source request is in the native language of your data source. For this case, that language is SQL and this statement represents a request for all the rows and fields from the fact_Sale table.
Consulting this data source request can help you better understand the story that the query plan tries to convey:
Sql.Database: This node represents the data source access. Connects to the database and sends metadata requests to understand its capabilities.Value.NativeQuery: Represents the request that was generated by Power Query to fulfill the query. Power Query submits the data requests in a native SQL statement to the data source. In this case, that represents all records and fields (columns) from thefact_Saletable. For this scenario, this case is undesirable, as the table contains millions of rows and the interest is only in the last 10.Table.LastN: Once Power Query receives all records from thefact_Saletable, it uses the Power Query engine to filter the table and keep only the last 10 rows.Table.SelectColumns: Power Query will use the output of theTable.LastNnode and apply a new transform calledTable.SelectColumns, which selects the specific columns that you want to keep from a table.
For its evaluation, this query had to download all rows and fields from the fact_Sale table. This query took an average of 6 minutes and 1 second to be processed in a standard instance of Power BI dataflows (which accounts for the evaluation and loading of data to dataflows).
Partial query folding example
After connecting to the database and navigating to the fact_Sale table, you start by selecting the columns that you want to keep from your table. Select the Choose columns transform found inside the Manage columns group from the Home tab. This transform helps you to explicitly select the columns that you want to keep from your table and remove the rest.
Inside the Choose columns dialog, select the Sale Key, Customer Key, Invoice Date Key, Description, and Quantity columns and then select OK.
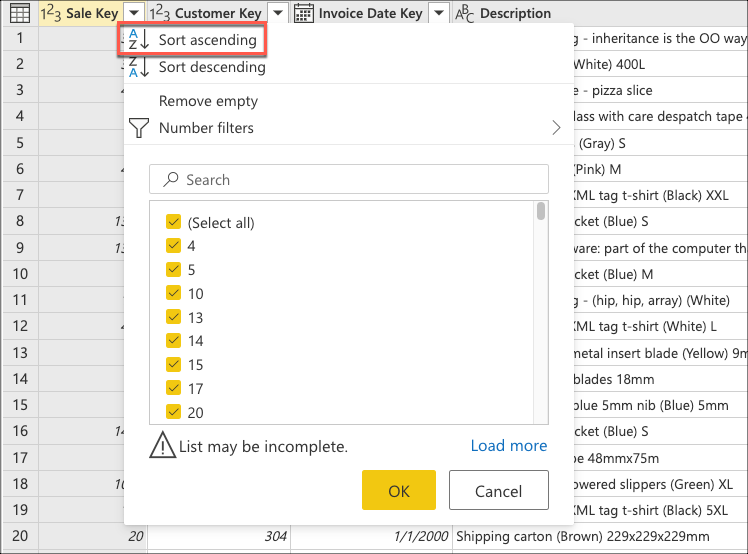
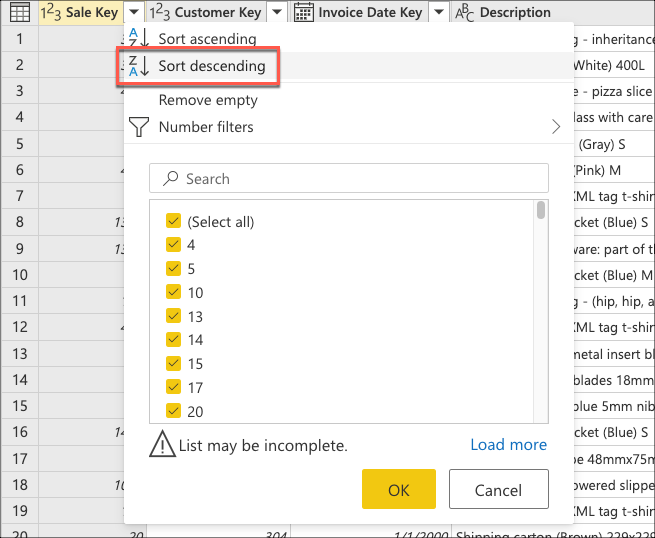
You now create logic that will sort the table to have the last sales at the bottom of the table. Select the Sale Key column, which is the primary key and incremental sequence or index of the table. Sort the table using only this field in ascending order from the context menu for the column.
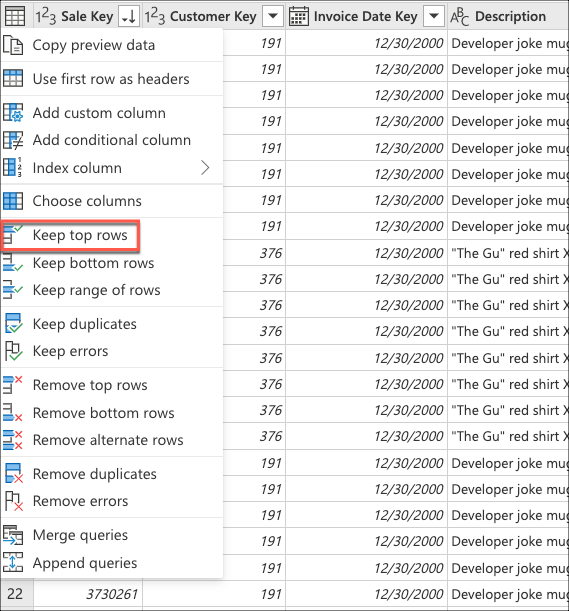
Next, select the table contextual menu and choose the Keep bottom rows transform.
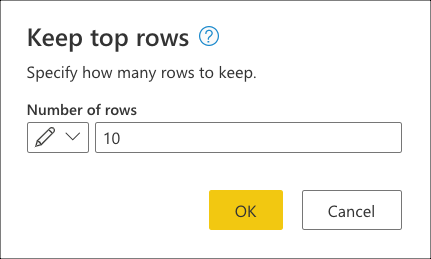
In Keep bottom rows, enter the value 10, and then select OK.
The following code sample is the full M script for the query you created:
let
  Source = Sql.Database(ServerName, DatabaseName),
  Navigation = Source{[Schema = "wwi", Item = "fact_Sale"]}[Data],
  #"Choose columns" = Table.SelectColumns(Navigation, {"Sale Key", "Customer Key", "Invoice Date Key", "Description", "Quantity"}),
  #"Sorted rows" = Table.Sort(#"Choose columns", {{"Sale Key", Order.Ascending}}),
  #"Kept bottom rows" = Table.LastN(#"Sorted rows", 10)
in
  #"Kept bottom rows"
Partial query folding example: Understanding the query evaluation
Checking the applied steps pane, you notice that the query folding indicators are showing that the last transform that you added, Kept bottom rows, is marked as a step that will be evaluated outside the data source or, in other words, by the Power Query engine.
You can right-click the last step of your query, the one named Kept bottom rows, and select the Query plan option to better understand how your query might be evaluated.
Each box in the previous image is called a node. A node represents every process that needs to happen (from left to right) in order for your query to be evaluated. Some of these nodes can be evaluated at your data source while others, like the node for Table.LastN, represented by the Kept bottom rows step, are evaluated using the Power Query engine.
To see the exact request that is sent to your data source, select View details in the Value.NativeQuery node.
This request is in the native language of your data source. For this case, that language is SQL and this statement represents a request for all the rows, with only the requested fields from the fact_Sale table ordered by the Sale Key field.
Consulting this data source request can help you better understand the story that the full query plan tries to convey. The order of the nodes is a sequential process that starts by requesting the data from your data source:
Sql.Database: Connects to the database and sends metadata requests to understand its capabilities.Value.NativeQuery: Represents the request that was generated by Power Query to fulfill the query. Power Query submits the data requests in a native SQL statement to the data source. For this case, that represents all records, with only the requested fields from thefact_Saletable in the database sorted in ascending order by theSales Keyfield.Table.LastN: Once Power Query receives all records from thefact_Saletable, it uses the Power Query engine to filter the table and keep only the last 10 rows.
For its evaluation, this query had to download all rows and only the required fields from the fact_Sale table. It took an average of 3 minutes and 4 seconds to be processed in a standard instance of Power BI dataflows (which accounts for the evaluation and loading of data to dataflows).
Full query folding example
After connecting to the database and navigating to the fact_Sale table, start by selecting the columns that you want to keep from your table. Select the Choose columns transform found inside the Manage columns group from the Home tab. This transform helps you to explicitly select the columns that you want to keep from your table and remove the rest.
In Choose columns, select the Sale Key, Customer Key, Invoice Date Key, Description, and Quantity columns, and then select OK.
You now create logic that will sort the table to have the last sales at the top of the table. Select the Sale Key column, which is the primary key and incremental sequence or index of the table. Sort the table only using this field in descending order from the context menu for the column.
Next, select the table contextual menu and choose the Keep top rows transform.
In Keep top rows, enter the value 10, and then select OK.
The following code sample is the full M script for the query you created:
let
  Source = Sql.Database(ServerName, DatabaseName),
  Navigation = Source{[Schema = "wwi", Item = "fact_Sale"]}[Data],
  #"Choose columns" = Table.SelectColumns(Navigation, {"Sale Key", "Customer Key", "Invoice Date Key", "Description", "Quantity"}),
  #"Sorted rows" = Table.Sort(#"Choose columns", {{"Sale Key", Order.Descending}}),
  #"Kept top rows" = Table.FirstN(#"Sorted rows", 10)
in
  #"Kept top rows"
Full query folding example: Understanding the query evaluation
When checking the applied steps pane, you'll notice that the query folding indicators are showing that the transforms that you added, Choose columns, Sorted rows, and Kept top rows, are marked as steps that will be evaluated at the data source.

You can right-click the last step of your query, the one named Kept top rows, and select the option that reads Query plan.

This request is in the native language of your data source. For this case, that language is SQL and this statement represents a request for all the rows and fields from the fact_Sale table.
Consulting this data source query can help you better understand the story that the full query plan tries to convey:
Sql.Database: Connects to the database and sends metadata requests to understand its capabilities.Value.NativeQuery: Represents the request that was generated by Power Query to fulfill the query. Power Query submits the data requests in a native SQL statement to the data source. For this case, that represents a request for only the top 10 records of thefact_Saletable, with only the required fields after being sorted in descending order using theSale Keyfield.
Note
While there's no clause that can be used to SELECT the bottom rows of a table in the T-SQL language, there's a TOP clause that retrieves the top rows of a table.
For its evaluation, this query only downloads 10 rows, with only the fields that you requested from the fact_Sale table. This query took an average of 31 seconds to be processed in a standard instance of Power BI dataflows (which accounts for the evaluation and loading of data to dataflows).
Performance comparison
To better understand the affect that query folding has in these queries, you can refresh your queries, record the time it takes to fully refresh each query, and compare them. For simplicity, this article provides the average refresh timings captured using the Power BI dataflows refresh mechanic while connecting to a dedicated Azure Synapse Analytics environment with DW2000c as the service level.
The refresh time for each query was as follows:
| Example | Label | Time in seconds |
|---|---|---|
| No query folding | None | 361 |
| Partial query folding | Partial | 184 |
| Full query folding | Full | 31 |
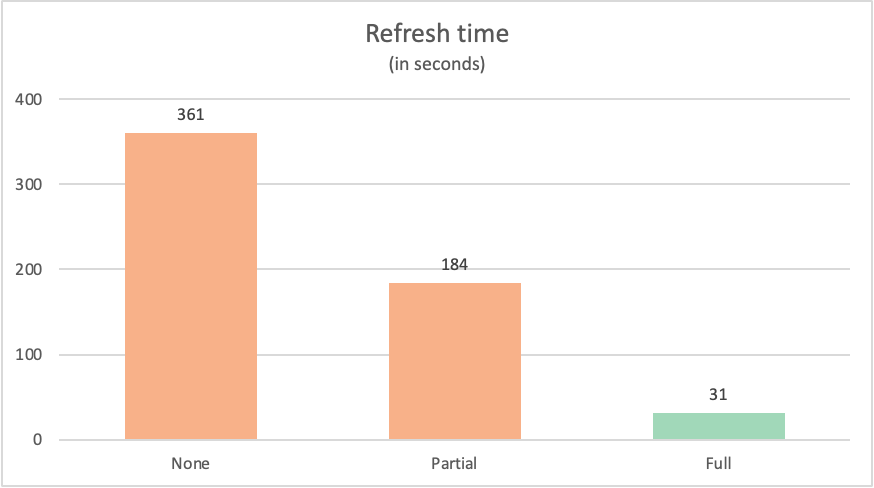
It's often the case that a query that fully folds back to the data source outperforms similar queries that don't completely fold back to the data source. There could be many reasons why this is the case. These reasons range from the complexity of the transforms that your query performs, to the query optimizations implemented at your data source, such as indexes and dedicated computing, and network resources. Still, there are two specific key processes that query folding tries to use that minimizes the affect that both of these processes have with Power Query:
- Data in transit
- Transforms executed by the Power Query engine
The following sections explain the affect that these two processes have in the previously mentioned queries.
Data in transit
When a query gets executed, it tries to fetch the data from the data source as one of its first steps. What data is fetched from the data source is defined by the query folding mechanism. This mechanism identifies the steps from the query that can be offloaded to the data source.
The following table lists the number of rows requested from the fact_Sale table of the database. The table also includes a brief description of the SQL statement sent to request such data from the data source.
| Example | Label | Rows requested | Description |
|---|---|---|---|
| No query folding | None | 3644356 | Request for all fields and all records from the fact_Sale table |
| Partial query folding | Partial | 3644356 | Request for all records, but only required fields from the fact_Sale table after it was sorted by the Sale Key field |
| Full query folding | Full | 10 | Request for only the required fields and the TOP 10 records of the fact_Sale table after being sorted in descending order by the Sale Key field |
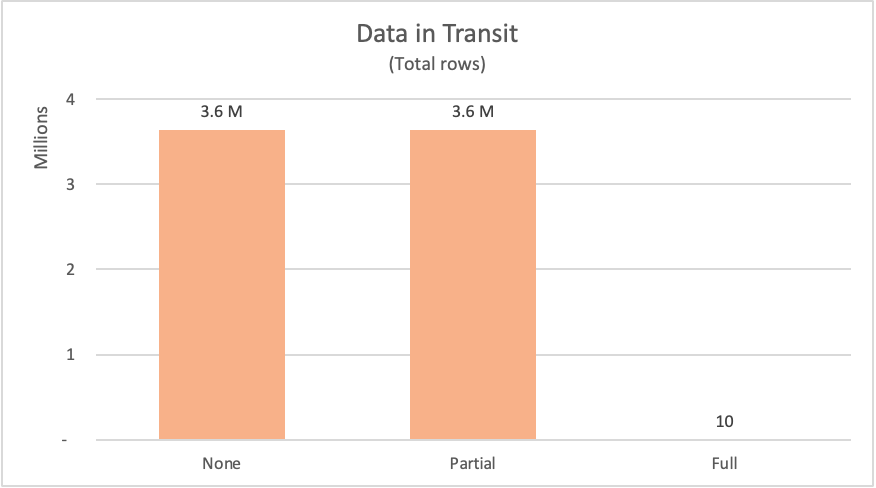
When requesting data from a data source, the data source needs to compute the results for the request and then send the data to the requestor. While the computing resources have already been mentioned, the network resources of moving the data from the data source to Power Query, and then have Power Query be able to effectively receive the data and prepare it for the transforms that will happen locally can take some time depending on the size of the data.
For the showcased examples, Power Query had to request over 3.6 million rows from the data source for the no query folding and partial query folding examples. For the full query folding example, it only requested 10 rows. For the fields requested, the no query folding example requested all the available fields from the table. Both the partial query folding and the full query folding examples only submitted a request for exactly the fields that they needed.
Caution
We recommend that you implement incremental refresh solutions that leverage query folding for queries or tables with large amounts of data. Different product integrations of Power Query implement timeouts to terminate long running queries. Some data sources also implement timeouts on long running sessions, trying to execute expensive queries against their servers. More information: Using incremental refresh with dataflows and Incremental refresh for semantic models
Transforms executed by the Power Query engine
This article showcased how you can use the Query plan to better understand how your query might be evaluated. Inside the query plan, you can see the exact nodes of the transform operations that will be performed by the Power Query engine.
The following table showcases the nodes from the query plans of the previous queries that would have been evaluated by the Power Query engine.
| Example | Label | Power Query engine transform nodes |
|---|---|---|
| No query folding | None | Table.LastN, Table.SelectColumns |
| Partial query folding | Partial | Table.LastN |
| Full query folding | Full | — |
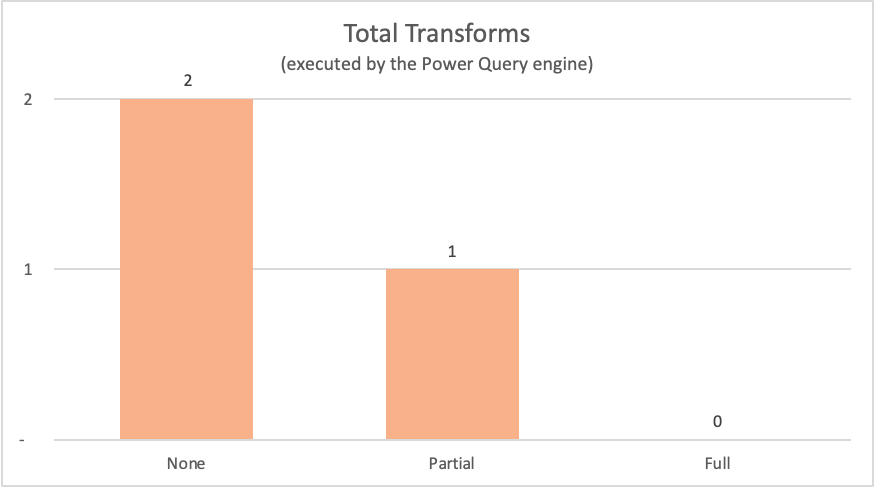
For the examples showcased in this article, the full query folding example doesn't require any transforms to happen inside the Power Query engine as the required output table comes directly from the data source. In contrast, the other two queries required some computation to happen at the Power Query engine. Because of the amount of data that needs to be processed by these two queries, the process for these examples takes more time than the full query folding example.
Transforms can be grouped into the following categories:
| Type of Operator | Description |
|---|---|
| Remote | Operators that are data source nodes. The evaluation of these operators occurs outside of Power Query. |
| Streaming | Operators are pass-through operators. For example, Table.SelectRows with a simple filter can usually filter the results as they pass through the operator, and won’t need to gather all rows before moving the data. Table.SelectColumns and Table.ReorderColumns are other examples of these sort of operators. |
| Full scan | Operators that need to gather all the rows before the data can move on to the next operator in the chain. For example, to sort data, Power Query needs to gather all the data. Other examples of full scan operators are Table.Group, Table.NestedJoin, and Table.Pivot. |
Tip
While not every transform is the same from a performance standpoint, in most cases, having fewer transforms is usually better.
Considerations and suggestions
- Follow the best practices when creating a new query, as stated in Best practices in Power Query.
- Use the query folding indicators to check which steps are preventing your query from folding. Reorder them if necessary to increase folding.
- Use the query plan to determine which transforms are happening at the Power Query engine for a particular step. Consider modifying your existing query by re-arranging your steps. Then check the query plan of the last step of your query again and see if the query plan looks better than the previous one. For example, the new query plan has less nodes than the previous one, and most of the nodes are “Streaming” nodes and not “full scan”. For data sources that support folding, any nodes in the query plan other than
Value.NativeQueryand data source access nodes represent transforms that didn’t fold. - When available, you can use the View Native Query (or View data source query) option to ensure that your query can be folded back to the data source. If this option is disabled for your step, and you're using a source that normally enables it, you've created a step that stops query folding. If you're using a source that doesn't support this option, you can rely on the query folding indicators and query plan.
- Use the query diagnostics tools to better understand the requests being sent to your data source when query folding capabilities are available for the connector.
- When combining data sourced from the use of multiple connectors, Power Query tries to push as much work as possible to both of the data sources while complying with the privacy levels defined for each data source.
- Read the article on privacy levels to protect your queries from running against a Data Privacy Firewall error.
- Use other tools to check query folding from the perspective of the request being received by the data source. Based on the example in this article, you can use the Microsoft SQL Server Profiler to check the requests being sent by Power Query and received by the Microsoft SQL Server.
- If you add a new step to a fully folded query and the new step also folds, Power Query might send a new request to the data source instead of using a cached version of the previous result. In practice, this process can result in seemingly simple operations on a small amount of data taking longer to refresh in the preview than expected. This longer refresh is due to Power Query requerying the data source rather than working off a local copy of the data.
Feedback
Coming soon: Throughout 2024 we will be phasing out GitHub Issues as the feedback mechanism for content and replacing it with a new feedback system. For more information see: https://aka.ms/ContentUserFeedback.
Submit and view feedback for