Adicionar uma camada de linhas ao mapa (SDK do Android)
Observação
Desativação do SDK do Android do Azure Mapas
O SDK Nativo do Azure Mapas para Android já foi preterido e será desativado em 31/03/25. Para evitar interrupções de serviço, migre para o SDK da Web do Azure Mapas até 31/03/25. Para obter mais informações, confira O guia de migração do SDK do Android do Azure Mapas.
Uma camada de linhas pode ser usada para renderizar os recursos LineString e MultiLineString como caminhos ou rotas no mapa. Uma camada de linhas também pode ser usada para renderizar a estrutura de tópicos dos recursos Polygon e MultiPolygon. Uma fonte de dados é conectada a uma camada de linhas para fornecer a ela dados a serem renderizados.
Dica
Por padrão, as camadas de linhas renderizarão as coordenadas dos polígonos e das linhas em uma fonte de dados. Para limitar a camada de modo que ela só renderize recursos de geometria de LineString, defina a opção filter da camada como eq(geometryType(), "LineString"). Se você também quiser incluir recursos de MultiLineString, defina a opção filter da camada como any(eq(geometryType(), "LineString"), eq(geometryType(), "MultiLineString")).
Pré-requisitos
Conclua as etapas no documento Início Rápido: Criar um aplicativo Android. Os blocos de código neste artigo podem ser inseridos no manipulador de eventos onReady dos mapas.
Adicionar uma camada de linha
O código a seguir mostra como criar uma linha. Adicione a linha a uma fonte de dados e, em seguida, renderize-a com uma camada de linhas usando a classe LineLayer.
//Create a data source and add it to the map.
DataSource source = new DataSource();
map.sources.add(source);

//Create a list of points.
List<Point> points = Arrays.asList(
    Point.fromLngLat(-73.97234, 40.74327),
    Point.fromLngLat(-74.00442, 40.75680));

//Create a LineString geometry and add it to the data source.
source.add(LineString.fromLngLats(points));

//Create a line layer and add it to the map.
LineLayer layer = new LineLayer(source,
    strokeColor("blue"),
    strokeWidth(5f)
);

map.layers.add(layer);
//Create a data source and add it to the map.
val source = DataSource()
map.sources.add(source)

//Create a list of points.
val points = asList(
    Point.fromLngLat(-73.97234, 40.74327),
    Point.fromLngLat(-74.00442, 40.75680)
)

//Create a LineString geometry and add it to the data source.
source.add(LineString.fromLngLats(points))

//Create a line layer and add it to the map.
val layer = LineLayer(
    source,
    strokeColor("blue"),
    strokeWidth(5f)
)

map.layers.add(layer)
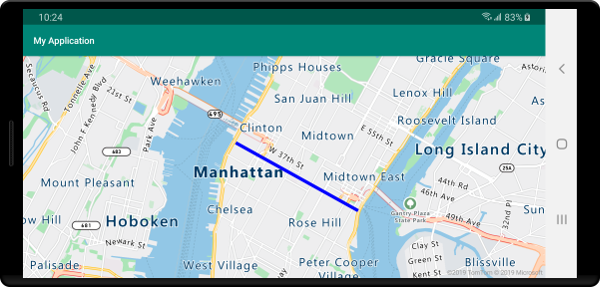
A captura de tela a seguir mostra o código acima renderizando uma linha em uma camada de linhas.
Estilo de linha controlada por dados
O código a seguir cria dois recursos de linha e adiciona um valor de limite de velocidade como uma propriedade a cada linha. Uma camada de linhas usa uma expressão de estilo de unidade de dados para colorir as linhas com base no valor do limite de velocidade. Como os dados de linha se sobrepõe ao longo de estradas, o código a seguir adiciona a camada de linhas abaixo da camada de rótulo para que os rótulos de estrada ainda possam ser lidos claramente.
//Create a data source and add it to the map.
DataSource source = new DataSource();
map.sources.add(source);

//Create a line feature.
Feature feature = Feature.fromGeometry(
    LineString.fromLngLats(Arrays.asList(
        Point.fromLngLat(-122.131821, 47.704033),
        Point.fromLngLat(-122.099919, 47.703678))));

//Add a property to the feature.
feature.addNumberProperty("speedLimitMph", 35);

//Add the feature to the data source.
source.add(feature);

//Create a second line feature.
Feature feature2 = Feature.fromGeometry(
    LineString.fromLngLats(Arrays.asList(
        Point.fromLngLat(-122.126662, 47.708265),
        Point.fromLngLat(-122.126877, 47.703980))));

//Add a property to the second feature.
feature2.addNumberProperty("speedLimitMph", 15);

//Add the second feature to the data source.
source.add(feature2);

//Create a line layer and add it to the map.
LineLayer layer = new LineLayer(source,
    strokeColor(
        interpolate(
            linear(),
            get("speedLimitMph"),
            stop(0, color(Color.GREEN)),
            stop(30, color(Color.YELLOW)),
            stop(60, color(Color.RED))
        )
    ),
    strokeWidth(5f)
);

map.layers.add(layer, "labels");
//Create a data source and add it to the map.
val source = DataSource()
map.sources.add(source)

//Create a line feature.
val feature = Feature.fromGeometry(
    LineString.fromLngLats(
        Arrays.asList(
            Point.fromLngLat(-122.131821, 47.704033),
            Point.fromLngLat(-122.099919, 47.703678)
        )
    )
)

//Add a property to the feature.
feature.addNumberProperty("speedLimitMph", 35)

//Add the feature to the data source.
source.add(feature)

//Create a second line feature.
val feature2 = Feature.fromGeometry(
    LineString.fromLngLats(
        Arrays.asList(
            Point.fromLngLat(-122.126662, 47.708265),
            Point.fromLngLat(-122.126877, 47.703980)
        )
    )
)

//Add a property to the second feature.
feature2.addNumberProperty("speedLimitMph", 15)

//Add the second feature to the data source.
source.add(feature2)

//Create a line layer and add it to the map.
val layer = LineLayer(
    source,
    strokeColor(
        interpolate(
            linear(),
            get("speedLimitMph"),
            stop(0, color(Color.GREEN)),
            stop(30, color(Color.YELLOW)),
            stop(60, color(Color.RED))
        )
    ),
    strokeWidth(5f)
)

map.layers.add(layer, "labels")
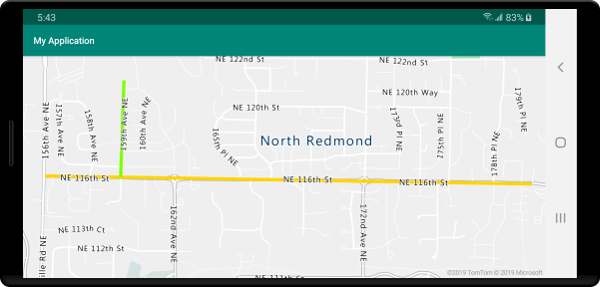
A captura de tela a seguir mostra o código acima renderizando duas linhas em uma camada de linhas, a cor recuperada de uma expressão de estilo controlada por dados com base em uma propriedade no recurso de linha.
Adicionar um gradiente de traço a uma linha
Você pode aplicar uma cor de traço único a uma linha. Você também pode preencher uma linha com um gradiente de cores para mostrar a transição de um segmento de linha para o outro. Por exemplo, gradientes de linha podem ser usados para representar alterações ao longo do tempo e de acordo com a distância ou temperaturas diferentes em uma linha de objetos conectada. Para aplicar esse recurso a uma linha, a fonte de dados precisa ter a opção lineMetrics definida como strokeColor e, em seguida, uma expressão de gradiente de cor pode ser passada para a opção true da linha. A expressão de gradiente de traço precisa fazer referência à expressão de dados lineProgress que expõe as métricas de linha calculada para a expressão.
//Create a data source and add it to the map.
DataSource source = new DataSource(
    //Enable line metrics on the data source. This is needed to enable support for strokeGradient.
    withLineMetrics(true)
);
map.sources.add(source);

//Create a line and add it to the data source.
source.add(LineString.fromLngLats(
    Arrays.asList(
        Point.fromLngLat(-122.18822, 47.63208),
        Point.fromLngLat(-122.18204, 47.63196),
        Point.fromLngLat(-122.17243, 47.62976),
        Point.fromLngLat(-122.16419, 47.63023),
        Point.fromLngLat(-122.15852, 47.62942),
        Point.fromLngLat(-122.15183, 47.62988),
        Point.fromLngLat(-122.14256, 47.63451),
        Point.fromLngLat(-122.13483, 47.64041),
        Point.fromLngLat(-122.13466, 47.64422),
        Point.fromLngLat(-122.13844, 47.65440),
        Point.fromLngLat(-122.13277, 47.66515),
        Point.fromLngLat(-122.12779, 47.66712),
        Point.fromLngLat(-122.11595, 47.66712),
        Point.fromLngLat(-122.11063, 47.66735),
        Point.fromLngLat(-122.10668, 47.67035),
        Point.fromLngLat(-122.10565, 47.67498)
    )
));

//Create a line layer and pass in a gradient expression for the strokeGradient property.
map.layers.add(new LineLayer(source,
    strokeWidth(6f),

    //Pass an interpolate or step expression that represents a gradient.
    strokeGradient(
        interpolate(
            linear(),
            lineProgress(),
            stop(0, color(Color.BLUE)),
            stop(0.1, color(Color.argb(255, 65, 105, 225))), //Royal Blue
            stop(0.3, color(Color.CYAN)),
            stop(0.5, color(Color.argb(255,0, 255, 0))), //Lime
            stop(0.7, color(Color.YELLOW)),
            stop(1, color(Color.RED))
        )
    )
));
//Create a data source and add it to the map.
val source = DataSource(
    //Enable line metrics on the data source. This is needed to enable support for strokeGradient.
    withLineMetrics(true)
)
map.sources.add(source)

//Create a line and add it to the data source.
source.add(
    LineString.fromLngLats(
        Arrays.asList(
            Point.fromLngLat(-122.18822, 47.63208),
            Point.fromLngLat(-122.18204, 47.63196),
            Point.fromLngLat(-122.17243, 47.62976),
            Point.fromLngLat(-122.16419, 47.63023),
            Point.fromLngLat(-122.15852, 47.62942),
            Point.fromLngLat(-122.15183, 47.62988),
            Point.fromLngLat(-122.14256, 47.63451),
            Point.fromLngLat(-122.13483, 47.64041),
            Point.fromLngLat(-122.13466, 47.64422),
            Point.fromLngLat(-122.13844, 47.65440),
            Point.fromLngLat(-122.13277, 47.66515),
            Point.fromLngLat(-122.12779, 47.66712),
            Point.fromLngLat(-122.11595, 47.66712),
            Point.fromLngLat(-122.11063, 47.66735),
            Point.fromLngLat(-122.10668, 47.67035),
            Point.fromLngLat(-122.10565, 47.67498)
        )
    )
)

//Create a line layer and pass in a gradient expression for the strokeGradient property.
map.layers.add(
    LineLayer(
        source,
        strokeWidth(6f),

        //Pass an interpolate or step expression that represents a gradient.
        strokeGradient(
            interpolate(
                linear(),
                lineProgress(),
                stop(0, color(Color.BLUE)),
                stop(0.1, color(Color.argb(255, 65, 105, 225))),  //Royal Blue
                stop(0.3, color(Color.CYAN)),
                stop(0.5, color(Color.argb(255, 0, 255, 0))),  //Lime
                stop(0.7, color(Color.YELLOW)),
                stop(1, color(Color.RED))
            )
        )
    )
)
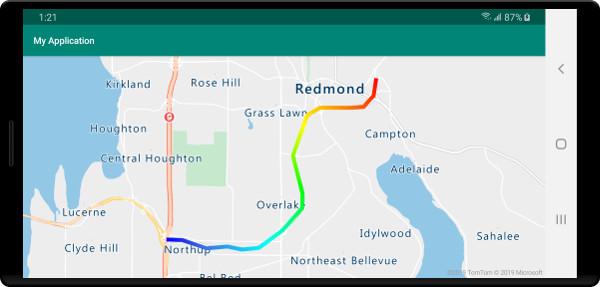
A captura de tela a seguir mostra o código acima exibindo uma linha renderizada usando uma cor de traço de gradiente.
Adicionar símbolos ao longo de uma linha
Este exemplo demonstra como adicionar ícones de seta ao longo de uma linha no mapa. Ao usar uma camada de símbolo, defina a opção symbolPlacement como SymbolPlacement.LINE. Isso renderiza os símbolos ao longo da linha e gira os ícones (0 grau = direita).
//Create a data source and add it to the map.
DataSource source = new DataSource();
map.sources.add(source);

//Load a image of an arrow into the map image sprite and call it "arrow-icon".
map.images.add("arrow-icon", R.drawable.purple_arrow_right);

//Create and add a line to the data source.
source.add(LineString.fromLngLats(Arrays.asList(
    Point.fromLngLat(-122.18822, 47.63208),
    Point.fromLngLat(-122.18204, 47.63196),
    Point.fromLngLat(-122.17243, 47.62976),
    Point.fromLngLat(-122.16419, 47.63023),
    Point.fromLngLat(-122.15852, 47.62942),
    Point.fromLngLat(-122.15183, 47.62988),
    Point.fromLngLat(-122.14256, 47.63451),
    Point.fromLngLat(-122.13483, 47.64041),
    Point.fromLngLat(-122.13466, 47.64422),
    Point.fromLngLat(-122.13844, 47.65440),
    Point.fromLngLat(-122.13277, 47.66515),
    Point.fromLngLat(-122.12779, 47.66712),
    Point.fromLngLat(-122.11595, 47.66712),
    Point.fromLngLat(-122.11063, 47.66735),
    Point.fromLngLat(-122.10668, 47.67035),
    Point.fromLngLat(-122.10565, 47.67498)))
);

//Create a line layer and add it to the map.
map.layers.add(new LineLayer(source,
    strokeColor("DarkOrchid"),
    strokeWidth(5f)
));

//Create a symbol layer and add it to the map.
map.layers.add(new SymbolLayer(source,
    //Space symbols out along line.
    symbolPlacement(SymbolPlacement.LINE),

    //Spread the symbols out 100 pixels apart.
    symbolSpacing(100f),

    //Use the arrow icon as the symbol.
    iconImage("arrow-icon"),

    //Allow icons to overlap so that they aren't hidden if they collide with other map elements.
    iconAllowOverlap(true),

    //Center the symbol icon.
    iconAnchor(AnchorType.CENTER),

    //Scale the icon size.
    iconSize(0.8f)
));
//Create a data source and add it to the map.
val source = DataSource()
map.sources.add(source)

//Load a image of an arrow into the map image sprite and call it "arrow-icon".
map.images.add("arrow-icon", R.drawable.purple_arrow_right)

//Create and add a line to the data source.
//Create and add a line to the data source.
source.add(
    LineString.fromLngLats(
        Arrays.asList(
            Point.fromLngLat(-122.18822, 47.63208),
            Point.fromLngLat(-122.18204, 47.63196),
            Point.fromLngLat(-122.17243, 47.62976),
            Point.fromLngLat(-122.16419, 47.63023),
            Point.fromLngLat(-122.15852, 47.62942),
            Point.fromLngLat(-122.15183, 47.62988),
            Point.fromLngLat(-122.14256, 47.63451),
            Point.fromLngLat(-122.13483, 47.64041),
            Point.fromLngLat(-122.13466, 47.64422),
            Point.fromLngLat(-122.13844, 47.65440),
            Point.fromLngLat(-122.13277, 47.66515),
            Point.fromLngLat(-122.12779, 47.66712),
            Point.fromLngLat(-122.11595, 47.66712),
            Point.fromLngLat(-122.11063, 47.66735),
            Point.fromLngLat(-122.10668, 47.67035),
            Point.fromLngLat(-122.10565, 47.67498)
        )
    )
)

//Create a line layer and add it to the map.
map.layers.add(
    LineLayer(
        source,
        strokeColor("DarkOrchid"),
        strokeWidth(5f)
    )
)

//Create a symbol layer and add it to the map.
map.layers.add(
    SymbolLayer(
        source,  //Space symbols out along line.
        symbolPlacement(SymbolPlacement.LINE),  //Spread the symbols out 100 pixels apart.
        symbolSpacing(100f),  //Use the arrow icon as the symbol.
        iconImage("arrow-icon"),  //Allow icons to overlap so that they aren't hidden if they collide with other map elements.
        iconAllowOverlap(true),  //Center the symbol icon.
        iconAnchor(AnchorType.CENTER),  //Scale the icon size.
        iconSize(0.8f)
    )
)
Neste exemplo, a imagem a seguir foi carregada na pasta desenhável do aplicativo.
purple-arrow-right.png |
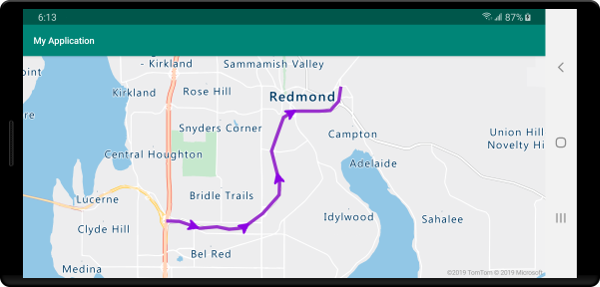
A captura de tela a seguir mostra o código acima exibindo uma linha com ícones de seta exibidos ao longo dela.
Próximas etapas
Consulte os artigos a seguir para obter mais exemplos de código para adicionar aos seus mapas: