Debug your app with GitHub Copilot in Visual Studio
In this article, you'll learn how to debug more efficiently using GitHub Copilot. Copilot can provide code fixes along with in-depth analysis and explanations of how code works. It helps with proposed fixes to bugs, and explains things such as exceptions. Copilot understands call stacks, frames, variable names, and values. As a result, you can interact with the debugger-aware AI to ask detailed questions related to your code and to debugging issues in general.
In addition, Copilot provides more precise help for a few targeted scenarios including the following:
- Exceptions
- Auto Insights for CPU Usage
To get AI assistance while you're debugging in these scenarios, look for the Ask Copilot  button. In these scenarios, Copilot already knows the context for your questions. For example, it knows the current call stack, the code line you are asking about, and the name of the exception (if one occurred), so you don't need to provide context yourself in chat.
For more information on GitHub Copilot Completions in Visual Studio, see About GitHub Copilot Completions in Visual Studio.
Prerequisites
To get started, you need:
Visual Studio 2022 version 17.8 or later
Active subscription to GitHub Copilot for Individuals or GitHub Copilot for Business
GitHub Copilot in Visual Studio
-
Note
If you experience authentication issues after installing the extension, see Troubleshooting authentication issues with GitHub Copilot Chat.
Get AI assistance to debug your app
The following simple example shows how to get AI assistance using the inline Chat view.
Note
You can also get help using the separate Chat window by selecting View > GitHub Copilot Chat. For more information, see What is the GitHub Copilot Chat extension for Visual Studio?.
Start a debugging session
In Visual Studio, create a new C# Console app.
On the start window, choose Create a new project. Type console in the search box, select C# as the language, and then choose Console App for .NET. Choose Next. Type a project name like ConsoleApp_Copilot and select Next.
Choose either the recommended target framework or .NET 8, and then choose Create.
If you don't see the Console App project template for .NET, go to Tools > Get Tools and Features, which opens the Visual Studio Installer. Choose the .NET desktop development workload, then choose Modify.
Visual Studio creates the console project, which appears in Solution Explorer in the right pane.
Replace the code in Program.cs with the following code:
using System;
using System.Collections.Generic;

public class Example
{
    public static void Main(string[] args)
    {
        int value = Int32.Parse(args[0]);
        List<String> names = null;
        if (value > 0)
            names = new List<String>();

        names.Add("Major Major Major");
    }
}
Right-click the following statement and choose Breakpoint > Insert Breakpoint.
int value = Int32.Parse(args[0]);Press F5 or select Start Debugging from the Debug menu.
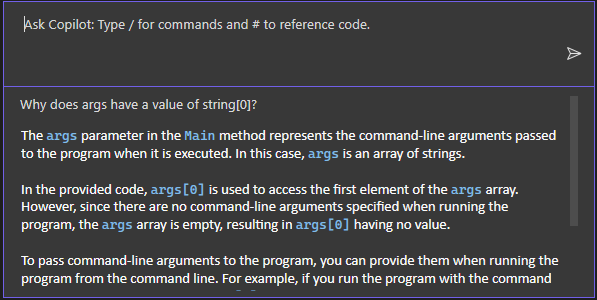
The app pauses at the breakpoint. The Autos window shows that the args variable has a value of
string[0].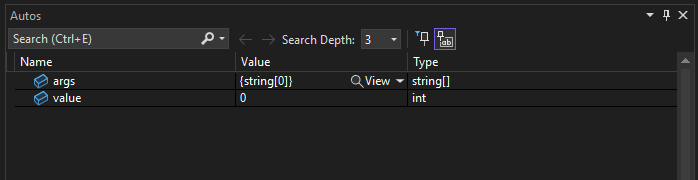
Right-click in the code and choose Ask Copilot to open the inline Chat view.
Type the following question in the inline Chat view:
Why does the args variable have a value of string[0]?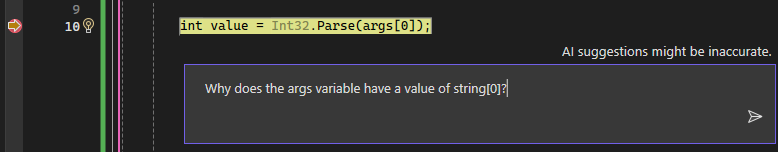
When you press Enter, Copilot provides an answer based on its understanding of your code. (You might get a different response than what is shown here.)
If Copilot has a suggested fix for your code, it shows you. If not, you can ask Copilot for a code suggestion.
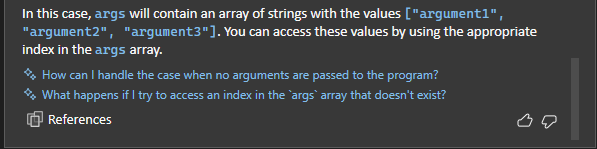
In this example, scroll to the end of the Copilot answer and select the follow-up question at the end of the inline Chat window, "How can I handle the case when no arguments are passed to the program?"
Copilot shows a suggested fix to your code.
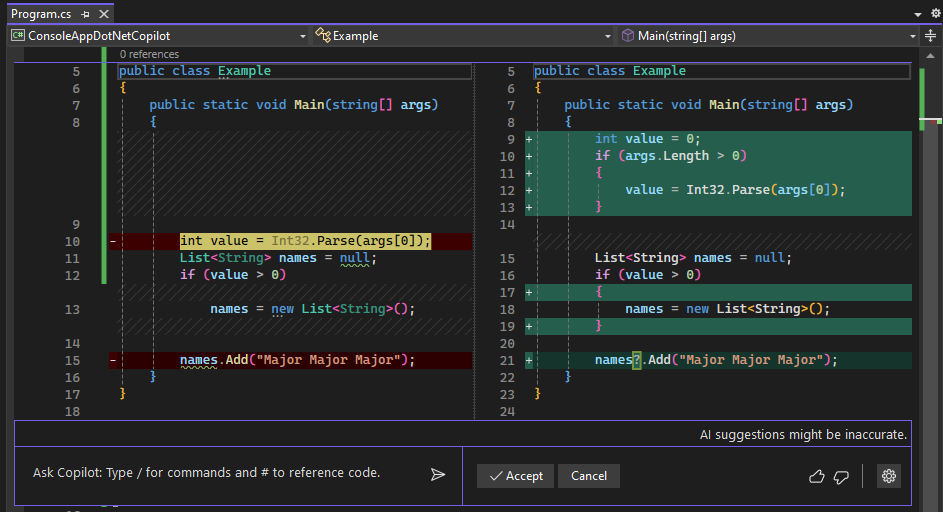
If you want to apply the code fix, choose Accept.
Choose Cancel so we can continue learning other features of Copilot in the next section.
Get AI assistance for an exception
The following simple example shows how to get AI assistance when you encounter an exception and how to quickly update your code based on AI-suggested fixes.
Start a debugging session
While paused in the debugger using the same sample app, press F11 or Debug > Step Into to execute the current statement.
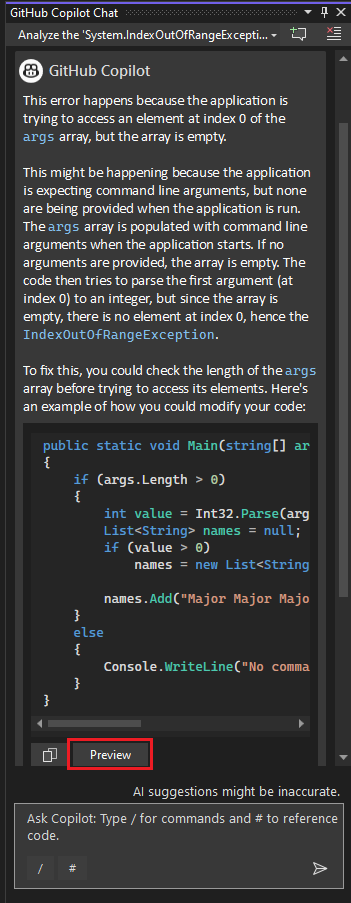
An
IndexOutOfRangeExceptionoccurs and the app pauses, showing the exception.To get AI assistance for the exception, continue to the next section.
Ask for AI assistance
With the application paused on the exception, select the Ask Copilot button.

If it's not already open, the Copilot Chat window appears and provides an assessment of the error and why it occurred. In this example, Copilot identifies a suggested code fix, a button to copy code, and a Preview button for the code fix.
If you have questions about the exception, ask them in the Ask Copilot text box.
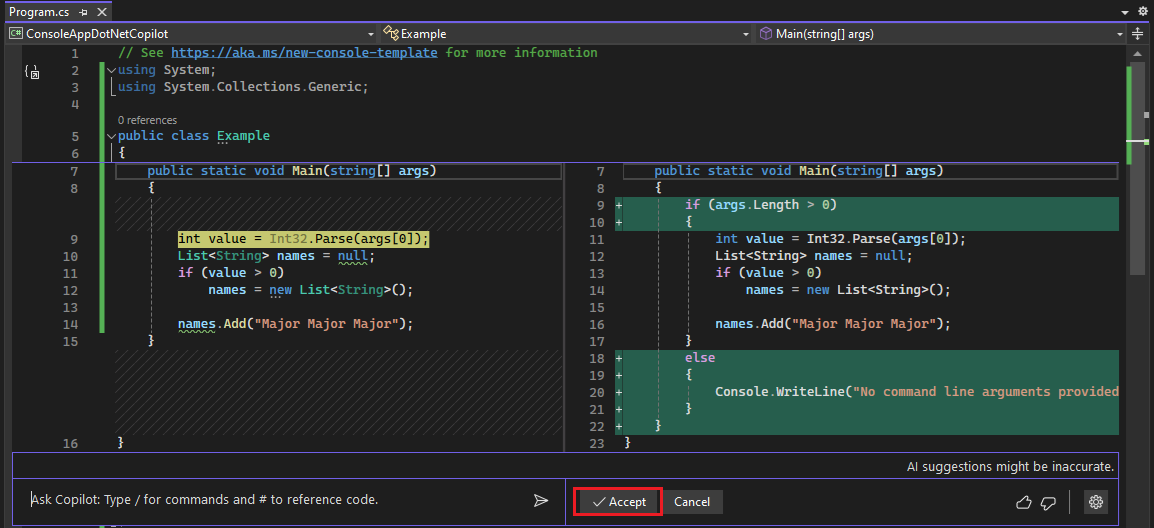
Select the Preview button.
Visual Studio shows a code preview with the suggested fix.
Review the suggested fix and choose Accept to apply the code suggestion.
Restart the debugger.
This time, no exception occurs. It has been fixed!


Get AI assistance for auto insights
In addition to interactive debugging assistance, Copilot provides detailed information in the CPU Usage Auto Insights. It provides information and insights related to a set of specific performance insights. With Copilot, ask questions about functions on the identified hot paths in your code, which can help you produce more efficient or cost-effective code.
When the CPU Usage tool provides auto insights in the Top Insights section, select Ask Copilot to learn from Copilot and start asking questions.

Feedback
În curând: Pe parcursul anului 2024, vom elimina treptat Probleme legate de GitHub ca mecanism de feedback pentru conținut și îl vom înlocui cu un nou sistem de feedback. Pentru mai multe informații, consultați: https://aka.ms/ContentUserFeedback.
Trimiteți și vizualizați feedback pentru