Microsoft 365 Reports in the admin center - Viva Goals activity
The Microsoft 365 Reports dashboard shows you the activity overview across the products in your organization. It enables you to drill to individual product level reports to give you more granular insight about the activities within each product. Check out the Reports overview topic.
In the Viva Goals report, you can understand the activity of every Viva Goals user in your organization. It also helps you to understand the level of collaboration going on by looking at the active usage and number of OKRs created.
How do I get to the Viva Goals activity report?
- In the admin center, go to the Reports, and then select Usage.
- Find Viva Goals page.
Interpret the Viva Goals report
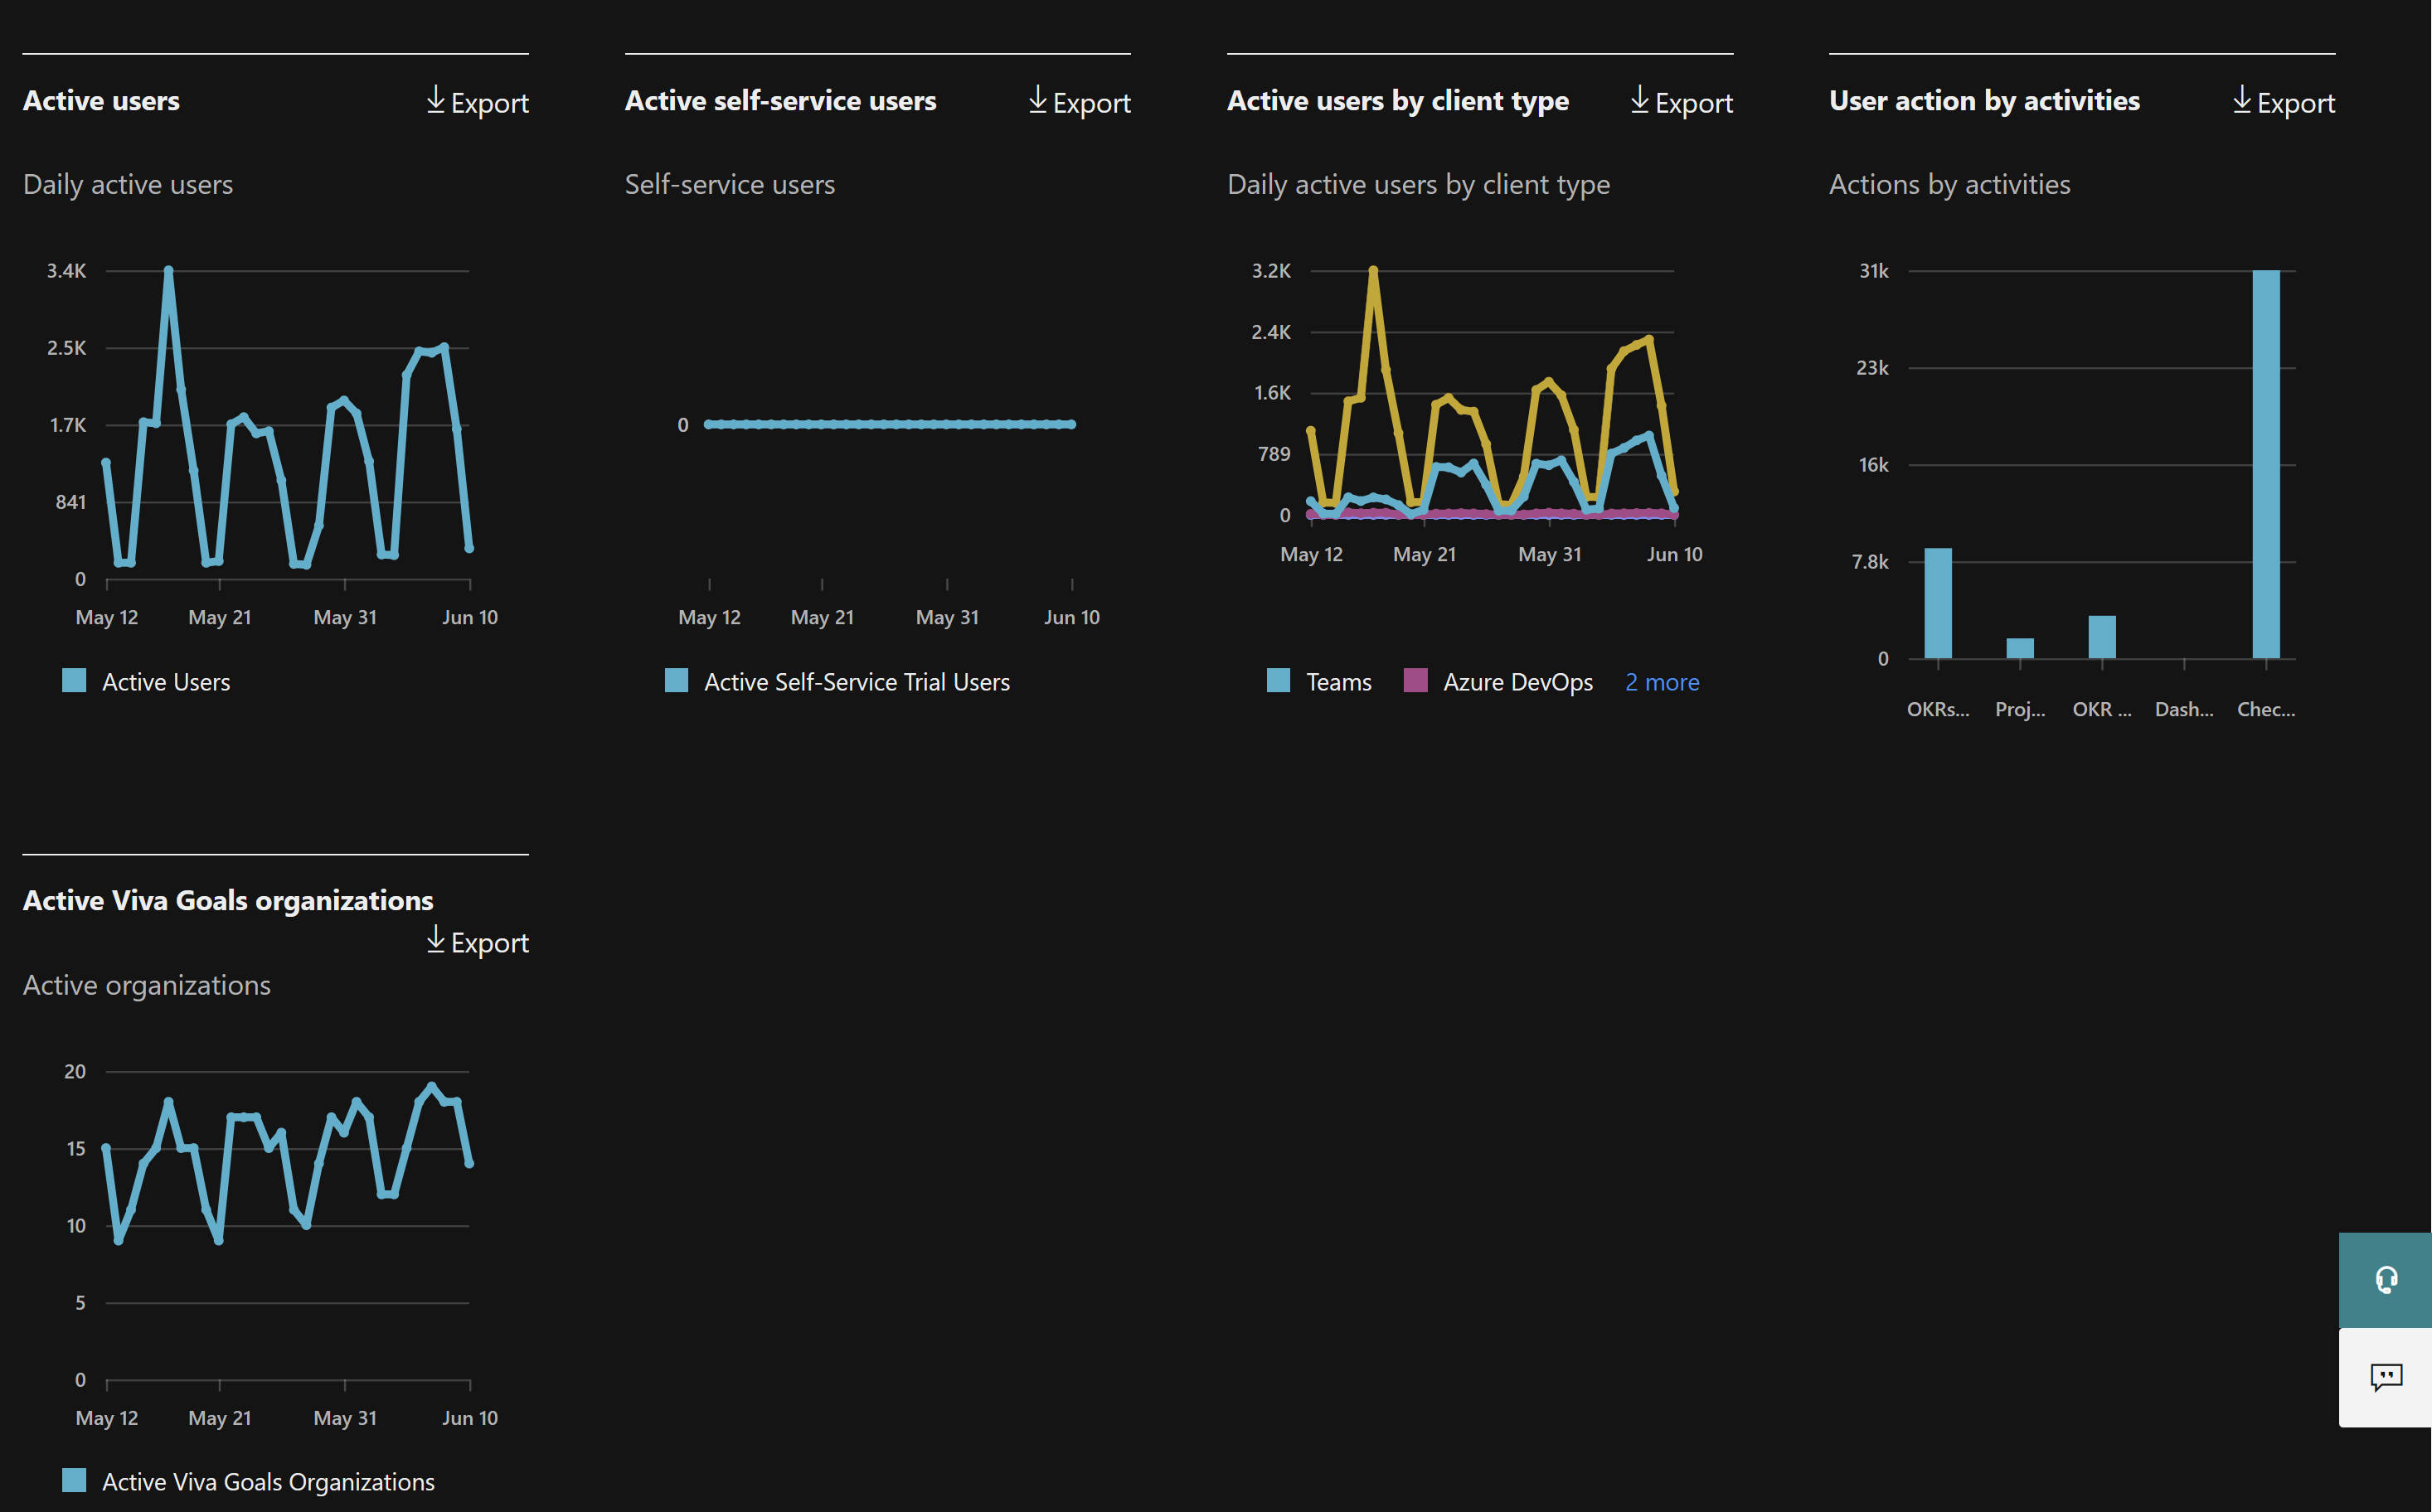
You can use this report to see the activity and usage of Viva Goals in your organization. You see the following summary charts in this report:
Active users shows you the number of daily active users on each day over time. This includes Viva Goals on the web and Teams app usage.
Active self-service users shows you the number of daily active users with self-service license each day over time.
Active users by client type shows you the number of daily active users on each day over time, displayed by client type (Viva Goals for the Web, Viva Goals on Teams, Viva Goals on Azure DevOps, and more.)
User actions by activities shows you the daily number of actions created or edited over time by Viva Goals users. This includes Viva Goals on all client types.
Active Viva Goals organizations shows you the daily active organizations each day over time. This includes all the activities in a Viva Goals organization.
The report also has a table that shows activity for each Viva Goals user in your organization.
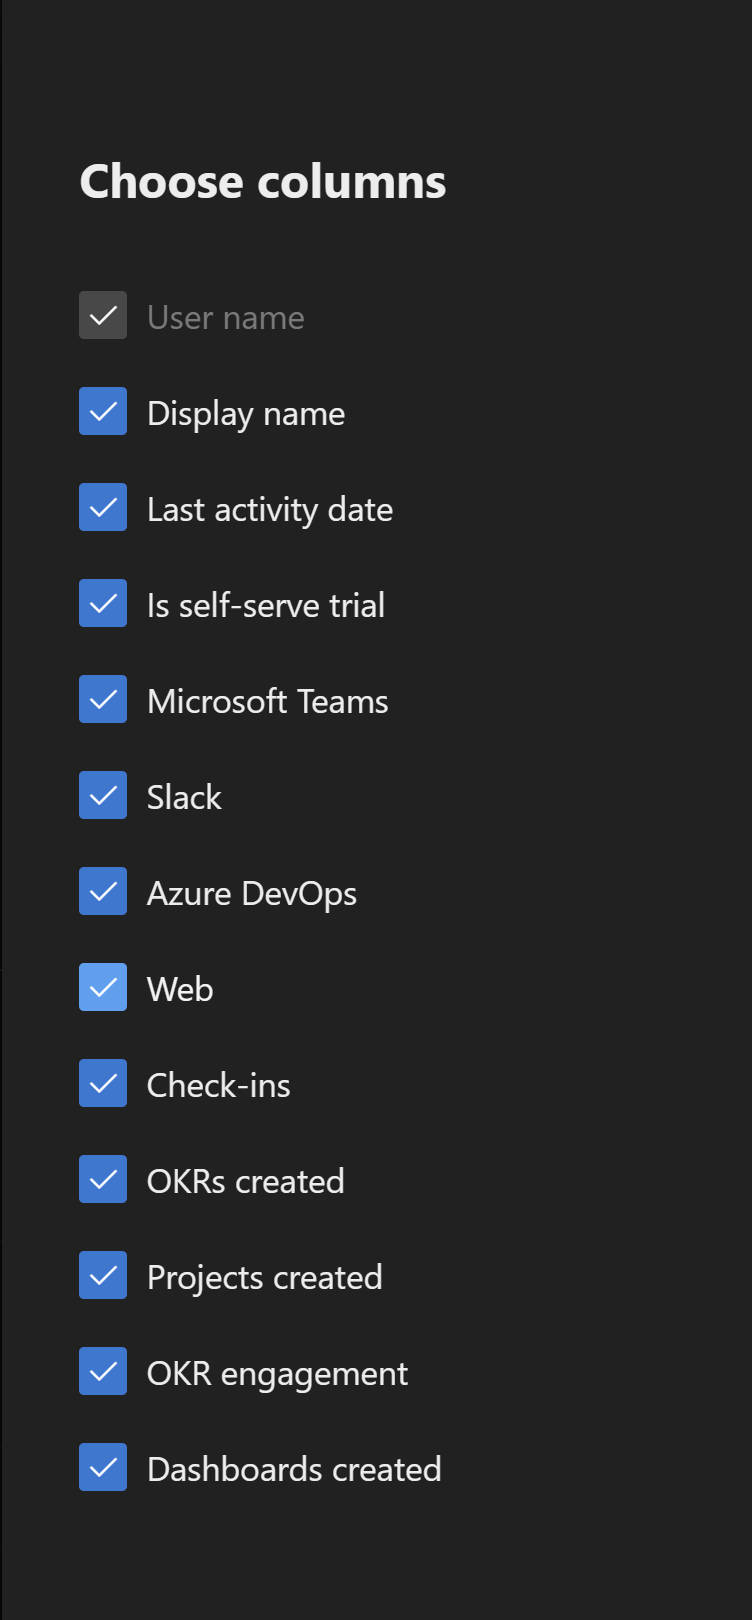
Select Choose Columns to add or remove columns from the table.
You can also export the report data into an Excel .csv file by selecting the Export link. This exports the Viva Goals usage data of all users and enables you to do simple sorting and filtering for further analysis.
The Viva Goals report can be viewed for trends over the last 7 days, 30 days, 90 days, or 180 days. If you select a particular day in the report, the per user data table will be updated accordingly to display users' usage on that day. However, this feature only works for the most recent 28 days.
User activity table
| Item | Description |
|---|---|
| User name | The user's principal name. |
| Display name | The full name of the user. |
| Last activity date | The latest date the user in that row had activity in Viva Goals, including any of the activities. |
| Is self-serve trial | Indicates whether the user has a self-serve trial license |
| Microsoft Teams | Indicates whether the user uses the Viva Goals app on Microsoft Teams |
| Slack | Indicates whether the user uses the Viva Goals integration on Slack |
| Azure DevOps | Indicates whether the user uses the Viva Goals integration on Azure DevOps |
| Web | Indicates whether the user uses Viva Goals on web |
| Check-ins | Number of check-ins done by the user on Viva Goals within the time range selected |
| OKRs created | Number of OKRs created by the user on Viva Goals within the time range selected |
| Projects created | Number of Projects created by the user on Viva Goals within the time range selected |
| OKR engagement | Number of reactions on the OKRs by the user on Viva Goals within the time range selected |
| Dashboards created | Number of Dashboards created by the user on Viva Goals within the time range selected |
Pripomienky
Pripravujeme: V priebehu roka 2024 postupne zrušíme službu Problémy v službe GitHub ako mechanizmus pripomienok týkajúcich sa obsahu a nahradíme ju novým systémom pripomienok. Ďalšie informácie nájdete na stránke: https://aka.ms/ContentUserFeedback.
Odoslať a zobraziť pripomienky pre

