Detaya gitme desteği ekleme
Bir görselin hiyerarşisi olduğunda, kullanıcıların daha fazla ayrıntıyı ortaya çıkarmak için Power BI detaya gitme özelliğini kullanmasına izin vekleyebilirsiniz.
Power BI hizmeti detaya gitme modunda Power BI detaya gitme özelliği hakkında daha fazla bilgi edinin. Görselin detaylandırma özelliğini dinamik olarak etkinleştirmesine veya devre dışı bırakmasına izin vermek için bkz . Dinamik detaya gitme denetimi.
Görselde detaya gitme desteğini etkinleştirme
Görselinizde detaya gitme eylemlerini desteklemek için adlı drill-downöğesine capabilities.json yeni bir alan ekleyin. Bu alan, detaya gitme eylemlerini etkinleştirmek istediğiniz dataRole'un adını içeren adlı roles bir özelliğe sahiptir.
    "drilldown": {
        "roles": [
            "category"
        ]
    }
Dekont
Detaya gitme dataRole türünde Grouping olmalıdır.
max dataRole koşullarında özelliği 1 olarak ayarlanmalıdır.
Rolü detaya gitme alanına ekledikten sonra, kullanıcılar veri rolüne birden çok alan sürükleyebilir.
Örneğin:
{
    "dataRoles": [
        {
            "displayName": "Category",
            "name": "category",
            "kind": "Grouping"
        },
        {
            "displayName": "Value",
            "name": "value",
            "kind": "Measure"
        }
    ],
    "drilldown": {
        "roles": [
            "category"
        ]
    },
    "dataViewMappings": [
        {
            "categorical": {
                "categories": {
                    "for": {
                        "in": "category"
                    }
                },
                "values": {
                    "select": [
                        {
                            "bind": {
                                "to": "value"
                            }
                        }
                    ]
                }
            }
        }
    ]
}
Detaya gitme desteğiyle görsel oluşturma
Detaya gitme desteğine sahip bir görsel oluşturmak için aşağıdaki komutu çalıştırın:
pbiviz new testDrillDown -t default
Varsayılan örnek görsel oluşturmak için yukarıdaki örneğinicapabilities.json yeni oluşturulan görsele uygulayın.
Kapsayıcının görselin HTML öğelerini barındıracak özelliğini div oluşturun:
"use strict";

import "core-js/stable";
import "./../style/visual.less";
// imports

export class Visual implements IVisual {
    // visual properties
    // ...
    private div: HTMLDivElement; // <== NEW PROPERTY

    constructor(options: VisualConstructorOptions) {
        // constructor body
        // ...
    }

    public update(options: VisualUpdateOptions) {
        // update method body
        // ...
    }

    /**
     * Returns properties pane formatting model content hierarchies, properties and latest formatting values, Then populate properties pane.
     * This method is called once each time we open the properties pane or when the user edits any format property.
     */
    public getFormattingModel(): powerbi.visuals.FormattingModel {
        return this.formattingSettingsService.buildFormattingModel(this.formattingSettings);
    }
}
Görselin oluşturucusunu güncelleştirin:
export class Visual implements IVisual {
    // visual properties
    // ...
    private div: HTMLDivElement;

    constructor(options: VisualConstructorOptions) {
        console.log('Visual constructor', options);
        this.formattingSettingsService = new FormattingSettingsService();
        this.target = options.element;
        this.updateCount = 0;

        if (document) {
            const new_p: HTMLElement = document.createElement("p");
            new_p.appendChild(document.createTextNode("Update count:"));
            const new_em: HTMLElement = document.createElement("em");
            this.textNode = document.createTextNode(this.updateCount.toString());
            new_em.appendChild(this.textNode);
            new_p.appendChild(new_em);
            this.div = document.createElement("div"); // <== CREATE DIV ELEMENT
            this.target.appendChild(new_p);
        }
    }
}
S oluşturmak buttoniçin görselin update yöntemini güncelleştirin:
export class Visual implements IVisual {
    // ...

    public update(options: VisualUpdateOptions) {
        this.formattingSettings = this.formattingSettingsService.populateFormattingSettingsModel(VisualFormattingSettingsModel, options.dataViews);
        console.log('Visual update', options);

        const dataView: DataView = options.dataViews[0];
        const categoricalDataView: DataViewCategorical = dataView.categorical;

        // don't create elements if no data
        if (!options.dataViews[0].categorical ||
            !options.dataViews[0].categorical.categories) {
            return
        }

        // to display current level of hierarchy
        if (typeof this.textNode !== undefined) {
            this.textNode.textContent = categoricalDataView.categories[categoricalDataView.categories.length - 1].source.displayName.toString();
        }

        // remove old elements
        // for better performance use D3js pattern:
        // https://d3js.org/#enter-exit
        while (this.div.firstChild) {
            this.div.removeChild(this.div.firstChild);
        }

        // create buttons for each category value
        categoricalDataView.categories[categoricalDataView.categories.length - 1].values.forEach( (category: powerbi.PrimitiveValue, index: number) => {
            let button = document.createElement("button");
            button.innerText = category.toString();

            this.div.appendChild(button);
        })

    }
    // ...
içinde .\style\visual.lessbasit stiller uygulama:
button {
    margin: 5px;
    min-width: 50px;
    min-height: 50px;
}
Görseli test için örnek verileri hazırlayın:
| H1 | H2 | H3 | DEĞER |
|---|---|---|---|
| A | A1 | A11 | 1 |
| A | A1 | A12 | 2 |
| A | A2 | A21 | 3 |
| A | A2 | A22 | 4 |
| A | A3 | Acar | 5 |
| A | A3 | A32 | 6 |
| K | B1 | B11 | 7 |
| K | B1 | B12 | 8 |
| K | B2 | B21 | 9 |
| K | B2 | B22 | 10 |
| K | B3 | B31 | 11 |
| K | B3 | B32 | 12 |
Power BI Desktop'ta Hiyerarşi oluşturun:
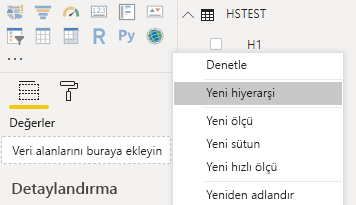
Tüm kategori sütunlarını (H1, H2, H3) yeni hiyerarşiye ekleyin:
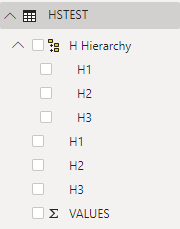
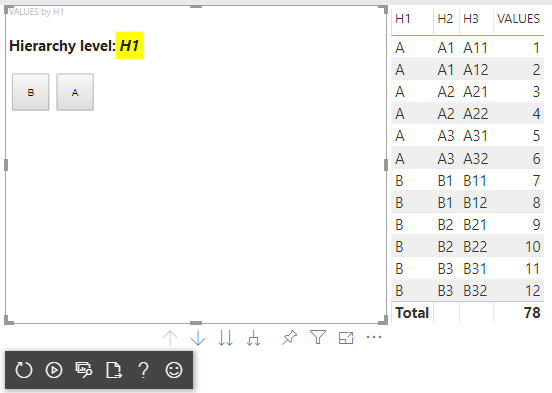
Bu adımlardan sonra aşağıdaki görseli almanız gerekir:
Görsel öğelere bağlam menüsü ekleme
Görseldeki düğmelere bağlam menüsü eklemek için:

Nesneyi görselin özelliklerine kaydedin host ve Power BI Görselleri API'sini kullanarak bağlam menüsünü görüntülemek için oluşturma seçim yöneticisine yöntemini çağırın createSelectionManager .
"use strict";

import "core-js/stable";
import "./../style/visual.less";
// default imports

import IVisualHost = powerbi.extensibility.visual.IVisualHost;
import ISelectionManager = powerbi.extensibility.ISelectionManager;
import ISelectionId = powerbi.visuals.ISelectionId;

export class Visual implements IVisual {
    // visual properties
    // ...
    private div: HTMLDivElement;
    private host: IVisualHost; // <== NEW PROPERTY
    private selectionManager: ISelectionManager; // <== NEW PROPERTY

    constructor(options: VisualConstructorOptions) {
        // constructor body
        // save the host in the visuals properties
        this.host = options.host;
        // create selection manager
        this.selectionManager = this.host.createSelectionManager();
        // ...
    }

    public update(options: VisualUpdateOptions) {
        // update method body
        // ...
    }

    // ...
}
İşlev geri çağırmanın gövdesini forEach şu şekilde değiştirin:
    categoricalDataView.categories[categoricalDataView.categories.length - 1].values.forEach( (category: powerbi.PrimitiveValue, index: number) => {
        // create selectionID for each category value
        let selectionID: ISelectionId = this.host.createSelectionIdBuilder()
            .withCategory(categoricalDataView.categories[0], index)
            .createSelectionId();

        let button = document.createElement("button");
        button.innerText = category.toString();

        // add event listener to click event
        button.addEventListener("click", (event) => {
            // call select method in the selection manager
            this.selectionManager.select(selectionID);
        });

        button.addEventListener("contextmenu", (event) => {
            // call showContextMenu method to display context menu on the visual
            this.selectionManager.showContextMenu(selectionID, {
                x: event.clientX,
                y: event.clientY
            });
            event.preventDefault();
        });

        this.div.appendChild(button);
    });
Görsele veri uygulama:
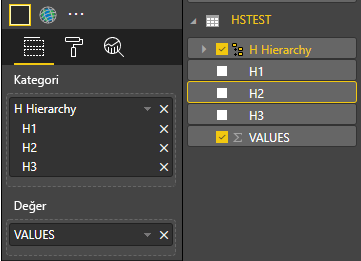
Son adımda, seçimleri ve bağlam menüsünü içeren görseli almanız gerekir:

Matris veri görünümü eşlemesi için detaya gitme desteği ekleme
Görseli matris veri görünümü eşlemeleriyle test etmek için önce örnek verileri hazırlayın:
| Satır 1 | Satır 2 | Satır 3 | Sütun 1 | Sütun 2 | Sütun 3 | Değerler |
|---|---|---|---|---|---|---|
| R1 | R11 | R111 | C1 | C11 | C111 | 1 |
| R1 | R11 | R112 | C1 | C11 | C112 | 2 |
| R1 | R11 | R113 | C1 | C11 | C113 | 3 |
| R1 | R12 | R121 | C1 | C12 | C121 | 4 |
| R1 | R12 | R122 | C1 | C12 | C122 | 5 |
| R1 | R12 | R123 | C1 | C12 | C123 | 6 |
| R1 | R13 | R131 | C1 | C13 | C131 | 7 |
| R1 | R13 | R132 | C1 | C13 | C132 | 8 |
| R1 | R13 | R133 | C1 | C13 | C133 | 9 |
| R2 | R21 | R211 | C2 | C21 | C211 | 10 |
| R2 | R21 | R212 | C2 | C21 | C212 | 11 |
| R2 | R21 | R213 | C2 | C21 | C213 | 12 |
| R2 | R22 | R221 | C2 | C22 | C221 | 13 |
| R2 | R22 | R222 | C2 | C22 | C222 | 14 |
| R2 | R22 | R223 | C2 | C22 | C223 | 16 |
| R2 | R23 | R231 | C2 | C23 | C231 | 17 |
| R2 | R23 | R232 | C2 | C23 | C232 | 18 |
| R2 | R23 | R233 | C2 | C23 | C233 | 19 |
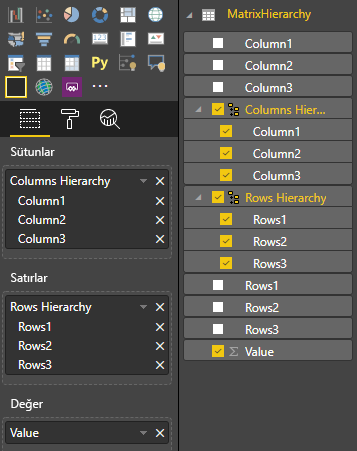
Ardından görsele aşağıdaki veri görünümü eşlemesini uygulayın:
{
    "dataRoles": [
        {
            "displayName": "Columns",
            "name": "columns",
            "kind": "Grouping"
        },
        {
            "displayName": "Rows",
            "name": "rows",
            "kind": "Grouping"
        },
        {
            "displayName": "Value",
            "name": "value",
            "kind": "Measure"
        }
    ],
    "drilldown": {
        "roles": [
            "columns",
            "rows"
        ]
    },
    "dataViewMappings": [
        {
            "matrix": {
                "columns": {
                    "for": {
                        "in": "columns"
                    }
                },
                "rows": {
                    "for": {
                        "in": "rows"
                    }
                },
                "values": {
                    "for": {
                        "in": "value"
                    }
                }
            }
        }
    ]
}
Görsele veri uygulama:
Matris veri görünümü eşlemelerini işlemek için gerekli arabirimleri içeri aktar:
// ...
import DataViewMatrix = powerbi.DataViewMatrix;
import DataViewMatrixNode = powerbi.DataViewMatrixNode;
import DataViewHierarchyLevel = powerbi.DataViewHierarchyLevel;
// ...
İki satır ve sütun öğesi için iki divözellik oluşturun:
export class Visual implements IVisual {
    // ...
    private rowsDiv: HTMLDivElement;
    private colsDiv: HTMLDivElement;
    // ...
    constructor(options: VisualConstructorOptions) {
        // constructor body
        // ...
        // Create div elements and append to main div of the visual
        this.rowsDiv = document.createElement("div");
        this.target.appendChild(this.rowsDiv);

        this.colsDiv = document.createElement("div");
        this.target.appendChild(this.colsDiv);
    }
    // ...
}
Öğeleri işlemeden önce verileri denetleyin ve geçerli hiyerarşi düzeyini görüntüleyin:
export class Visual implements IVisual {
    // ...
    constructor(options: VisualConstructorOptions) {
        // constructor body
    }

    public update(options: VisualUpdateOptions) {
        this.formattingSettings = this.formattingSettingsService.populateFormattingSettingsModel(VisualFormattingSettingsModel, options.dataViews);
        console.log('Visual update', options);

        const dataView: DataView = options.dataViews[0];
        const matrixDataView: DataViewMatrix = dataView.matrix;

        // if the visual doesn't receive the data no reason to continue rendering
        if (!matrixDataView ||
            !matrixDataView.columns ||
            !matrixDataView.rows ) {
            return
        }

        // to display current level of hierarchy
        if (typeof this.textNode !== undefined) {
            this.textNode.textContent = categoricalDataView.categories[categoricalDataView.categories.length - 1].source.displayName.toString();
        }
        // ...
    }
    // ...
}
Hiyerarşide gezinmek için işlev treeWalker oluşturma:
export class Visual implements IVisual {
    // ...
    public update(options: VisualUpdateOptions) {
        // ...

        // if the visual doesn't receive the data no reason to continue rendering
        if (!matrixDataView ||
            !matrixDataView.columns ||
            !matrixDataView.rows ) {
            return
        }

        const treeWalker = (matrixNode: DataViewMatrixNode, index: number, levels: DataViewHierarchyLevel[], div: HTMLDivElement)  => {
            // ...
            if (matrixNode.children) {
                // ...
                // traversing child nodes
                matrixNode.children.forEach((node, index) => treeWalker(node, index, levels, childDiv));
            }
        }

        // traversing rows
        const rowRoot: DataViewMatrixNode = matrixDataView.rows.root;
        rowRoot.children.forEach((node, index) => treeWalker(node, index, matrixDataView.rows.levels, this.rowsDiv));

        // traversing columns
        const colRoot = matrixDataView.columns.root;
        colRoot.children.forEach((node, index) => treeWalker(node, index, matrixDataView.columns.levels, this.colsDiv));
    }
    // ...
}
Veri noktaları için seçimleri oluşturun.
const treeWalker = (matrixNode: DataViewMatrixNode, index: number, levels: DataViewHierarchyLevel[], div: HTMLDivElement)  => {
    // generate selectionID for each node of matrix
    const selectionID: ISelectionID = this.host.createSelectionIdBuilder()
        .withMatrixNode(matrixNode, levels)
        .createSelectionId();
    // ...
    if (matrixNode.children) {
        // ...
        // traversing child nodes
        matrixNode.children.forEach((node, index) => treeWalker(node, index, levels, childDiv));
    }
}
Her hiyerarşi düzeyi için oluşturma div :
const treeWalker = (matrixNode: DataViewMatrixNode, index: number, levels: DataViewHierarchyLevel[], div: HTMLDivElement)  => {
    // generate selectionID for each node of matrix
    const selectionID: ISelectionID = this.host.createSelectionIdBuilder()
        .withMatrixNode(matrixNode, levels)
        .createSelectionId();
    // ...
    if (matrixNode.children) {
        // create div element for level
        const childDiv = document.createElement("div");
        // add to current div
        div.appendChild(childDiv);
        // create paragraph element to display next
        const p = document.createElement("p");
        // display level name on paragraph element
        const level = levels[matrixNode.level];
        p.innerText = level.sources[level.sources.length - 1].displayName;
        // add paragraph element to created child div
        childDiv.appendChild(p);
        // traversing child nodes
        matrixNode.children.forEach((node, index) => treeWalker(node, index, levels, childDiv));
    }
}
Matris veri noktaları için görselle etkileşim kurmak ve bağlam menüsünü görüntülemek için oluşturun buttons :
const treeWalker = (matrixNode: DataViewMatrixNode, index: number, levels: DataViewHierarchyLevel[], div: HTMLDivElement)  => {
    // generate selectionID for each node of matrix
    const selectionID: ISelectionID = this.host.createSelectionIdBuilder()
        .withMatrixNode(matrixNode, levels)
        .createSelectionId();

    // create button element
    let button = document.createElement("button");
    // display node value/name of the button's text
    button.innerText = matrixNode.value.toString();

    // add event listener on click
    button.addEventListener("click", (event) => {
        // call select method in the selection manager
        this.selectionManager.select(selectionID);
    });

    // display context menu on click
    button.addEventListener("contextmenu", (event) => {
        // call showContextMenu method to display context menu on the visual
        this.selectionManager.showContextMenu(selectionID, {
            x: event.clientX,
            y: event.clientY
        });
        event.preventDefault();
    });

    div.appendChild(button);

    if (matrixNode.children) {
        // ...
    }
}
Öğeleri yeniden işlemeden önce öğeleri temizleyin div :
public update(options: VisualUpdateOptions) {
    // ...
    const treeWalker = (matrixNode: DataViewMatrixNode, index: number, levels: DataViewHierarchyLevel[], div: HTMLDivElement)  => {
        // ...
    }

    // remove old elements
    // to better performance use D3js pattern:
    // https://d3js.org/#enter-exit
    while (this.rowsDiv.firstChild) {
        this.rowsDiv.removeChild(this.rowsDiv.firstChild);
    }
    // create label for row elements
    const prow = document.createElement("p");
    prow.innerText = "Rows";
    this.rowsDiv.appendChild(prow);

    while (this.colsDiv.firstChild) {
        this.colsDiv.removeChild(this.colsDiv.firstChild);
    }
    // create label for columns elements
    const pcol = document.createElement("p");
    pcol.innerText = "Columns";
    this.colsDiv.appendChild(pcol);

    // render elements for rows
    const rowRoot: DataViewMatrixNode = matrixDataView.rows.root;
    rowRoot.children.forEach((node, index) => treeWalker(node, index, matrixDataView.rows.levels, this.rowsDiv));

    // render elements for columns
    const colRoot = matrixDataView.columns.root;
    colRoot.children.forEach((node, index) => treeWalker(node, index, matrixDataView.columns.levels, this.colsDiv));
}
Son olarak, bağlam menüsüne sahip bir görsel almanız gerekir:
İlgili içerik
Geri Bildirim
Çok yakında: 2024 boyunca, içerik için geri bildirim mekanizması olarak GitHub Sorunları’nı kullanımdan kaldıracak ve yeni bir geri bildirim sistemiyle değiştireceğiz. Daha fazla bilgi için bkz. https://aka.ms/ContentUserFeedback.
Gönderin ve geri bildirimi görüntüleyin