通过监视,可以深入了解系统的行为和运行状况,并有助于构建环境的整体视图、历史趋势、关联各种因素并衡量性能、消耗或错误率的变化。
Azure Functions 提供与 Application Insights 的内置集成。 可从 Application Insights 中获取函数应用实例数或函数的请求和依赖项遥测等信息。 使用 Functions 和事件中心时,Application Insights 还可以跟踪到事件中心的传出依赖项遥测、计算队列中花费的时间并显示通过事件中心连接的系统的端到端流。
本部分介绍可从事件中心和 Functions 解决方案的 Application Insights 获取的有用功能和见解。
应用程序地图
应用程序映射显示系统中组件之间的交互方式。 借助 Application Insights 提供的依赖项遥测,可以映射 Azure Functions 和事件中心之间的事件流,包括事件中心中每个函数执行的平均值和事件的平均持续时间,并显示包含故障的事务(标为红色)。
将预期负载发送到系统后,可以在 Azure 门户中转到 Application Insights,然后在边栏上选择“应用程序映射”。 下面的映射显示写入下游数据库时的三个函数、三个事件中心以及一目了然的故障:

端到端事务详细信息
端到端事务详细信息显示系统组件如何按时间顺序彼此交互。 此视图还显示事件在队列中花费的时间。 还可以通过此视图深入了解每个组件的遥测信息,这样在出现问题时可以更轻松地在同一请求中的组件间进行故障排除。

平台指标和遥测
Azure Monitor 中适用于事件中心和 Azure Functions 的平台生成的指标可用于全面监视解决方案行为和运行状况:
Azure Monitor 中的 Azure 事件中心指标可用于捕获事件中心的有用见解(例如传入请求、传出请求、受限制请求、成功请求、传入消息、传出消息、捕获的消息、传入字节、传出字节、捕获的字节、用户错误的聚合信息)。
Azure Functions 指标共享 Azure 应用服务中的许多指标,并添加了函数执行计数和函数执行单位,可用于了解消耗计划的利用率和成本。 其他有帮助的指标包括连接、数据输入、数据输出、平均内存工作集、线程计数、请求和响应时间。
Azure Functions 与 Application Insights 集成,以提供对 Functions 主机和函数执行的高级详细遥测和见解。 有关详细信息,请参阅在 Application Insights 中分析 Azure Functions 遥测。 使用 Application Insights 监视拓扑时,有多种配置可用。 若要了解详细信息,请参阅如何配置对 Azure Functions 的监视。
下面是在“跟踪”表中生成的事件中心触发函数的额外遥测示例:
Trigger Details: PartionId: 6, Offset: 3985758552064-3985758624640, EnqueueTimeUtc: 2022-10-31T12:51:58.1750000+00:00-2022-10-31T12:52:03.8160000+00:00, SequenceNumber: 3712266-3712275, Count: 10
此信息要求使用事件中心扩展 4.2.0 或更高版本。 此数据非常有用,因为它包含触发函数执行的消息的相关信息,可用于查询和获取见解。 其中包括针对每次函数触发的以下数据:
- 分区 ID (6)
- 分区偏移范围 (3985758552064-3985758624640)
- UTC 格式的排队时间范围 (2022-10-31T12:51:58.1750000+00:00-2022-10-31T12:52:03.8160000+00:00)
- 序列号范围 3712266-3712275
- 以及消息计数 (10)
有关如何使用此遥测的示例,请参阅示例 Application Insights 查询。
自定义遥测也可以用于不同的语言(C# 类库、C# 隔离、C# 脚本、JavaScript、Java、PowerShell 和 Python)。 此日志记录显示在 Application Insights 的“跟踪”表中。 可以在 Application Insights 中创建自己的条目,并添加可用于查询数据和创建自定义仪表板的自定义维度。
最后,当函数应用使用输出绑定连接到事件中心时,这些条目也会写入 Application Insights 依赖项表。

对于事件中心,关联将注入到事件有效负载中,并在事件中看到 Diagnostic-Id 属性:

这遵循 W3C 跟踪上下文格式,该格式在 Functions 创建的遥测中也用作“操作 ID”和“操作链接”,从而让 Application Insights 能在事件中心事件和函数执行之间建立关联(即使它们是分布式的)。

示例 Application Insights 查询
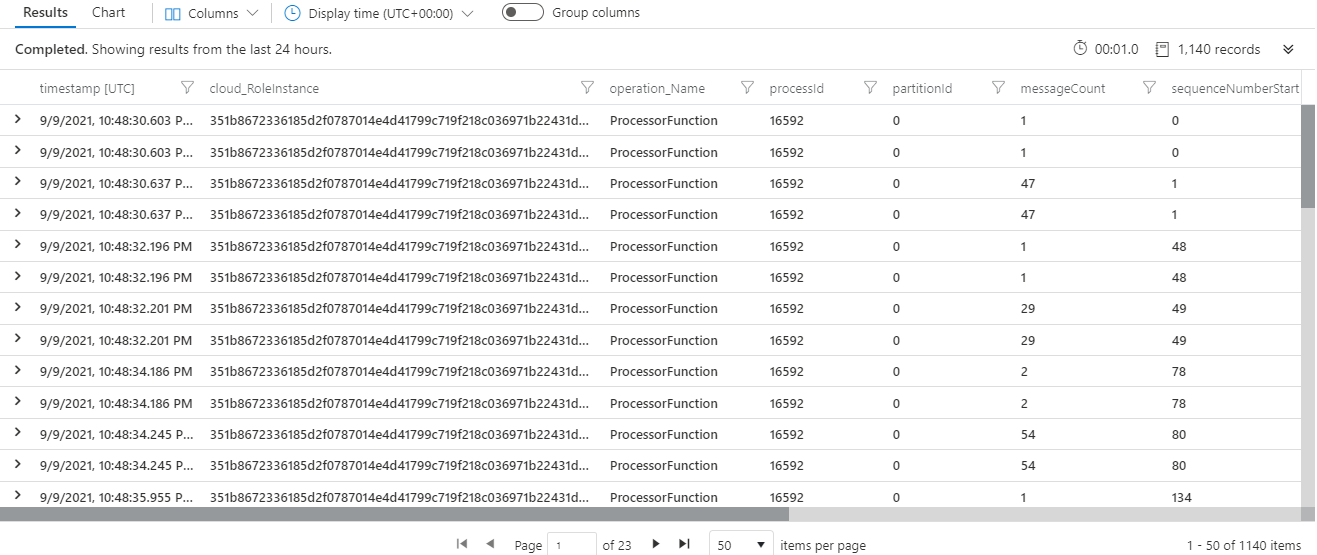
下面是使用 Azure Functions 监视事件中心时有用的 Application Insights 查询列表。 此查询显示使用由事件中心扩展 4.2.0 及更高版本发出的遥测的事件中心触发函数的详细信息。
在 Application Insights 中启用采样时,数据中可能存在间隙。
详细的事件处理信息
仅当使用批处理调度时,才会以正确的格式发出数据。 批量调度意味着函数为每个执行接受多个事件,这是可提高性能的推荐做法。 请谨记以下注意事项:
dispatchTimeMilliseconds值近似于从将事件写入事件中心到函数应用选取事件进行处理之间的时间长度。- 当事件中心服务器和函数应用之间存在时钟偏移时,可能会导致
dispatchTimeMilliseconds为负值或不准确。 - 事件中心分区按顺序处理。 在处理完所有以前的消息之前,不会将消息调度到函数代码进行处理。 监视函数的执行时间,因为较长的执行时间将导致调度延迟。
- 计算将使用批处理中第一条消息的 enqueueTime。 批处理中其他消息的调度时间可能较低。
dispatchTimeMilliseconds基于时间点。- 序列号是按分区计算的,并且可能会发生重复处理,因为事件中心不保证“恰好一次”消息传递。
traces
| where message startswith "Trigger Details: Parti"
| parse message with * "tionId: " partitionId:string ", Offset: "
offsetStart:string "-" offsetEnd:string", EnqueueTimeUtc: "
enqueueTimeStart:datetime "+00:00-" enqueueTimeEnd:datetime "+00:00, SequenceNumber: "
sequenceNumberStart:string "-" sequenceNumberEnd:string ", Count: "
messageCount:int
| extend dispatchTimeMilliseconds = (timestamp - enqueueTimeStart) / 1ms
| project timestamp, cloud_RoleInstance, operation_Name, processId =
customDimensions.ProcessId, partitionId, messageCount, sequenceNumberStart,
sequenceNumberEnd, enqueueTimeStart, enqueueTimeEnd, dispatchTimeMilliseconds
调度延迟可视化
此查询可视化给定事件中心触发的函数的第 50 个百分位和第 90 个百分位事件调度延迟。 有关更多详细信息和注释,请参阅上述查询。
traces
| where operation_Name == "<ENTER THE NAME OF YOUR FUNCTION HERE>"
| where message startswith "Trigger Details: Parti"
| parse message with * "tionId: " partitionId:string ", Offset: "
offsetStart:string "-" offsetEnd:string", EnqueueTimeUtc: "
enqueueTimeStart:datetime "+00:00-" enqueueTimeEnd:datetime "+00:00, SequenceNumber: "
sequenceNumberStart:string "-" sequenceNumberEnd:string ", Count: "
messageCount:int
| extend dispatchTimeMilliseconds = (timestamp - enqueueTimeStart) / 1ms
| summarize percentiles(dispatchTimeMilliseconds, 50, 90) by bin(timestamp, 5m)
| render timechart

调度延迟摘要
此查询与上述查询类似,但显示摘要视图。
traces
| where message startswith "Trigger Details: Parti"
| parse message with * "tionId: " partitionId:string ", Offset: "
offsetStart:string "-" offsetEnd:string", EnqueueTimeUtc: "
enqueueTimeStart:datetime "+00:00-" enqueueTimeEnd:datetime "+00:00, SequenceNumber: "
sequenceNumberStart:string "-" sequenceNumberEnd:string ", Count: "
messageCount:int
| extend dispatchTimeMilliseconds = (timestamp - enqueueTimeStart) / 1ms
| summarize messageCount = sum(messageCount),
percentiles(dispatchTimeMilliseconds, 50, 90, 99, 99.9, 99.99) by operation_Name

跨分区的消息分发
此查询演示如何可视化跨分区的消息分发。
traces
| where message startswith "Trigger Details: Parti"
| parse message with * "tionId: " partitionId:string ", Offset: "
offsetStart:string "-" offsetEnd:string", EnqueueTimeUtc: "
enqueueTimeStart:datetime "+00:00-" enqueueTimeEnd:datetime "+00:00, SequenceNumber: "
sequenceNumberStart:string "-" sequenceNumberEnd:string ", Count: "
messageCount:int
| summarize messageCount = sum(messageCount) by cloud_RoleInstance,
bin(timestamp, 5m)
| render areachart kind=stacked

跨实例的消息分发
此查询显示如何可视化跨实例的消息分发。
traces
| where message startswith "Trigger Details: Parti"
| parse message with * "tionId: " partitionId:string ", Offset: "
offsetStart:string "-" offsetEnd:string", EnqueueTimeUtc: "
enqueueTimeStart:datetime "+00:00-" enqueueTimeEnd:datetime "+00:00, SequenceNumber: "
sequenceNumberStart:string "-" sequenceNumberEnd:string ", Count: "
messageCount:int
| summarize messageCount = sum(messageCount) by cloud_RoleInstance,
bin(timestamp, 5m)
| render areachart kind=stacked

正在执行的实例和已分配的实例
此查询演示如何可视化正在处理来自事件中心的事件的 Azure Functions 实例数,以及正在处理和等待租用的实例总数。 大多数时候它们应该是相同的。
traces
| where message startswith "Trigger Details: Parti"
| summarize type = "Executing Instances", Count = dcount(cloud_RoleInstance) by
bin(timestamp, 60s)
| union (
    traces
    | summarize type = "Allocated Instances", Count = dcount(cloud_RoleInstance) by
bin(timestamp, 60s)
)
| project timestamp, type, Count
| render timechart

特定函数执行的所有遥测
operation_Id 字段可用于 Application Insights 中的不同表。 例如,对于事件中心触发的 Azure Functions,以下示例查询将生成触发器信息、函数代码中日志的遥测以及依赖项和异常:
union isfuzzy=true requests, exceptions, traces, dependencies
| where * has "<ENTER THE OPERATION_ID OF YOUR FUNCTION EXECUTION HERE>"
| order by timestamp asc

事件的端到端延迟
由于触发器详细信息跟踪中的 enqueueTimeUtc 属性仅显示函数处理的每个批处理的第一个事件的排队时间,因此可以使用更高级的查询来计算两个函数间(事件中心介于两者之间)的事件的端到端延迟。 此查询将展开第二个函数请求中的操作链接(如果有),并将其结束时间映射到第一个函数开始时间对应的操作 ID。
let start = view(){
requests
| where operation_Name == "FirstFunction"
| project start_t = timestamp, first_operation_Id = operation_Id
};
let link = view(){
requests
| where operation_Name == "SecondFunction"
| mv-expand ex = parse_json(tostring(customDimensions["_MS.links"]))
| extend parent = case(isnotempty(ex.operation_Id), ex.operation_Id, operation_Id )
| project first_operation_Id = parent, second_operation_Id = operation_Id
};
let finish = view(){
traces
| where customDimensions["EventName"] == "FunctionCompleted" and operation_Name
== "SecondFunction"
| project end_t = timestamp, second_operation_Id = operation_Id
};
start
| join kind=inner (
link
| join kind=inner finish on second_operation_Id
) on first_operation_Id
| project start_t, end_t, first_operation_Id, second_operation_Id
| summarize avg(datetime_diff('second', end_t, start_t))

作者
本文由 Microsoft 维护, 最初由以下贡献者撰写。
主要作者:
- David Barkol | 首席解决方案专家 GBB
若要查看非公开的 LinkedIn 个人资料,请登录到 LinkedIn。
后续步骤
有关详细信息,请考虑查看以下相关文章:
- 监视无服务器事件处理
- 在 Application Insights 中分析 Azure Functions 遥测数据
- 为 Azure Functions 配置监视
- 在 Application Insights 中分析 Azure Functions 遥测数据
- Azure Monitor 中的指标 - Azure 事件中心
- Kusto 查询语言
相关资源
- 监视无服务器事件处理提供了有关监视事件驱动式无服务器体系结构的指导。
- 无服务器事件处理是一个参考体系结构,详细说明了此类型的典型体系结构,其中包含代码示例和重要注意事项的讨论。
- 使用事件中心在无服务器事件处理中取消批处理并筛选更详细地介绍了该参考体系结构的这些部分的工作原理。