你当前正在访问 Microsoft Azure Global Edition 技术文档网站。 如果需要访问由世纪互联运营的 Microsoft Azure 中国技术文档网站,请访问 https://docs.azure.cn。
向地图添加线条层 (Android SDK)
注意
Azure Maps Android SDK 停用
适用于 Android 的 Azure Maps 本机 SDK 现已弃用,将于 2025 年 3 月 31 日停用。 为了避免服务中断,请在 2025 年 3 月 31 日之前迁移到 Azure Maps Web SDK。 有关详细信息,请参阅 Azure Maps Android SDK 迁移指南。
线条层可用于将 LineString 和 MultiLineString 特征呈现为地图上的路径或路由。 线条层还可用于呈现 Polygon 和 MultiPolygon 特征的轮廓。 数据源连接到线条层以向它提供要呈现的数据。
提示
默认情况下,线条层将呈现数据源中的多边形和线条的坐标。 若要限制层以便仅呈现 LineString 几何图形功能,请将层的 filter 选项设置为 eq(geometryType(), "LineString")。 如果还需要包含 MultiLineString 特征,请将层的 filter 选项设置为 any(eq(geometryType(), "LineString"), eq(geometryType(), "MultiLineString"))。
先决条件
请务必完成快速入门:创建 Android 应用文档中的步骤。 可以将本文中的代码块插入到地图的 onReady 事件处理程序中。
添加线条层
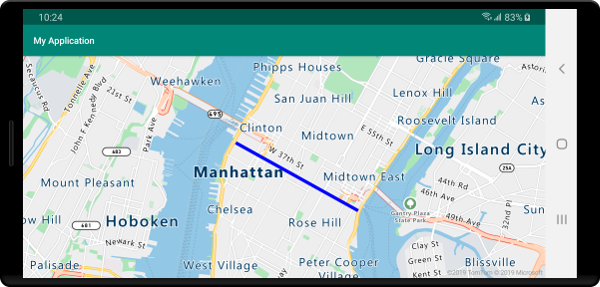
以下代码演示如何创建线条。 将线条添加到数据源,然后使用 LineLayer 类通过线条层呈现它。
//Create a data source and add it to the map.
DataSource source = new DataSource();
map.sources.add(source);

//Create a list of points.
List<Point> points = Arrays.asList(
    Point.fromLngLat(-73.97234, 40.74327),
    Point.fromLngLat(-74.00442, 40.75680));

//Create a LineString geometry and add it to the data source.
source.add(LineString.fromLngLats(points));

//Create a line layer and add it to the map.
LineLayer layer = new LineLayer(source,
    strokeColor("blue"),
    strokeWidth(5f)
);

map.layers.add(layer);
//Create a data source and add it to the map.
val source = DataSource()
map.sources.add(source)

//Create a list of points.
val points = asList(
    Point.fromLngLat(-73.97234, 40.74327),
    Point.fromLngLat(-74.00442, 40.75680)
)

//Create a LineString geometry and add it to the data source.
source.add(LineString.fromLngLats(points))

//Create a line layer and add it to the map.
val layer = LineLayer(
    source,
    strokeColor("blue"),
    strokeWidth(5f)
)

map.layers.add(layer)
以下屏幕截图显示了在线条层中呈现线条的上述代码。
数据驱动的线条样式
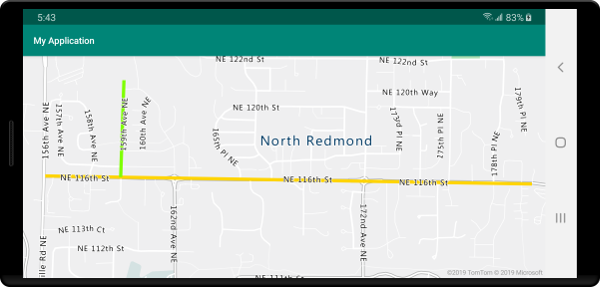
下面的代码创建两个行特征,并将速度限制值作为属性添加到每一行。 线条层使用数据驱动样式表达式根据速度限制值为线条着色。 由于线条数据沿道路叠加,下方的代码将线条层添加到标签层下方,以便仍然可以清楚地读取道路标签。
//Create a data source and add it to the map.
DataSource source = new DataSource();
map.sources.add(source);

//Create a line feature.
Feature feature = Feature.fromGeometry(
    LineString.fromLngLats(Arrays.asList(
        Point.fromLngLat(-122.131821, 47.704033),
        Point.fromLngLat(-122.099919, 47.703678))));

//Add a property to the feature.
feature.addNumberProperty("speedLimitMph", 35);

//Add the feature to the data source.
source.add(feature);

//Create a second line feature.
Feature feature2 = Feature.fromGeometry(
    LineString.fromLngLats(Arrays.asList(
        Point.fromLngLat(-122.126662, 47.708265),
        Point.fromLngLat(-122.126877, 47.703980))));

//Add a property to the second feature.
feature2.addNumberProperty("speedLimitMph", 15);

//Add the second feature to the data source.
source.add(feature2);

//Create a line layer and add it to the map.
LineLayer layer = new LineLayer(source,
    strokeColor(
        interpolate(
            linear(),
            get("speedLimitMph"),
            stop(0, color(Color.GREEN)),
            stop(30, color(Color.YELLOW)),
            stop(60, color(Color.RED))
        )
    ),
    strokeWidth(5f)
);

map.layers.add(layer, "labels");
//Create a data source and add it to the map.
val source = DataSource()
map.sources.add(source)

//Create a line feature.
val feature = Feature.fromGeometry(
    LineString.fromLngLats(
        Arrays.asList(
            Point.fromLngLat(-122.131821, 47.704033),
            Point.fromLngLat(-122.099919, 47.703678)
        )
    )
)

//Add a property to the feature.
feature.addNumberProperty("speedLimitMph", 35)

//Add the feature to the data source.
source.add(feature)

//Create a second line feature.
val feature2 = Feature.fromGeometry(
    LineString.fromLngLats(
        Arrays.asList(
            Point.fromLngLat(-122.126662, 47.708265),
            Point.fromLngLat(-122.126877, 47.703980)
        )
    )
)

//Add a property to the second feature.
feature2.addNumberProperty("speedLimitMph", 15)

//Add the second feature to the data source.
source.add(feature2)

//Create a line layer and add it to the map.
val layer = LineLayer(
    source,
    strokeColor(
        interpolate(
            linear(),
            get("speedLimitMph"),
            stop(0, color(Color.GREEN)),
            stop(30, color(Color.YELLOW)),
            stop(60, color(Color.RED))
        )
    ),
    strokeWidth(5f)
)

map.layers.add(layer, "labels")
以下屏幕截图显示上述代码在线条层中呈现两行,其颜色基于行特征中的属性从数据驱动样式表达式中检索。
向线条添加笔划渐变
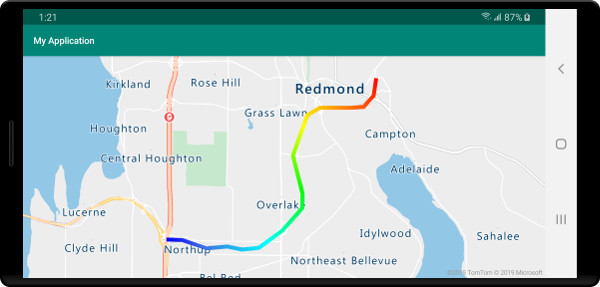
可以将一种笔划颜色应用于线条。 还可以使用颜色渐变填充线条,以显示从一个线段到下一个线段的转换。 例如,线条渐变可用于表示随时间和距离推移的变化,或是一连串连接的对象间的不同温度。 若要将此特征应用于线条,数据源必须将 lineMetrics 选项设置为 true,随后可以将颜色渐变表达式传递到线条的 strokeColor 选项。 笔划渐变表达式必须引用将计算线条指标公开给表达式的 lineProgress 数据表达式。
//Create a data source and add it to the map.
DataSource source = new DataSource(
    //Enable line metrics on the data source. This is needed to enable support for strokeGradient.
    withLineMetrics(true)
);
map.sources.add(source);

//Create a line and add it to the data source.
source.add(LineString.fromLngLats(
    Arrays.asList(
        Point.fromLngLat(-122.18822, 47.63208),
        Point.fromLngLat(-122.18204, 47.63196),
        Point.fromLngLat(-122.17243, 47.62976),
        Point.fromLngLat(-122.16419, 47.63023),
        Point.fromLngLat(-122.15852, 47.62942),
        Point.fromLngLat(-122.15183, 47.62988),
        Point.fromLngLat(-122.14256, 47.63451),
        Point.fromLngLat(-122.13483, 47.64041),
        Point.fromLngLat(-122.13466, 47.64422),
        Point.fromLngLat(-122.13844, 47.65440),
        Point.fromLngLat(-122.13277, 47.66515),
        Point.fromLngLat(-122.12779, 47.66712),
        Point.fromLngLat(-122.11595, 47.66712),
        Point.fromLngLat(-122.11063, 47.66735),
        Point.fromLngLat(-122.10668, 47.67035),
        Point.fromLngLat(-122.10565, 47.67498)
    )
));

//Create a line layer and pass in a gradient expression for the strokeGradient property.
map.layers.add(new LineLayer(source,
    strokeWidth(6f),

    //Pass an interpolate or step expression that represents a gradient.
    strokeGradient(
        interpolate(
            linear(),
            lineProgress(),
            stop(0, color(Color.BLUE)),
            stop(0.1, color(Color.argb(255, 65, 105, 225))), //Royal Blue
            stop(0.3, color(Color.CYAN)),
            stop(0.5, color(Color.argb(255,0, 255, 0))), //Lime
            stop(0.7, color(Color.YELLOW)),
            stop(1, color(Color.RED))
        )
    )
));
//Create a data source and add it to the map.
val source = DataSource(
    //Enable line metrics on the data source. This is needed to enable support for strokeGradient.
    withLineMetrics(true)
)
map.sources.add(source)

//Create a line and add it to the data source.
source.add(
    LineString.fromLngLats(
        Arrays.asList(
            Point.fromLngLat(-122.18822, 47.63208),
            Point.fromLngLat(-122.18204, 47.63196),
            Point.fromLngLat(-122.17243, 47.62976),
            Point.fromLngLat(-122.16419, 47.63023),
            Point.fromLngLat(-122.15852, 47.62942),
            Point.fromLngLat(-122.15183, 47.62988),
            Point.fromLngLat(-122.14256, 47.63451),
            Point.fromLngLat(-122.13483, 47.64041),
            Point.fromLngLat(-122.13466, 47.64422),
            Point.fromLngLat(-122.13844, 47.65440),
            Point.fromLngLat(-122.13277, 47.66515),
            Point.fromLngLat(-122.12779, 47.66712),
            Point.fromLngLat(-122.11595, 47.66712),
            Point.fromLngLat(-122.11063, 47.66735),
            Point.fromLngLat(-122.10668, 47.67035),
            Point.fromLngLat(-122.10565, 47.67498)
        )
    )
)

//Create a line layer and pass in a gradient expression for the strokeGradient property.
map.layers.add(
    LineLayer(
        source,
        strokeWidth(6f),

        //Pass an interpolate or step expression that represents a gradient.
        strokeGradient(
            interpolate(
                linear(),
                lineProgress(),
                stop(0, color(Color.BLUE)),
                stop(0.1, color(Color.argb(255, 65, 105, 225))),  //Royal Blue
                stop(0.3, color(Color.CYAN)),
                stop(0.5, color(Color.argb(255, 0, 255, 0))),  //Lime
                stop(0.7, color(Color.YELLOW)),
                stop(1, color(Color.RED))
            )
        )
    )
)
以下屏幕截图显示了上述代码,该代码显示使用渐变笔划颜色呈现的行。
沿线条添加符号
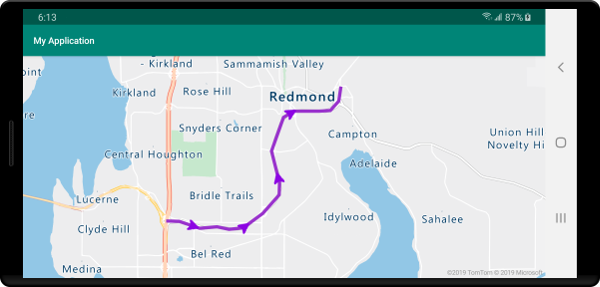
此示例演示如何沿地图上的线条添加箭头图标。 使用符号层时,将 symbolPlacement 选项设置为 SymbolPlacement.LINE。 这将沿线条呈现符号并旋转图标(0 度 = 右)。
//Create a data source and add it to the map.
DataSource source = new DataSource();
map.sources.add(source);

//Load a image of an arrow into the map image sprite and call it "arrow-icon".
map.images.add("arrow-icon", R.drawable.purple_arrow_right);

//Create and add a line to the data source.
source.add(LineString.fromLngLats(Arrays.asList(
    Point.fromLngLat(-122.18822, 47.63208),
    Point.fromLngLat(-122.18204, 47.63196),
    Point.fromLngLat(-122.17243, 47.62976),
    Point.fromLngLat(-122.16419, 47.63023),
    Point.fromLngLat(-122.15852, 47.62942),
    Point.fromLngLat(-122.15183, 47.62988),
    Point.fromLngLat(-122.14256, 47.63451),
    Point.fromLngLat(-122.13483, 47.64041),
    Point.fromLngLat(-122.13466, 47.64422),
    Point.fromLngLat(-122.13844, 47.65440),
    Point.fromLngLat(-122.13277, 47.66515),
    Point.fromLngLat(-122.12779, 47.66712),
    Point.fromLngLat(-122.11595, 47.66712),
    Point.fromLngLat(-122.11063, 47.66735),
    Point.fromLngLat(-122.10668, 47.67035),
    Point.fromLngLat(-122.10565, 47.67498)))
);

//Create a line layer and add it to the map.
map.layers.add(new LineLayer(source,
    strokeColor("DarkOrchid"),
    strokeWidth(5f)
));

//Create a symbol layer and add it to the map.
map.layers.add(new SymbolLayer(source,
    //Space symbols out along line.
    symbolPlacement(SymbolPlacement.LINE),

    //Spread the symbols out 100 pixels apart.
    symbolSpacing(100f),

    //Use the arrow icon as the symbol.
    iconImage("arrow-icon"),

    //Allow icons to overlap so that they aren't hidden if they collide with other map elements.
    iconAllowOverlap(true),

    //Center the symbol icon.
    iconAnchor(AnchorType.CENTER),

    //Scale the icon size.
    iconSize(0.8f)
));
//Create a data source and add it to the map.
val source = DataSource()
map.sources.add(source)

//Load a image of an arrow into the map image sprite and call it "arrow-icon".
map.images.add("arrow-icon", R.drawable.purple_arrow_right)

//Create and add a line to the data source.
//Create and add a line to the data source.
source.add(
    LineString.fromLngLats(
        Arrays.asList(
            Point.fromLngLat(-122.18822, 47.63208),
            Point.fromLngLat(-122.18204, 47.63196),
            Point.fromLngLat(-122.17243, 47.62976),
            Point.fromLngLat(-122.16419, 47.63023),
            Point.fromLngLat(-122.15852, 47.62942),
            Point.fromLngLat(-122.15183, 47.62988),
            Point.fromLngLat(-122.14256, 47.63451),
            Point.fromLngLat(-122.13483, 47.64041),
            Point.fromLngLat(-122.13466, 47.64422),
            Point.fromLngLat(-122.13844, 47.65440),
            Point.fromLngLat(-122.13277, 47.66515),
            Point.fromLngLat(-122.12779, 47.66712),
            Point.fromLngLat(-122.11595, 47.66712),
            Point.fromLngLat(-122.11063, 47.66735),
            Point.fromLngLat(-122.10668, 47.67035),
            Point.fromLngLat(-122.10565, 47.67498)
        )
    )
)

//Create a line layer and add it to the map.
map.layers.add(
    LineLayer(
        source,
        strokeColor("DarkOrchid"),
        strokeWidth(5f)
    )
)

//Create a symbol layer and add it to the map.
map.layers.add(
    SymbolLayer(
        source,  //Space symbols out along line.
        symbolPlacement(SymbolPlacement.LINE),  //Spread the symbols out 100 pixels apart.
        symbolSpacing(100f),  //Use the arrow icon as the symbol.
        iconImage("arrow-icon"),  //Allow icons to overlap so that they aren't hidden if they collide with other map elements.
        iconAllowOverlap(true),  //Center the symbol icon.
        iconAnchor(AnchorType.CENTER),  //Scale the icon size.
        iconSize(0.8f)
    )
)
对于本示例,以下图像已加载到应用的可绘制资源文件夹中。
purple-arrow-right.png |
以下屏幕截图显示了上述代码,该代码显示一条线,沿其显示箭头图标。
后续步骤
有关可向地图添加的更多代码示例,请参阅以下文章: