你当前正在访问 Microsoft Azure Global Edition 技术文档网站。 如果需要访问由世纪互联运营的 Microsoft Azure 中国技术文档网站,请访问 https://docs.azure.cn。
快速入门:通过日志、指标和跟踪来监视 Azure Spring Apps 应用
注意
Azure Spring Apps 是 Azure Spring Cloud 服务的新名称。 虽然该服务有新名称,但一些地方仍会使用旧名称,我们仍在更新屏幕截图、视频和图形等资产。
本文适用于:✔️ 基本/标准层 ❌ Enterprise 层
使用 Azure Spring Apps 中的内置监视功能,可以调试和监视复杂问题。 Azure Spring Apps 将 Steeltoe 分布式跟踪 与 Azure 的 Application Insights 集成。 这种集成可以通过 Azure 门户提供强大的日志、指标和分布式跟踪功能。
以下过程说明如何通过你在前面快速入门中部署的示例应用使用日志流式处理、Log Analytics、指标和分布式跟踪。
先决条件
完成此系列中前面的快速入门:
日志
可通过两种方式在 Azure Spring Apps 上查看日志:每个应用实例的实时日志的日志流式处理或具有高级查询功能的聚合日志的 Log Analytics。
日志流式处理
可以通过以下命令在 Azure CLI 中使用日志流式处理。
az spring app logs --name solar-system-weather --follow
你会看到类似于以下示例的输出:
=> ConnectionId:0HM2HOMHT82UK => RequestPath:/weatherforecast RequestId:0HM2HOMHT82UK:00000003, SpanId:|e8c1682e-46518cc0202c5fd9., TraceId:e8c1682e-46518cc0202c5fd9, ParentId: => Microsoft.Azure.SpringCloud.Sample.SolarSystemWeather.Controllers.WeatherForecastController.Get (Microsoft.Azure.SpringCloud.Sample.SolarSystemWeather)
Executing action method Microsoft.Azure.SpringCloud.Sample.SolarSystemWeather.Controllers.WeatherForecastController.Get (Microsoft.Azure.SpringCloud.Sample.SolarSystemWeather) - Validation state: Valid
←[40m←[32minfo←[39m←[22m←[49m: Microsoft.Azure.SpringCloud.Sample.SolarSystemWeather.Controllers.WeatherForecastController[0]

=> ConnectionId:0HM2HOMHT82UK => RequestPath:/weatherforecast RequestId:0HM2HOMHT82UK:00000003, SpanId:|e8c1682e-46518cc0202c5fd9., TraceId:e8c1682e-46518cc0202c5fd9, ParentId: => Microsoft.Azure.SpringCloud.Sample.SolarSystemWeather.Controllers.WeatherForecastController.Get (Microsoft.Azure.SpringCloud.Sample.SolarSystemWeather)
Retrieved weather data from 4 planets
←[40m←[32minfo←[39m←[22m←[49m: Microsoft.AspNetCore.Mvc.Infrastructure.ControllerActionInvoker[2]

=> ConnectionId:0HM2HOMHT82UK => RequestPath:/weatherforecast RequestId:0HM2HOMHT82UK:00000003, SpanId:|e8c1682e-46518cc0202c5fd9., TraceId:e8c1682e-46518cc0202c5fd9, ParentId: => Microsoft.Azure.SpringCloud.Sample.SolarSystemWeather.Controllers.WeatherForecastController.Get (Microsoft.Azure.SpringCloud.Sample.SolarSystemWeather)
Executing ObjectResult, writing value of type 'System.Collections.Generic.KeyValuePair`2[[System.String, System.Private.CoreLib, Version=4.0.0.0, Culture=neutral, PublicKeyToken=7cec85d7bea7798e],[System.String, System.Private.CoreLib, Version=4.0.0.0, Culture=neutral, PublicKeyToken=7cec85d7bea7798e]][]'.
←[40m←[32minfo←[39m←[22m←[49m: Microsoft.AspNetCore.Mvc.Infrastructure.ControllerActionInvoker[2]
提示
使用 az spring app logs -h 浏览更多参数和日志流功能。
Log Analytics
在 Azure 门户中转到“服务 | 概览”页,然后在“监视”部分选择“日志” 。 选择 Azure Spring Apps 的一个示例查询上的“运行”。

编辑查询以删除将显示限制为警告和错误日志的 Where 子句。
选择“运行”。 你会看到日志。 有关详细信息,请参阅 Azure Monitor 日志查询入门。

若要详细了解 Log Analytics 中使用的查询语言,请参阅 Azure Monitor 日志查询。 要从一个集中的客户端查询所有 Log Analytics 日志,请查看 Azure 数据资源管理器。


指标
在 Azure 门户中转到“服务 | 概述”页,然后在“监视”部分中选择“指标” 。 添加第一个指标(方法是:在“性能(.NET)”或“请求(.NET)”下的“指标”下拉框中选择 .NET 指标之一,并为“聚合”选择“平均”)以查看该指标的时间线。

选择工具栏中的“添加筛选器”,选择
App=solar-system-weather,以仅查看“solar-system-weather”应用的 CPU 使用情况 。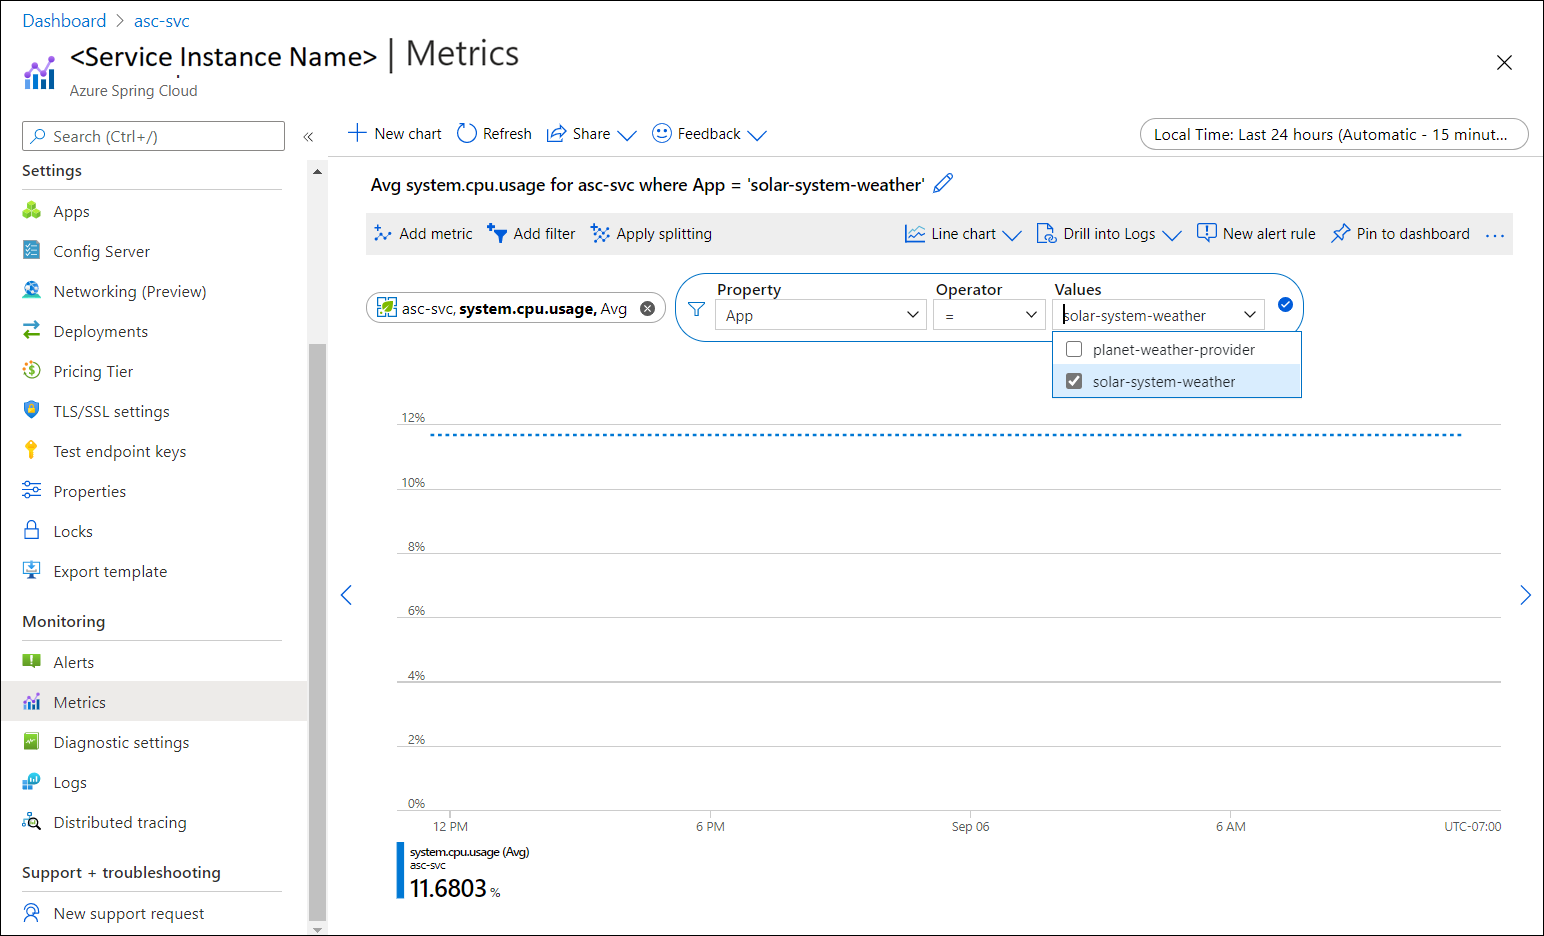
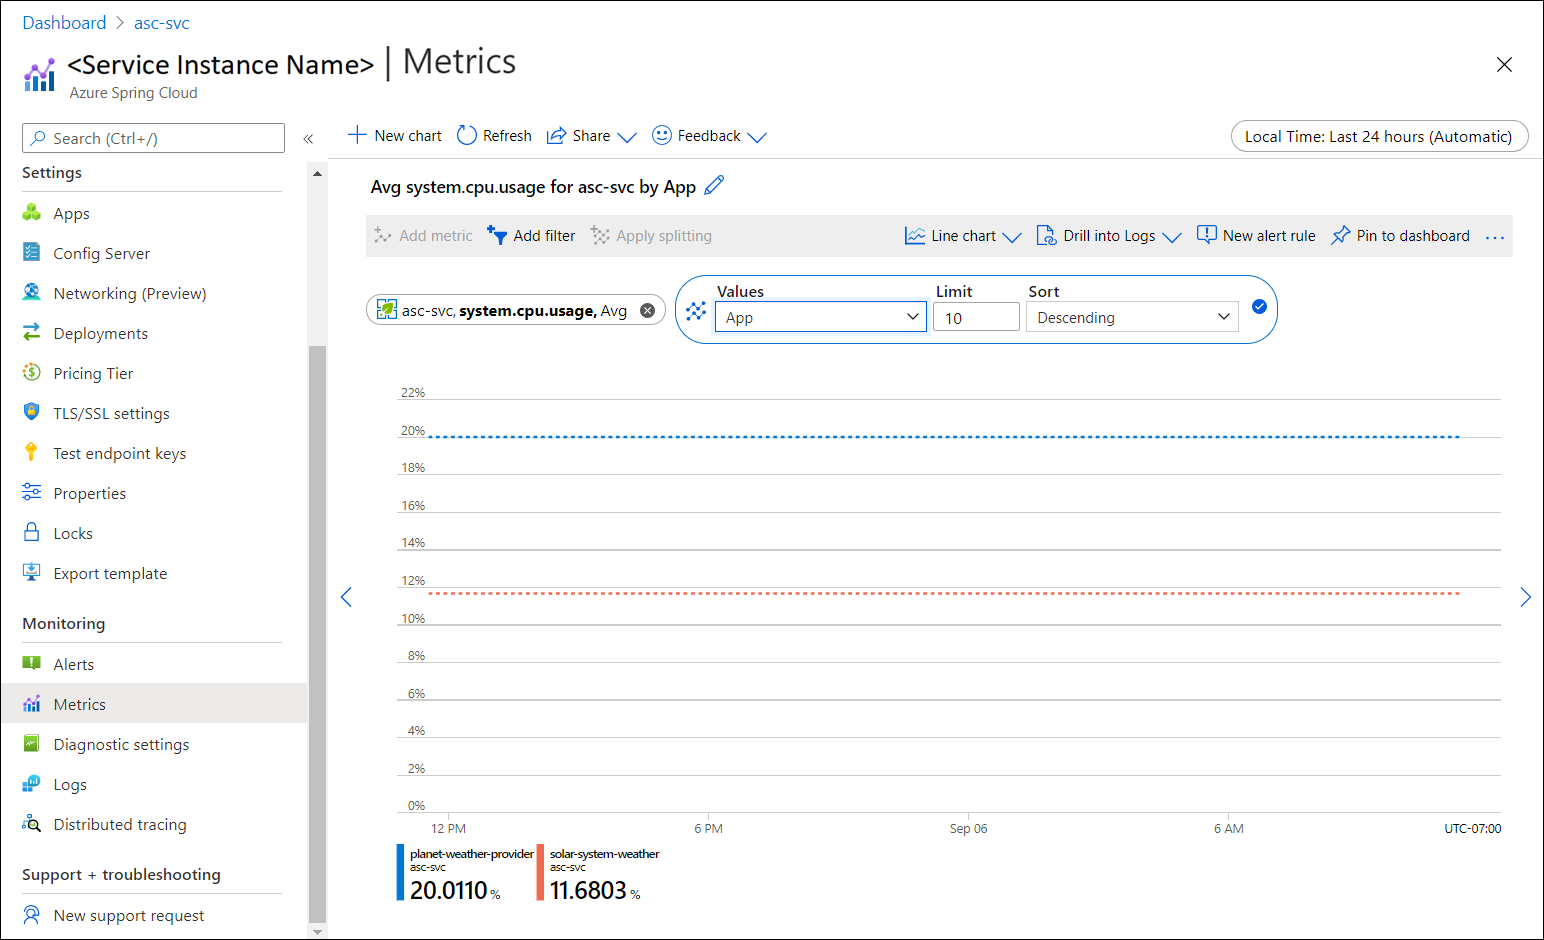
关闭在前一步中创建的筛选器,选择“应用拆分”,然后为“值”选择“应用”以查看不同应用的 CPU 使用情况。


分布式跟踪
在Azure 门户中转到“服务 | 概述”页,然后在“监视”部分中选择“分布式跟踪” 。 然后选择右侧的“查看应用程序映射”选项卡。

现在可以查看应用间的调用状态。

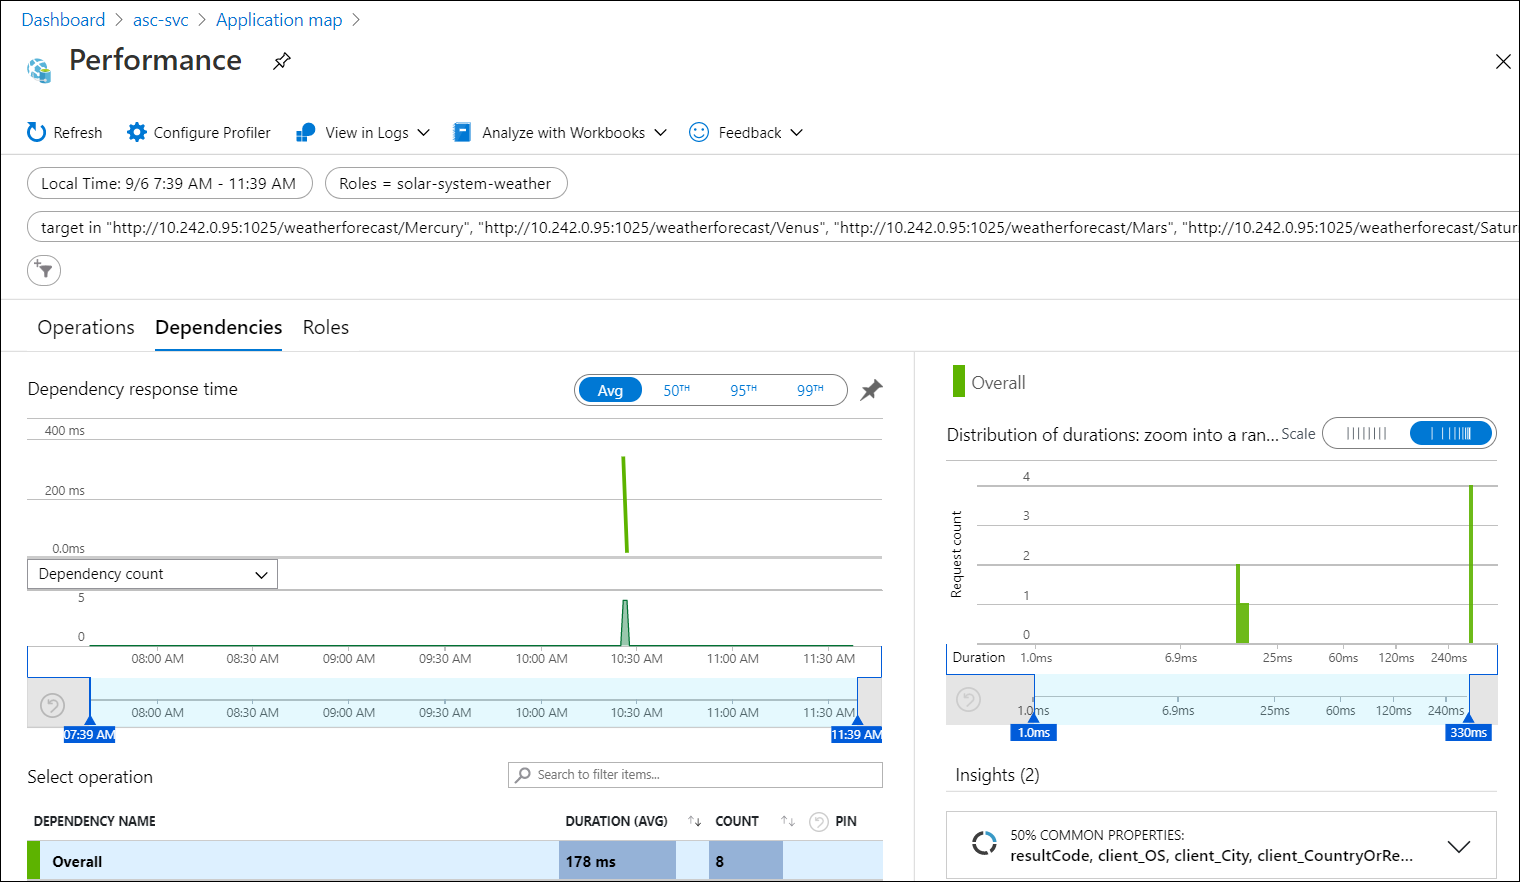
选择“solar-system-weather”和“planet-weather-provider”之间的链接,查看更多详细信息,如最慢的 HTTP 方法调用。

最后,选择“调查性能”以探索更强大的内置性能分析。


使用 Azure Spring Apps 中的内置监视功能,可以调试和监视复杂问题。 Azure Spring Apps 将 Spring Cloud Sleuth 与 Azure 的 Application Insights 集成。 这种集成可以通过 Azure 门户提供强大的日志、指标和分布式跟踪功能。 以下过程说明如何通过已部署的 PetClinic 应用使用日志流式处理、Log Analytics、指标和分布式跟踪。
先决条件
完成此系列中前面的快速入门:
日志
可通过两种方式在 Azure Spring Apps 上查看日志:每个应用实例的实时日志的日志流式处理或具有高级查询功能的聚合日志的 Log Analytics。
日志流式处理
可以通过以下命令在 Azure CLI 中使用日志流式处理。
az spring app logs \
    --resource-group <resource-group-name> \
    --service <service-instance-name> \
    --name api-gateway \
    --follow
你会看到如下所示的日志:

提示
使用 az spring app logs -h 浏览更多参数和日志流功能。
若要详细了解 Log Analytics 中使用的查询语言,请参阅 Azure Monitor 日志查询。 要从一个集中的客户端查询所有 Log Analytics 日志,请查看 Azure 数据资源管理器。


Log Analytics
转到“服务 | 概述”页,然后在“监视”部分中选择“日志” 。 选择 Azure Spring Apps 的一个示例查询上的“运行”。
然后,你会看到筛选出的日志。 有关详细信息,请参阅 Azure Monitor 日志查询入门。


指标
导航到“Application insights”页,然后导航到“指标”页。 可以看到由 Spring Boot 应用、Spring 模块和依赖项提供的指标。
下图显示 gateway_requests(Spring Cloud 网关)、hikaricp_connections(JDBC 连接)和 http_client_requests。

Spring Boot 注册多个核心指标,包括 JVM、CPU、Tomcat 和 Logback。 Spring Boot 自动配置可用于检测由 Spring MVC 处理的请求。 所有三个 REST 控制器(OwnerResource、PetResource 和 VisitResource)都将由类级别的 @Timed Micrometer 注释进行检测。
customers-service 应用程序启用了下列自定义指标:
- @Timed:
petclinic.owner - @Timed:
petclinic.pet
visits-service 应用程序启用了下列自定义指标:
- @Timed:
petclinic.visit
可以在“指标”页中查看这些自定义指标:

可以使用 Application Insights 中的可用性测试功能并监视应用程序的可用性:

导航到“实时指标”页可查看低延迟(小于 1 秒)的实时指标:

跟踪
打开 Azure Spring Apps 创建的 Application Insights,并开始监视 Spring 应用程序。
导航到“应用程序映射”页:
![]()
导航到“性能”页:

导航到“依赖项”选项卡,从中可以查看依赖项的性能数,尤其是 SQL 调用:

选择 SQL 调用,查看上下文中的端到端事务:

导航到“失败”页的“异常”选项卡,从中可以看到异常的集合:

选择一个异常以查看上下文中的端到端事务和堆栈跟踪:

清理资源
如果打算继续使用后续的快速入门和教程,则可能需要保留这些资源。 如果不再需要资源组,可以将其删除,这将删除资源组中的资源。 若要使用 Azure CLI 删除资源组,请使用以下命令:
echo "Enter the Resource Group name:" &&
read resourceGroupName &&
az group delete --name $resourceGroupName &&
echo "Press [ENTER] to continue ..."
在前面的快速入门中,你还设置了默认资源组名称。 如果不打算继续学习下一个快速入门,请通过运行以下 CLI 命令清除该默认名称:
az config set defaults.group=
后续步骤
若要了解 Azure Spring Apps 的更多监视功能,请参阅: