快速入门:创建第一个用于获取和转换数据的数据流
数据流是基于云的自助式数据准备技术。 在本文中,你创建你的第一个数据流,获取数据流的数据,然后转换数据并发布数据流。
先决条件
在开始之前,需要满足以下先决条件:
创建数据流
在本部分,你创建你的第一个数据流。
切换到数据工厂体验。
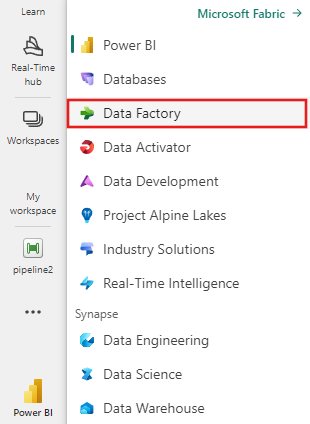
导航到你的 Microsoft Fabric 工作区。

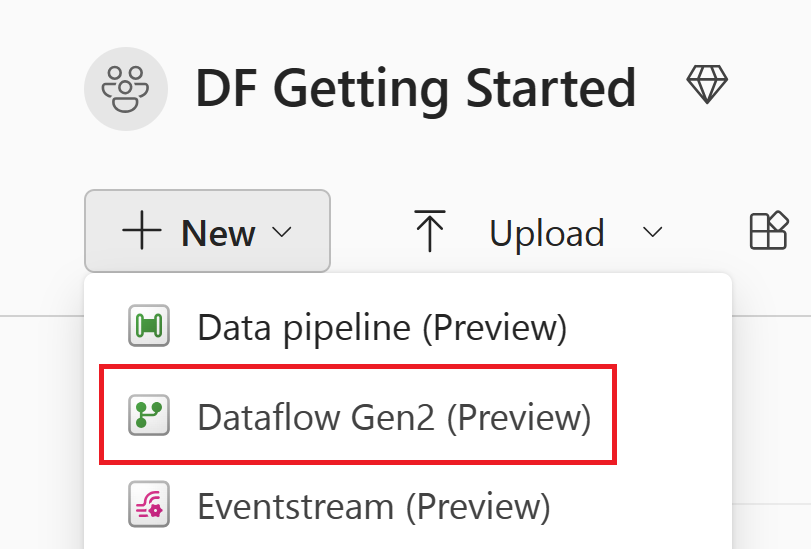
选择“新建”,然后选择“Dataflow Gen2”。

获取数据
让我们来获取一些数据吧! 在此示例中,你是从 OData 服务获取数据。 使用以下步骤获取数据流中的数据。
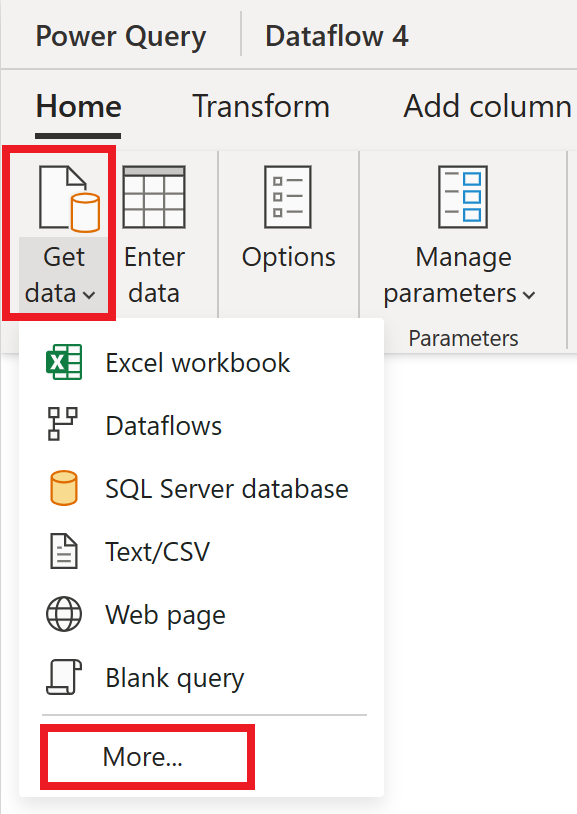
在数据流编辑器中,选择“获取数据”,然后选择“更多”。
在选择数据源中,选择查看更多。

在新建源中,选择“其他>OData”作为数据源。

输入 URL
https://services.odata.org/v4/northwind/northwind.svc/,然后选择“下一步”。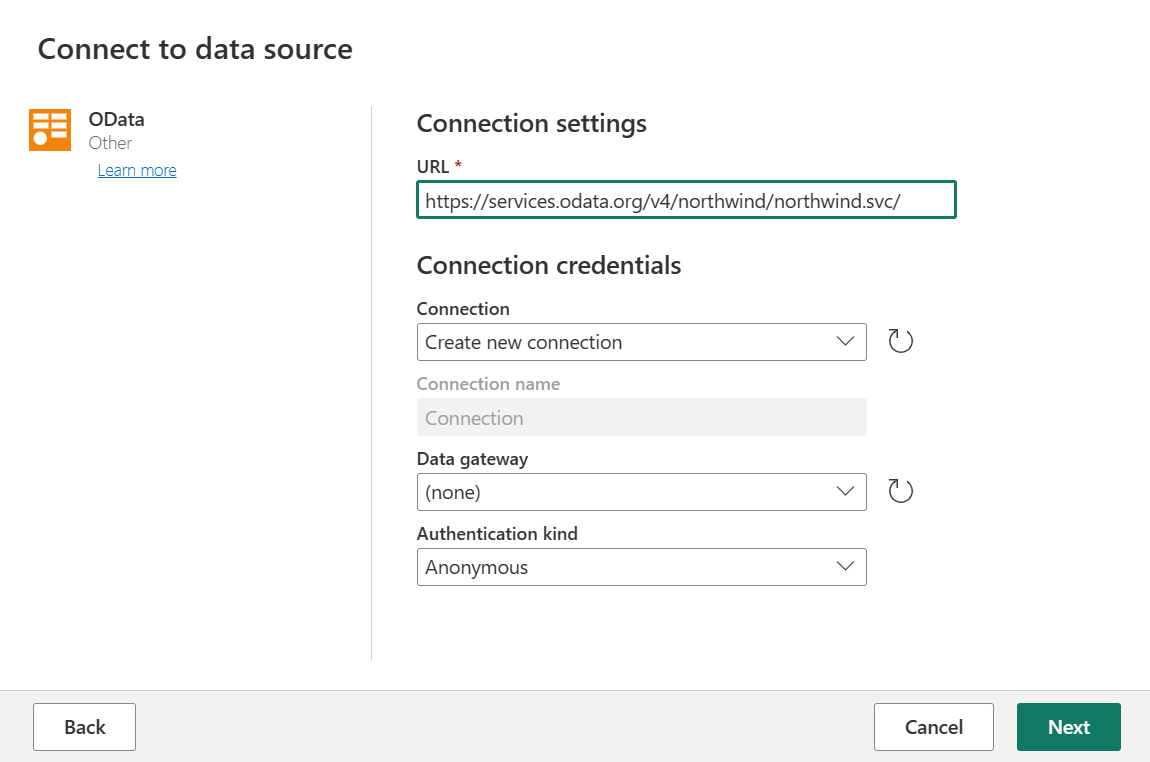
选择 Orders 和 Customers 表,然后选择“创建”。


有关获取数据体验和功能的详细信息,请参阅获取数据概述。
应用转换和发布
现已将你的数据加载到你的第一个数据流中,恭喜! 现在,可以应用几个转换,以便将此数据转化为所需的形式。
你将在 Power Query 编辑器中执行此任务。 可以在 Power Query 用户界面中找到 Power Query 编辑器的详细概述。
请按照以下步骤应用转换并发布:
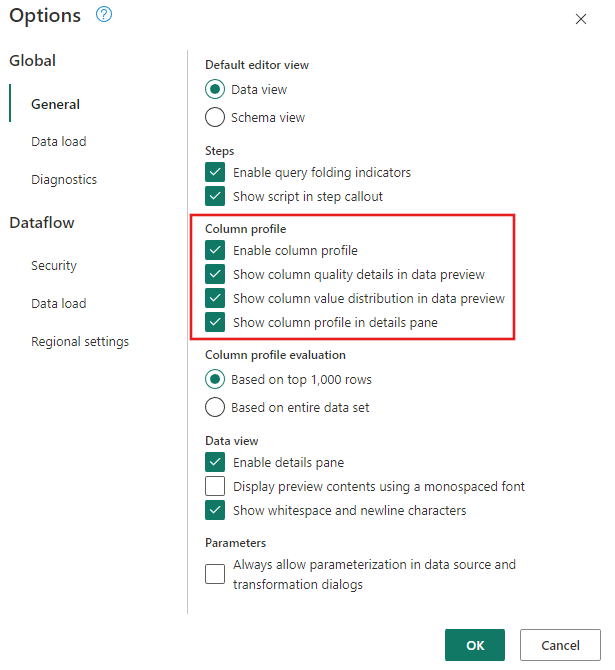
通过导航到“主页”>“选项”>“全局选项”,确保启用了数据分析工具。
另请确保你已使用 Power Query 编辑器功能区中“视图”选项卡下的选项启用关系图视图,或者已通过选择 Power Query 窗口右下角的关系图视图图标来这样做。

在 Orders 表中,你计算每个客户的订单总数。 要实现此目标,请在数据预览中选择 CustomerID 列,然后在功能区中的“转换”选项卡下选择“分组依据”。

你在“分组依据”中执行行计数作为聚合。 有关分组依据功能的详细信息,请参阅分组或汇总行。
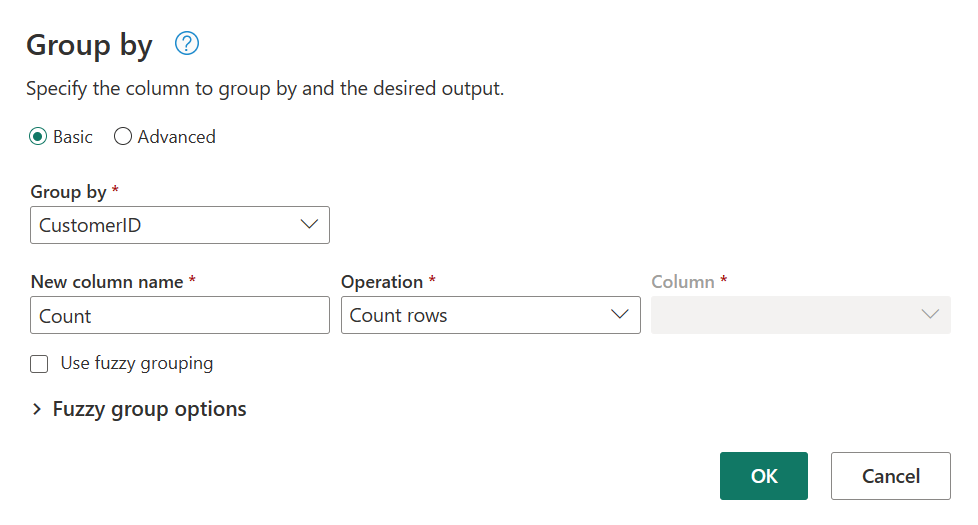
在 Orders 表中对数据进行分组后,我们将获得一个由 CustomerID 和 Count 作为列的双列表。

接下来,你需要将 Customers 表中的数据与每个客户的订单数合并在一起。 要合并数据,请在“关系图”视图中选择“Customers”查询,并使用“⋮”菜单访问“合并为新查询”转换。

通过选择 CustomerID 作为两个表中的匹配列来配置合并操作,如以下屏幕截图所示。 然后选择确定。
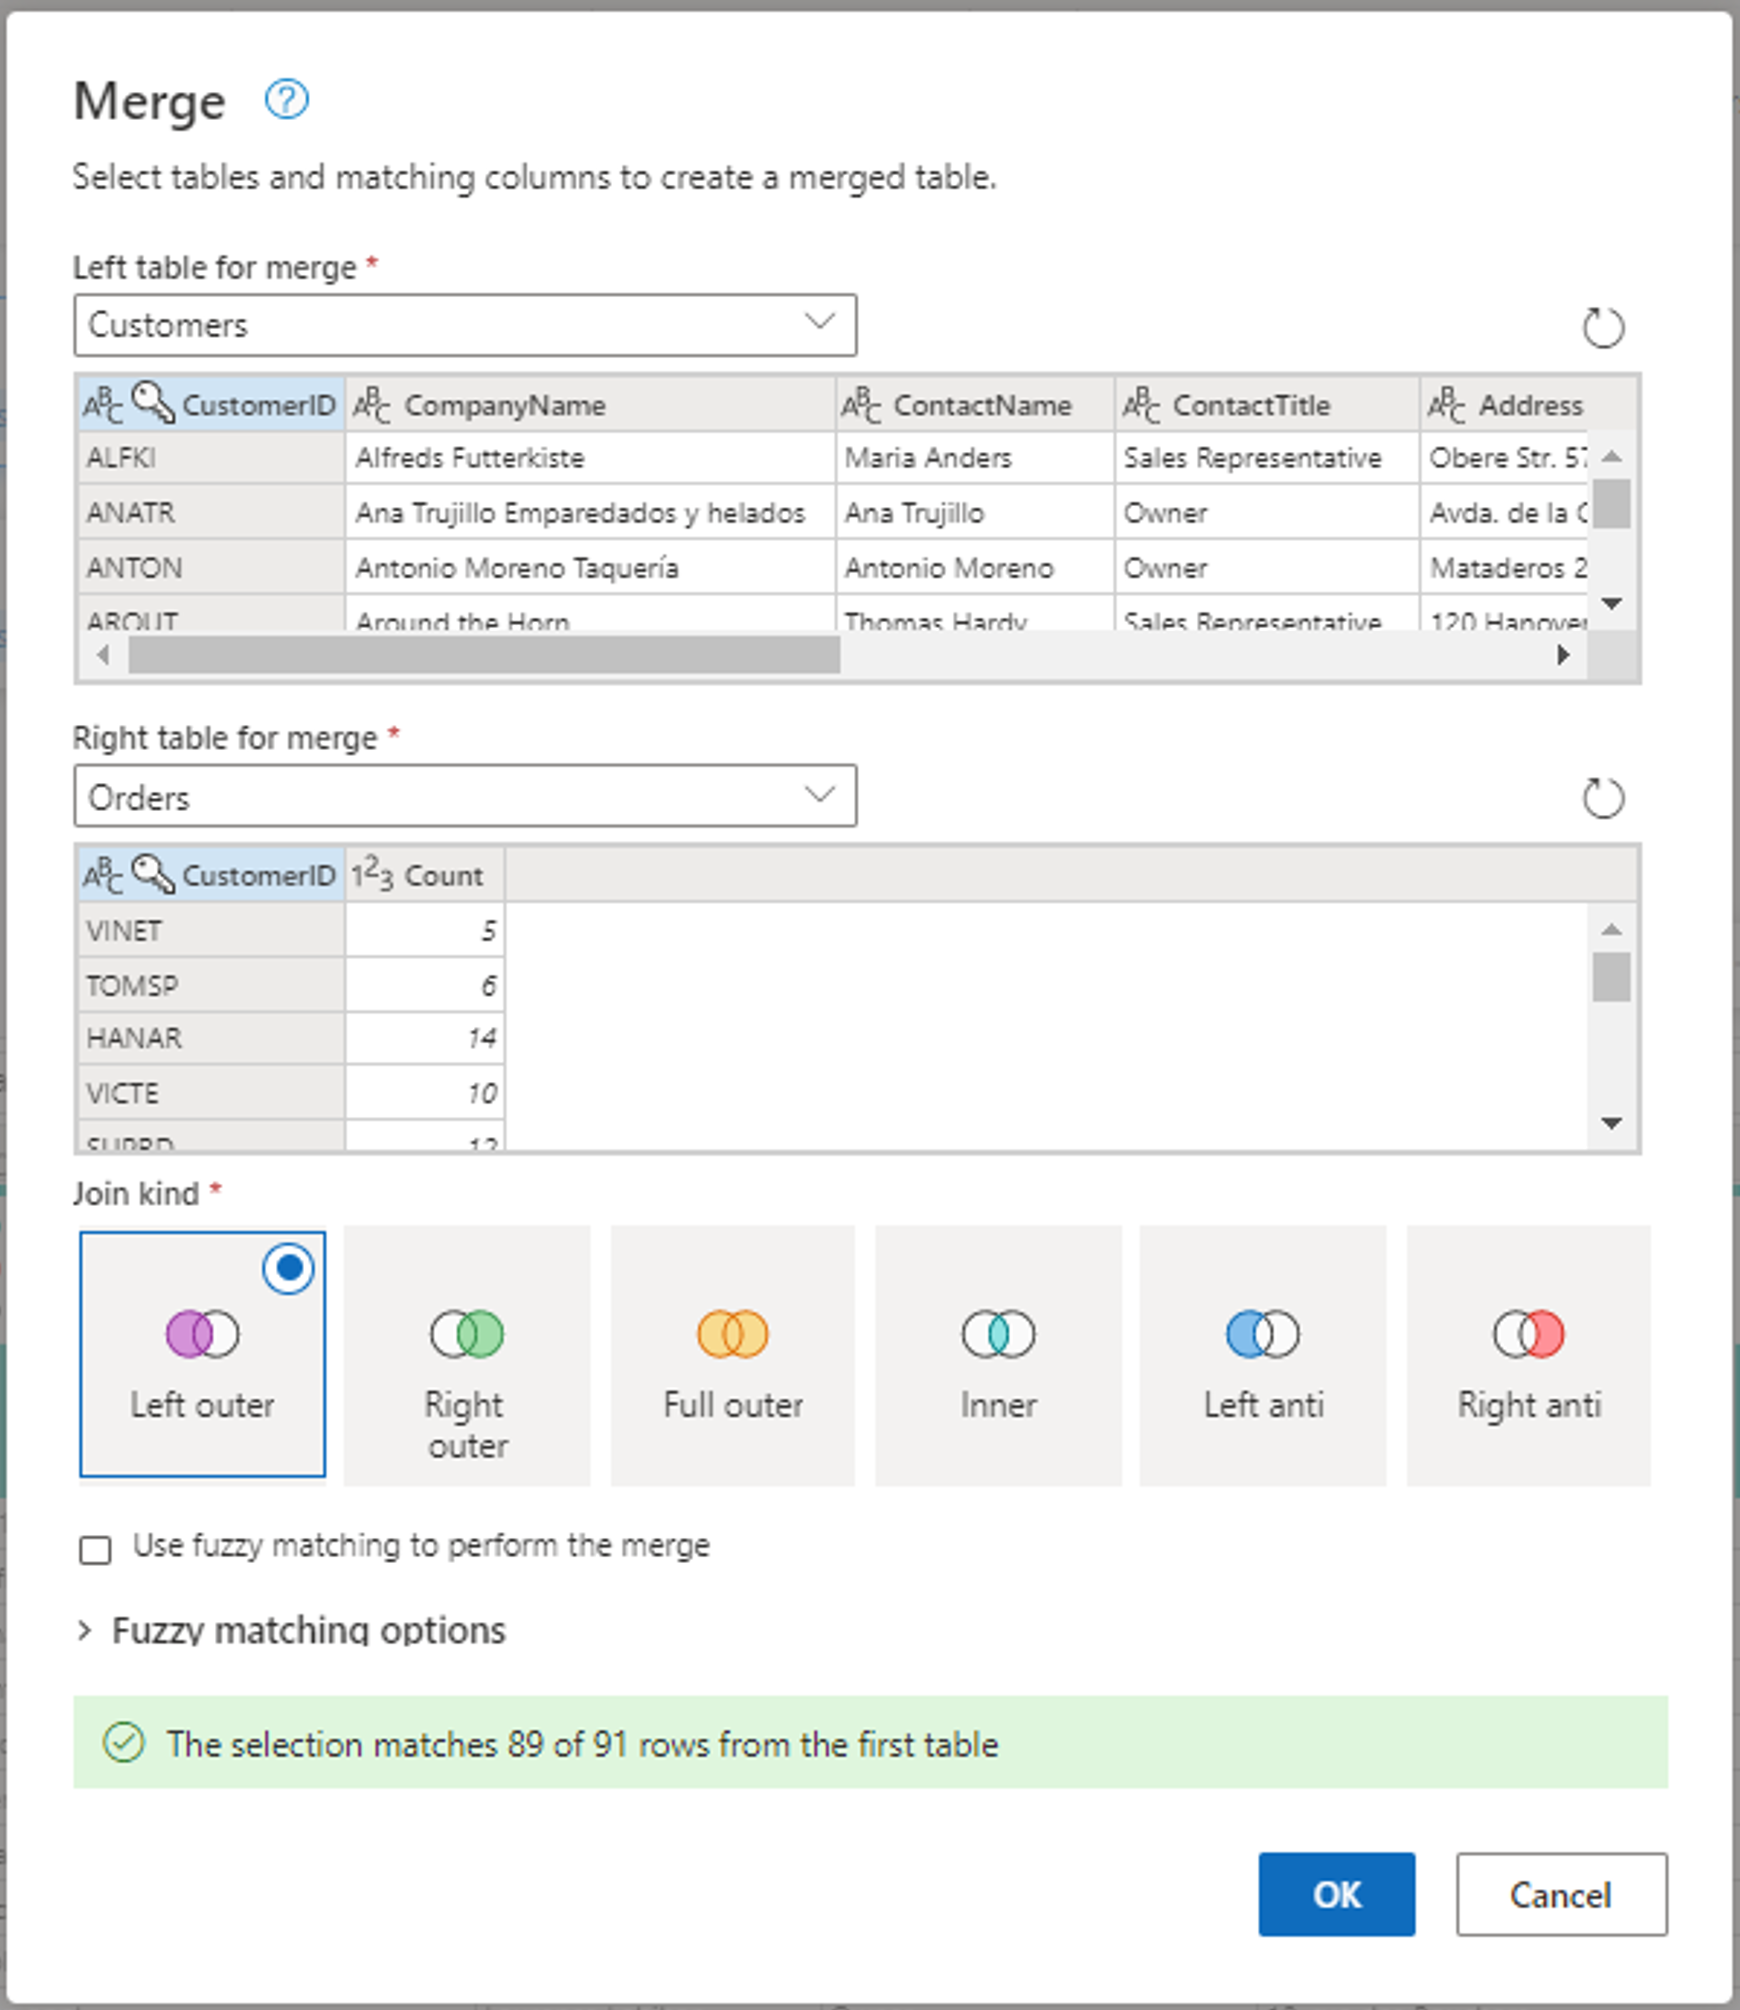
“合并”窗口的屏幕截图,其中要合并的左侧表设置为“Customers”表,要合并的右侧表设置为“Orders”表。 “Customers”和“Orders”表都选择了“CustomerID”列。 此外,联接类型设置为左外。 所有其他选项都设置为默认值。
执行“合并为新查询”操作时,你获得一个新查询,其中包含 Customers 表中的所有列,以及一个包含 Orders 表中嵌套数据的列。

在此示例中,你只对 Customers 表中的列的一个子集感兴趣。 你使用架构视图选择这些列。 在数据流编辑器右下角的切换按钮内启用架构视图。

架构视图提供了表的架构信息的焦点视图,包括列名称和数据类型。 架构视图具有一组可通过上下文功能区选项卡使用的架构工具。在此方案中,你选择 CustomerID、CompanyName 和 Orders (2) 列,接着选择“删除列”按钮,然后在“架构工具”选项卡中选择“删除其他列”。

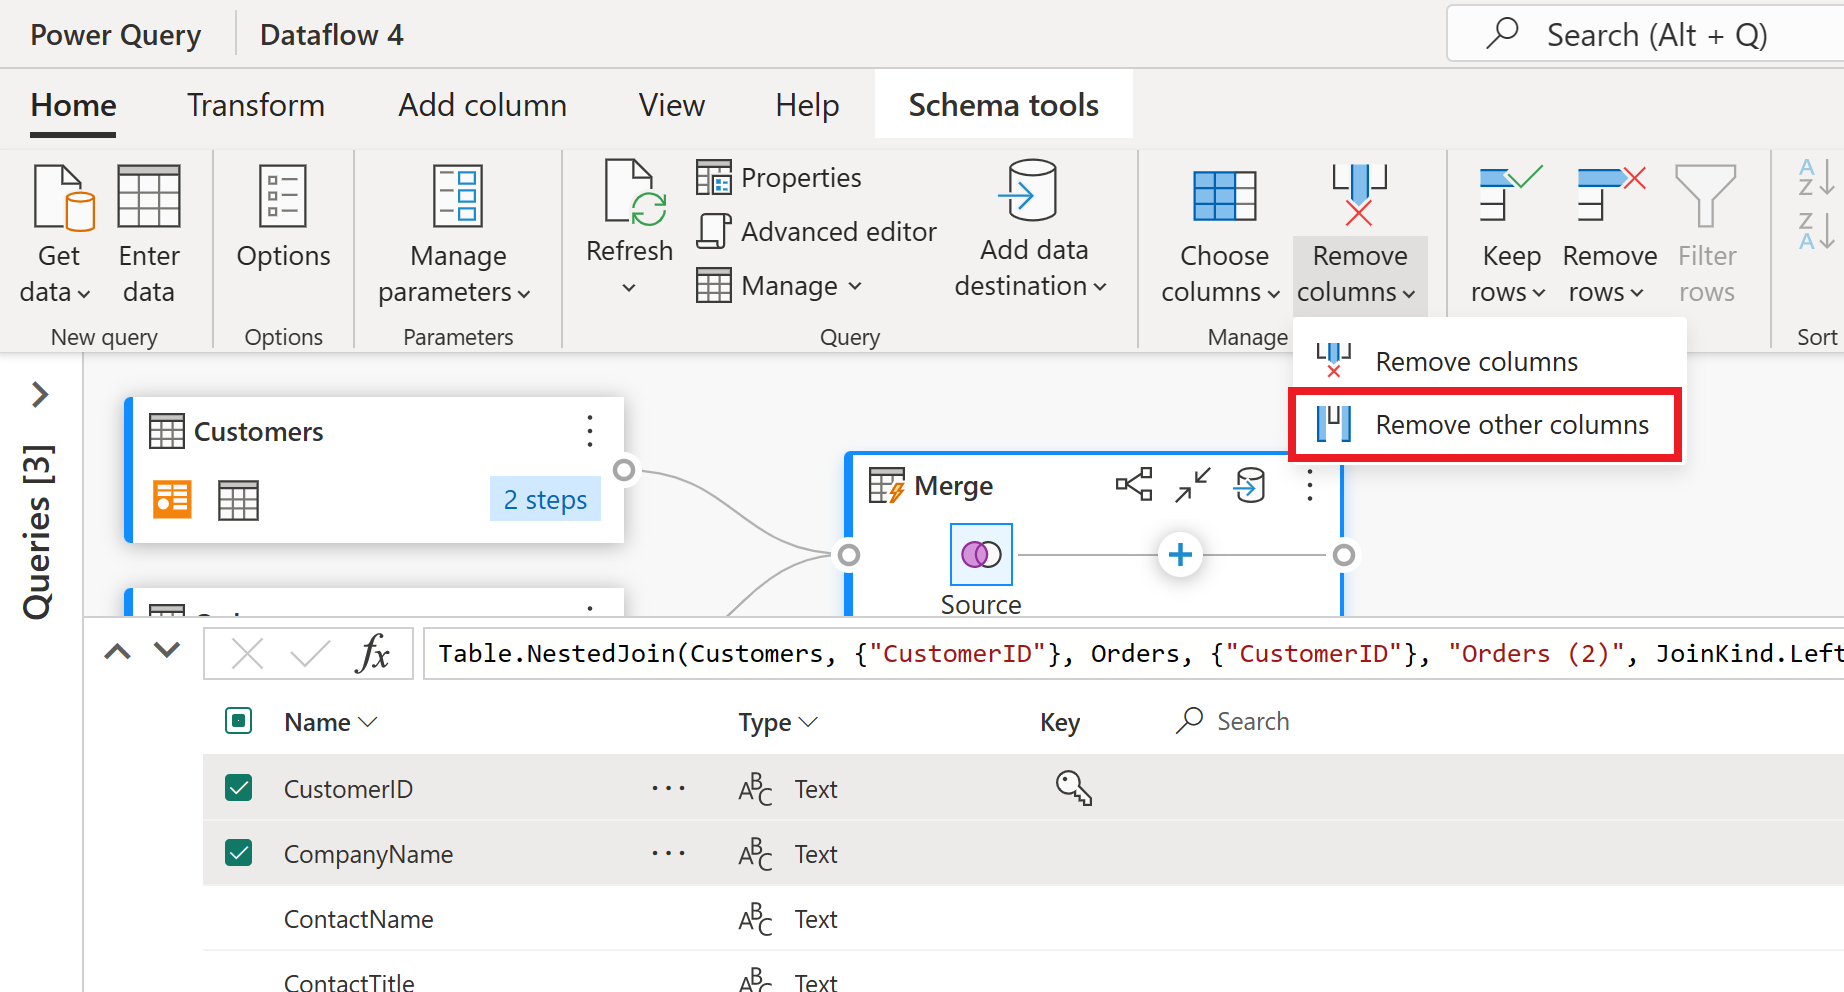
Orders (2) 列包含了你之前执行的合并操作产生的嵌套信息。 现在,通过选择 UI 右下角的“显示架构视图”按钮旁边的“显示数据视图”按钮,切换回数据视图。 然后使用 Orders (2) 列标题中的“展开列”转换来选择 Count 列。

数据流编辑器的屏幕截图,其中右下角有“显示数据视图”按钮,“Orders (2)”列中有“展开列”图标,“展开列”窗口中选择了“Count”列。
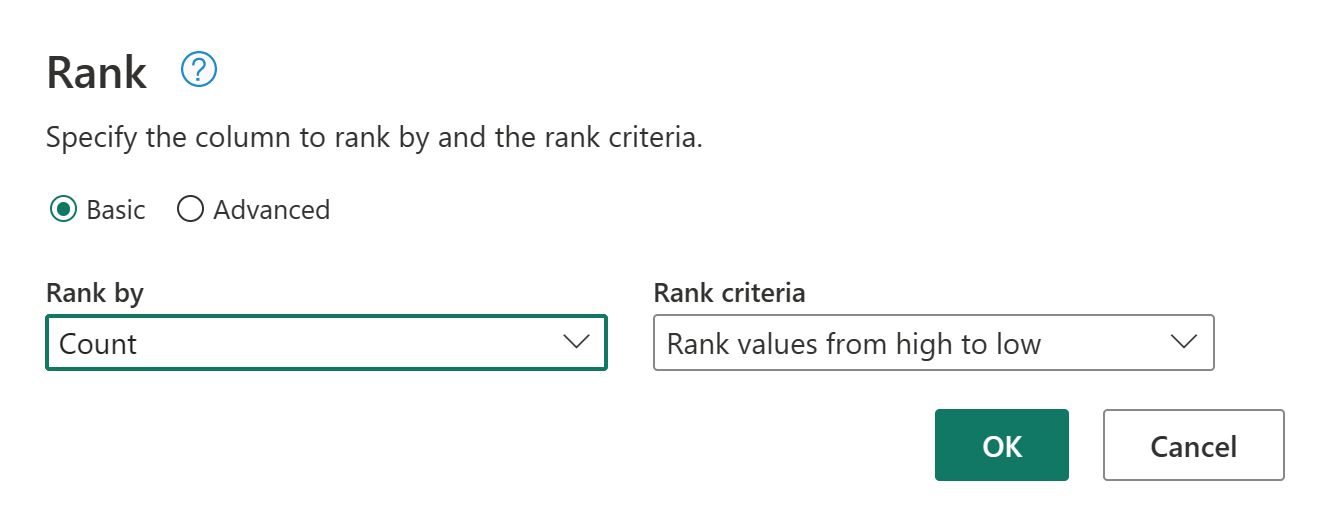
在最终操作中,你需要根据客户的订单数对客户进行排名。 选择“Count”列,然后选择功能区中“添加列”选项卡下的“给列排名”按钮。

保留“为列排名”中的默认设置。 然后选择“确定”以应用此转换。
现在,使用屏幕右侧的“查询设置”窗格将生成的查询重命名为“排名后的客户”。

你已完成数据的转换和组合。 因此,你现在配置其输出目标设置。 选择“查询设置”窗格底部的“选择数据目标”。

在此步骤中,可以配置到湖屋的输出(如果已有),或者可以跳过此步骤(如果没有)。 在此体验中,除了更新方法(追加或替换)外,还可以为查询结果配置湖屋和表。


现在可以发布你的数据流了。 查看关系图视图中的查询,然后选择“发布”。

现在,你返回到工作区。 数据流名称旁边的旋转图标表示发布正在进行。 发布完成后,即可刷新你的数据流!
重要
在工作区中创建第一个 Dataflow Gen2 时,将会预配湖屋和仓库项及其相关的 SQL 分析终结点和语义模型。 这些项由工作区中的所有数据流共享,并且是运行 Dataflow Gen2 所必需的,不应将其删除,但不会由用户直接使用。 这些项是 Dataflow Gen2 的实现详细信息。 这些项在工作区中不可见,但可能可以在其他体验(例如笔记本、SQL 分析终结点、湖屋和仓库体验)中访问。 可以通过名称中的前缀来识别这些项。 这些项的前缀是“DataflowsStaging”。
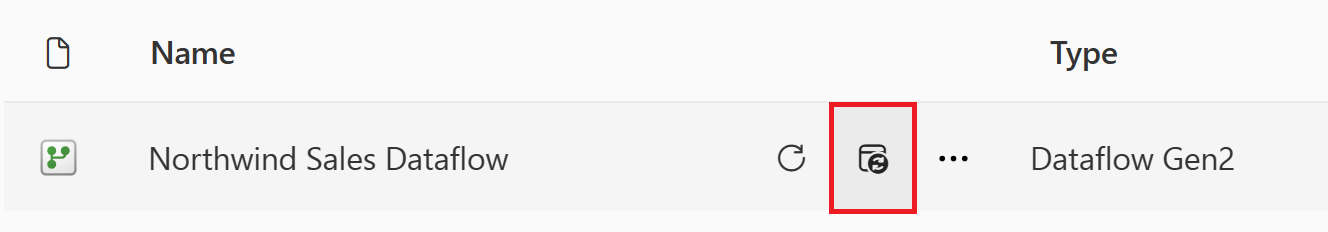
在工作区中,选择“计划刷新”图标。
打开计划刷新,选择“添加其他时间”,然后配置刷新,如以下屏幕截图所示。
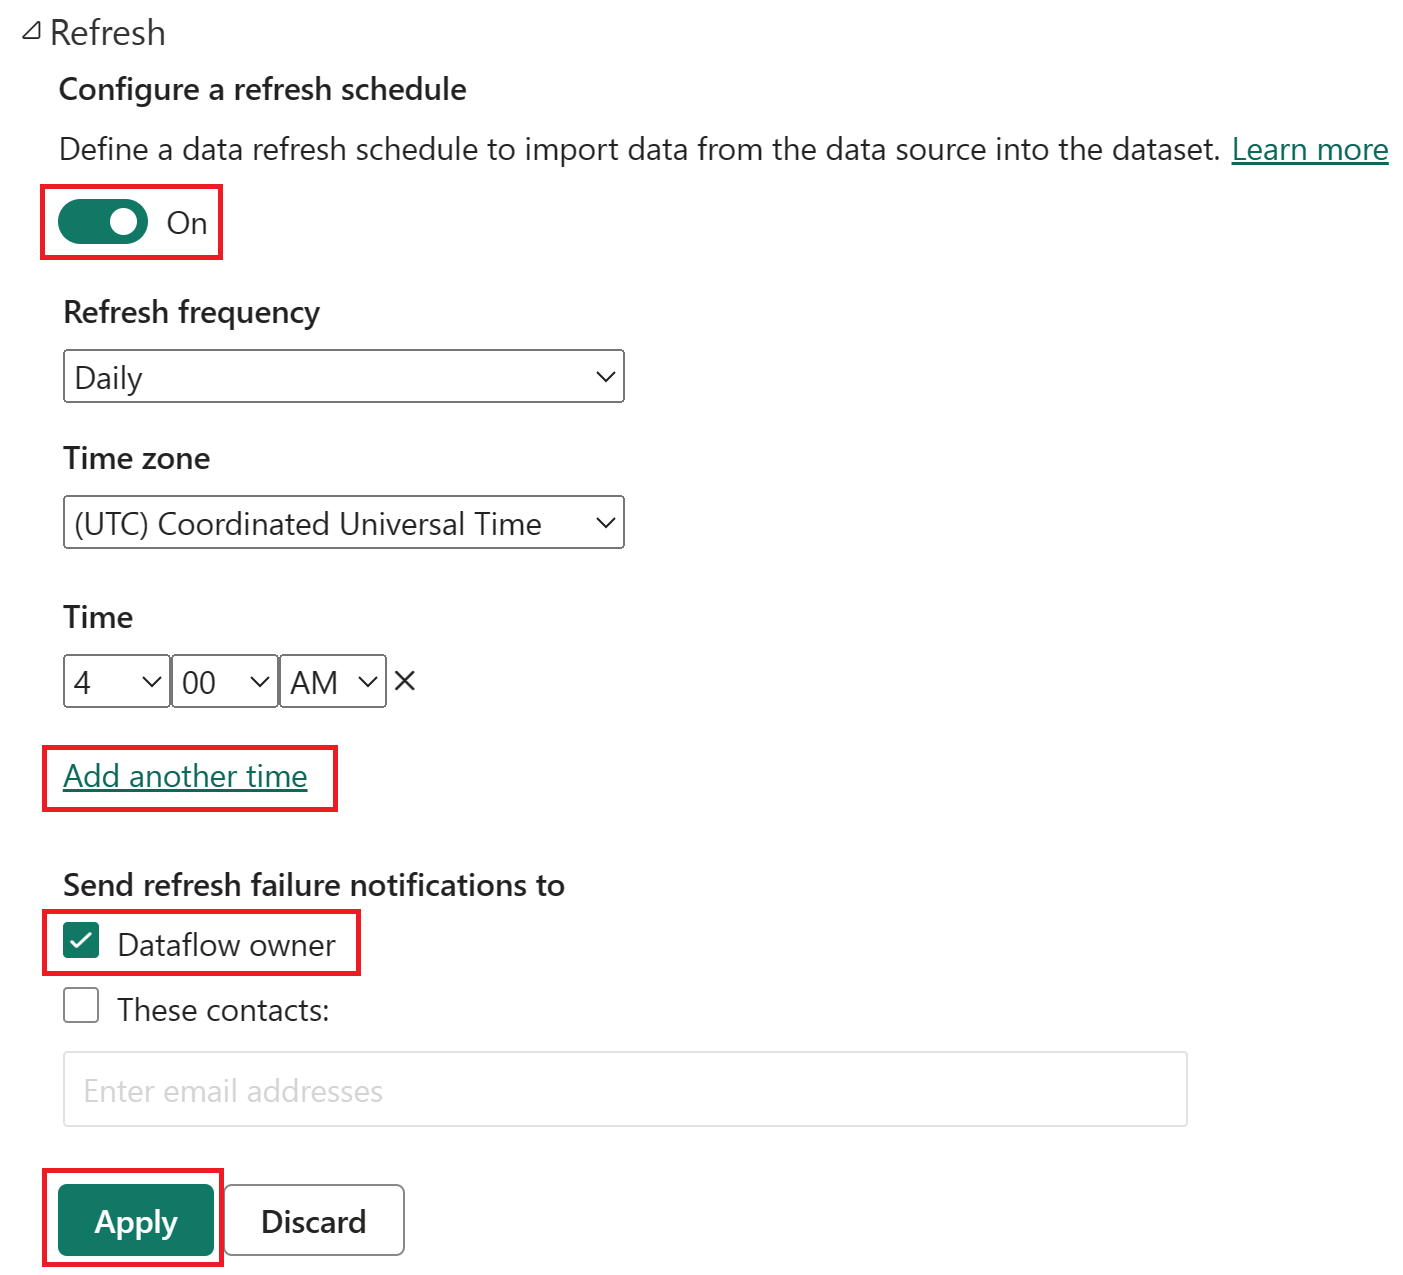
计划刷新选项的屏幕截图,其中打开了计划刷新,刷新频率设置为“每日”,“时区”设置为“协调世界时”,“时间”设置为“凌晨 4:00”。 突出显示了“打开”按钮、“添加另一个时间”选项、数据流所有者和“应用”按钮。


清理资源
如果你不打算继续使用此数据流,可按以下步骤删除它:
导航到你的 Microsoft Fabric 工作区。
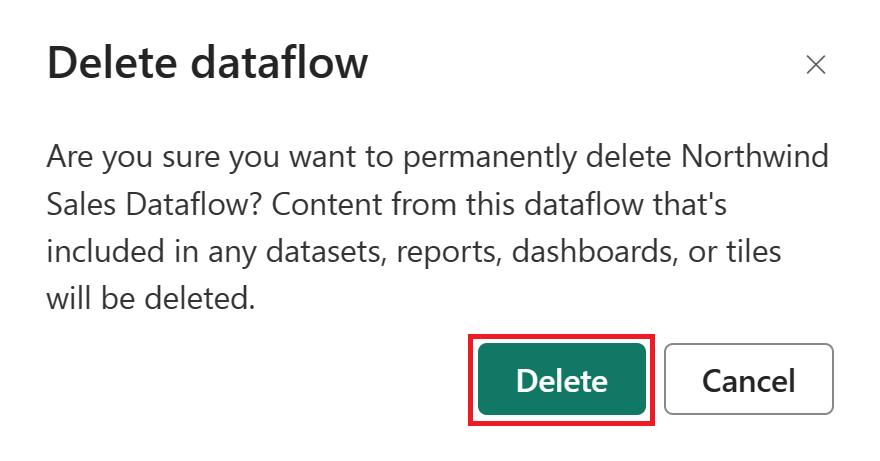
选择数据流名称旁边的垂直省略号,然后选择“删除”。

选择“删除”以确认删除数据流。
相关内容
此示例中的数据流演示如何在 Dataflow Gen2 中加载和转换数据。 你已了解如何执行以下操作:
- 创建 Dataflow Gen2。
- 转换数据。
- 配置已转换的数据的目标设置。
- 运行和计划数据管道。
前往下一篇文章,了解如何创建你的第一个数据管道。
反馈
即将发布:在整个 2024 年,我们将逐步淘汰作为内容反馈机制的“GitHub 问题”,并将其取代为新的反馈系统。 有关详细信息,请参阅:https://aka.ms/ContentUserFeedback。
提交和查看相关反馈