了解 Power BI 视觉对象中的数据视图映射
本文介绍数据视图映射,并说明如何使用数据角色创建不同类型的视觉对象。 本文说明了如何指定数据角色的条件要求以及不同的 dataMappings 类型。
每个有效映射都会生成数据视图。 在某些情况下,可以提供多个数据映射。 支持的映射选项有:
- 条件
- categorical
- single
- table
- 矩阵
"dataViewMappings": [
    {
        "conditions": [ ... ],
        "categorical": { ... },
        "single": { ... },
        "table": { ... },
        "matrix": { ... }
    }
]
仅当在 dataViewMappings 中定义了有效映射时,Power BI 才会创建到数据视图的映射。
换句话说,categorical 可在 dataViewMappings 中定义,但其他映射(例如 table 或 single )可能不行。 在这种情况下,Power BI 会生成具有单个 categorical 映射的数据视图,并且 table 和其他映射仍保持未定义状态。 例如:
"dataViewMappings": [
    {
    "categorical": {
        "categories": [ ... ],
        "values": [ ... ]
    },
    "metadata": { ... }
    }
]
条件
conditions 部分建立特定数据映射的规则。 如果数据与所述的一组条件相匹配,则视觉对象会将数据作为有效数据来接受。
对于每个字段,可以指定最小值和最大值。 该值表示可以绑定到该数据角色的字段数。
注意
如果条件中省略了数据角色,那么可以绑定任意数量的字段。
在以下示例中,将 category 限制为一个数据字段,并将 measure 限制为两个数据字段。
"conditions": [
    { "category": { "max": 1 }, "measure": { "max": 2 } },
]
还可以为数据角色设置多个条件。 在这种情况下,如果满足其中任何一个条件,则数据是有效的。
"conditions": [
    { "category": { "min": 1, "max": 1 }, "measure": { "min": 2, "max": 2 } },
    { "category": { "min": 2, "max": 2 }, "measure": { "min": 1, "max": 1 } }
]
在上面的示例中,需要满足以下两个条件之一:
- 一个类别字段和两个度量值
- 两个类别和一个度量值
单个数据映射
单个数据映射是数据映射的最简单形式。 它接受单个度量值字段并返回总计。 如果该字段为数值,则返回总和。 否则,它返回非重复值的计数。
要使用单个数据映射,则定义要映射的数据角色的名称。 此映射仅适用于单个度量值字段。 如果分配了第二个字段,则不会生成任何数据视图,因此,最好包含将数据限制为单个字段的条件。
注意
此数据映射不能与任何其他数据映射结合使用。 它旨在将数据减少到单个数值。
例如:
{
    "dataRoles": [
        {
            "displayName": "Y",
            "name": "Y",
            "kind": "Measure"
        }
    ],
    "dataViewMappings": [
        {
            "conditions": [
                {
                    "Y": {
                        "max": 1
                    }
                }
            ],
            "single": {
                "role": "Y"
            }
        }
    ]
}
生成的数据视图仍可包含其他映射类型(例如表或类别),但每个映射只包含单个值。 最佳做法是只访问单个映射中的值。
{
    "dataView": [
        {
            "metadata": null,
            "categorical": null,
            "matrix": null,
            "table": null,
            "tree": null,
            "single": {
                "value": 94163140.3560001
            }
        }
    ]
}
下面的代码示例处理简单的数据视图映射:
"use strict";
import powerbi from "powerbi-visuals-api";
import DataView = powerbi.DataView;
import DataViewSingle = powerbi.DataViewSingle;
// standard imports
// ...

export class Visual implements IVisual {
    private target: HTMLElement;
    private host: IVisualHost;
    private valueText: HTMLParagraphElement;

    constructor(options: VisualConstructorOptions) {
        // constructor body
        this.target = options.element;
        this.host = options.host;
        this.valueText = document.createElement("p");
        this.target.appendChild(this.valueText);
        // ...
    }

    public update(options: VisualUpdateOptions) {
        const dataView: DataView = options.dataViews[0];
        const singleDataView: DataViewSingle = dataView.single;

        if (!singleDataView ||
            !singleDataView.value ) {
            return
        }

        this.valueText.innerText = singleDataView.value.toString();
    }
}
上述代码示例的结果是显示 Power BI 中的单个值:

类别数据映射
分类数据映射用于获取独立的数据组别或类别。 还可使用数据映射中的“分组依据”将类别分为一个组。
基本分类数据映射
请考虑以下数据角色和映射:
"dataRoles":[
    {
        "displayName": "Category",
        "name": "category",
        "kind": "Grouping"
    },
    {
        "displayName": "Y Axis",
        "name": "measure",
        "kind": "Measure"
    }
],
"dataViewMappings": {
    "categorical": {
        "categories": {
            "for": { "in": "category" }
        },
        "values": {
            "select": [
                { "bind": { "to": "measure" } }
            ]
        }
    }
}
上述示例的内容是“映射我的 category 数据角色,以便我拖入 category 的每个字段的数据都映射到 categorical.categories。 同时将 measure 数据角色映射到 categorical.values”。
- for...in:包含数据查询中此数据角色中的所有项。
- bind...to:生成与 for...in 相同的结果,但预期数据角色具有将其限制为单个字段的条件。
对分类数据进行分组
下一示例使用与上一示例相同的两个数据角色,并再添加了两个数据角色,即 grouping 和 measure2。
"dataRole":[
    {
        "displayName": "Category",
        "name": "category",
        "kind": "Grouping"
    },
    {
        "displayName": "Y Axis",
        "name": "measure",
        "kind": "Measure"
    },
    {
        "displayName": "Grouping with",
        "name": "grouping",
        "kind": "Grouping"
    },
    {
        "displayName": "X Axis",
        "name": "measure2",
        "kind": "Grouping"
    }
],
"dataViewMappings":{
    "categorical": {
        "categories": {
            "for": { "in": "category" }
        },
        "values": {
            "group": {
                "by": "grouping",
                "select":[
                    { "bind": { "to": "measure" } },
                    { "bind": { "to": "measure2" } }
                ]
            }
        }
    }
}
此映射与基本映射之间的区别在于 categorical.values 的映射方式。 将 measure 和 measure2 数据角色映射到 grouping 数据角色时,可以适当缩放 x 轴和 y 轴。
对分层数据进行分组
在下一示例中,我们将使用分类数据创建层次结构,该层次结构可用于支持向下钻取操作。
下例显示了数据角色和映射:
"dataRoles": [
    {
        "displayName": "Categories",
        "name": "category",
        "kind": "Grouping"
    },
    {
        "displayName": "Measures",
        "name": "measure",
        "kind": "Measure"
    },
    {
        "displayName": "Series",
        "name": "series",
        "kind": "Measure"
    }
],
"dataViewMappings": [
    {
        "categorical": {
            "categories": {
                "for": {
                    "in": "category"
                }
            },
            "values": {
                "group": {
                    "by": "series",
                    "select": [{
                            "for": {
                                "in": "measure"
                            }
                        }
                    ]
                }
            }
        }
    }
]
请考虑以下分类数据:
| 国家/地区 | 2013 | 2014 | 2015 | 2016 |
|---|---|---|---|---|
| USA | x | x | 650 | 350 |
| 加拿大 | x | 630 | 490 | x |
| 墨西哥 | 645 | x | x | x |
| 英国 | x | x | 831 | x |
Power BI 会生成具有以下一组类别的分类数据视图。
{
    "categorical": {
        "categories": [
            {
                "source": {...},
                "values": [
                    "Canada",
                    "USA",
                    "UK",
                    "Mexico"
                ],
                "identity": [...],
                "identityFields": [...],
            }
        ]
    }
}
每个 category 都会映射到一组 values。 其中每个 values 都按 series(以年份形式表示)进行分组。
例如,每个 values 数组表示一年。
此外,每个 values 数组都有四个值:Canada、USA、UK 和 Mexico。
{
    "values": [
        // Values for year 2013
        {
            "source": {...},
            "values": [
                null, // Value for `Canada` category
                null, // Value for `USA` category
                null, // Value for `UK` category
                645 // Value for `Mexico` category
            ],
            "identity": [...],
        },
        // Values for year 2014
        {
            "source": {...},
            "values": [
                630, // Value for `Canada` category
                null, // Value for `USA` category
                null, // Value for `UK` category
                null // Value for `Mexico` category
            ],
            "identity": [...],
        },
        // Values for year 2015
        {
            "source": {...},
            "values": [
                490, // Value for `Canada` category
                650, // Value for `USA` category
                831, // Value for `UK` category
                null // Value for `Mexico` category
            ],
            "identity": [...],
        },
        // Values for year 2016
        {
            "source": {...},
            "values": [
                null, // Value for `Canada` category
                350, // Value for `USA` category
                null, // Value for `UK` category
                null // Value for `Mexico` category
            ],
            "identity": [...],
        }
    ]
}
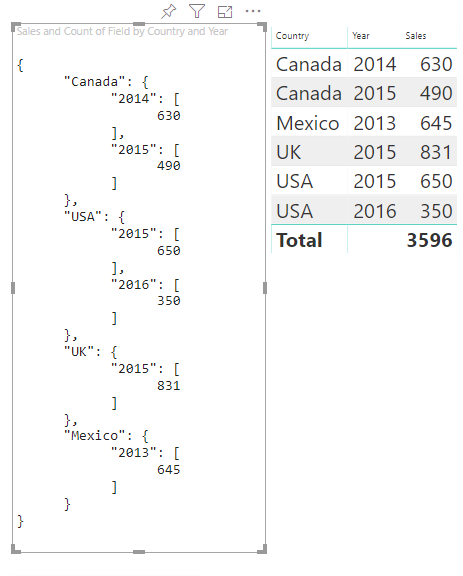
下面是用于处理分类数据视图映射的代码示例。 此示例创建分层结构:Country/Region > Year > Value。
"use strict";
import powerbi from "powerbi-visuals-api";
import DataView = powerbi.DataView;
import DataViewCategorical = powerbi.DataViewCategorical;
import DataViewValueColumnGroup = powerbi.DataViewValueColumnGroup;
import PrimitiveValue = powerbi.PrimitiveValue;
// standard imports
// ...

export class Visual implements IVisual {
    private target: HTMLElement;
    private host: IVisualHost;
    private categories: HTMLElement;

    constructor(options: VisualConstructorOptions) {
        // constructor body
        this.target = options.element;
        this.host = options.host;
        this.categories = document.createElement("pre");
        this.target.appendChild(this.categories);
        // ...
    }

    public update(options: VisualUpdateOptions) {
        const dataView: DataView = options.dataViews[0];
        const categoricalDataView: DataViewCategorical = dataView.categorical;

        if (!categoricalDataView ||
            !categoricalDataView.categories ||
            !categoricalDataView.categories[0] ||
            !categoricalDataView.values) {
            return;
        }

        // Categories have only one column in data buckets
        // To support several columns of categories data bucket, iterate categoricalDataView.categories array.
        const categoryFieldIndex = 0;
        // Measure has only one column in data buckets.
        // To support several columns on data bucket, iterate years.values array in map function
        const measureFieldIndex = 0;
        let categories: PrimitiveValue[] = categoricalDataView.categories[categoryFieldIndex].values;
        let values: DataViewValueColumnGroup[] = categoricalDataView.values.grouped();

        let data = {};
        // iterate categories/countries-regions
        categories.map((category: PrimitiveValue, categoryIndex: number) => {
            data[category.toString()] = {};
            // iterate series/years
            values.map((years: DataViewValueColumnGroup) => {
                if (!data[category.toString()][years.name] && years.values[measureFieldIndex].values[categoryIndex]) {
                    data[category.toString()][years.name] = []
                }
                if (years.values[0].values[categoryIndex]) {
                    data[category.toString()][years.name].push(years.values[measureFieldIndex].values[categoryIndex]);
                }
            });
        });

        this.categories.innerText = JSON.stringify(data, null, 6);
        console.log(data);
    }
}
生成的视觉对象如下所示:
映射表
实质上,表数据视图是数据点的列表,可在其中聚合数值数据点。
例如,使用上一部分中的相同数据,但包含以下功能:
"dataRoles": [
    {
        "displayName": "Column",
        "name": "column",
        "kind": "Grouping"
    },
    {
        "displayName": "Value",
        "name": "value",
        "kind": "Measure"
    }
],
"dataViewMappings": [
    {
        "table": {
            "rows": {
                "select": [
                    {
                        "for": {
                            "in": "column"
                        }
                    },
                    {
                        "for": {
                            "in": "value"
                        }
                    }
                ]
            }
        }
    }
]
可视化表数据视图,如下例所示:
| 国家/地区 | Year | Sales |
|---|---|---|
| USA | 2016 | 100 |
| USA | 2015 | 50 |
| 加拿大 | 2015 | 200 |
| Canada | 2015 | 50 |
| 墨西哥 | 2013 | 300 |
| 英国 | 2014 | 150 |
| USA | 2015 | 75 |
数据绑定:

Power BI 以表数据视图的形式显示数据。 不假定数据已排序。
{
    "table" : {
        "columns": [...],
        "rows": [
            [
                "Canada",
                2014,
                630
            ],
            [
                "Canada",
                2015,
                490
            ],
            [
                "Mexico",
                2013,
                645
            ],
            [
                "UK",
                2014,
                831
            ],
            [
                "USA",
                2015,
                650
            ],
            [
                "USA",
                2016,
                350
            ]
        ]
    }
}
若要聚合数据,请选择所需的字段,然后选择“求和”。

处理表数据视图映射的代码示例。
"use strict";
import "./../style/visual.less";
import powerbi from "powerbi-visuals-api";
// ...
import DataViewMetadataColumn = powerbi.DataViewMetadataColumn;
import DataViewTable = powerbi.DataViewTable;
import DataViewTableRow = powerbi.DataViewTableRow;
import PrimitiveValue = powerbi.PrimitiveValue;
// standard imports
// ...

export class Visual implements IVisual {
    private target: HTMLElement;
    private host: IVisualHost;
    private table: HTMLParagraphElement;

    constructor(options: VisualConstructorOptions) {
        // constructor body
        this.target = options.element;
        this.host = options.host;
        this.table = document.createElement("table");
        this.target.appendChild(this.table);
        // ...
    }

    public update(options: VisualUpdateOptions) {
        const dataView: DataView = options.dataViews[0];
        const tableDataView: DataViewTable = dataView.table;

        if (!tableDataView) {
            return
        }
        while(this.table.firstChild) {
            this.table.removeChild(this.table.firstChild);
        }

        //draw header
        const tableHeader = document.createElement("th");
        tableDataView.columns.forEach((column: DataViewMetadataColumn) => {
            const tableHeaderColumn = document.createElement("td");
            tableHeaderColumn.innerText = column.displayName
            tableHeader.appendChild(tableHeaderColumn);
        });
        this.table.appendChild(tableHeader);

        //draw rows
        tableDataView.rows.forEach((row: DataViewTableRow) => {
            const tableRow = document.createElement("tr");
            row.forEach((columnValue: PrimitiveValue) => {
                const cell = document.createElement("td");
                cell.innerText = columnValue.toString();
                tableRow.appendChild(cell);
            })
            this.table.appendChild(tableRow);
        });
    }
}
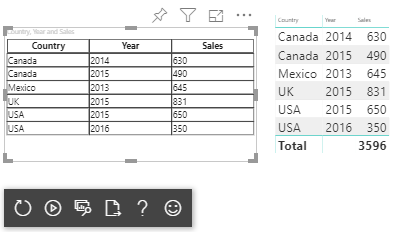
视觉对象样式文件 style/visual.less 包含表的布局:
table {
    display: flex;
    flex-direction: column;
}

tr, th {
    display: flex;
    flex: 1;
}

td {
    flex: 1;
    border: 1px solid black;
}
生成的视觉对象如下所示:
矩阵数据映射
矩阵数据映射与表数据映射类似,但前者按层次结构显示行。 任意一个数据角色值均可用作列标题值。
{
    "dataRoles": [
        {
            "name": "Category",
            "displayName": "Category",
            "displayNameKey": "Visual_Category",
            "kind": "Grouping"
        },
        {
            "name": "Column",
            "displayName": "Column",
            "displayNameKey": "Visual_Column",
            "kind": "Grouping"
        },
        {
            "name": "Measure",
            "displayName": "Measure",
            "displayNameKey": "Visual_Values",
            "kind": "Measure"
        }
    ],
    "dataViewMappings": [
        {
            "matrix": {
                "rows": {
                    "for": {
                        "in": "Category"
                    }
                },
                "columns": {
                    "for": {
                        "in": "Column"
                    }
                },
                "values": {
                    "select": [
                        {
                            "for": {
                                "in": "Measure"
                            }
                        }
                    ]
                }
            }
        }
    ]
}
矩阵数据的层次结构
Power BI 创建分层数据结构。 树层次结构的根包括来自 Category 数据角色的“父级”列数据,以及来自数据角色表的“子级”列的子项。
语义模型:
| 父项 | 子女 | 孙级 | 列 | 值 |
|---|---|---|---|---|
| Parent1 | Child1 | Grand child1 | Col1 | 5 |
| Parent1 | Child1 | Grand child1 | Col2 | 6 |
| Parent1 | Child1 | Grand child2 | Col1 | 7 |
| Parent1 | Child1 | Grand child2 | Col2 | 8 |
| Parent1 | Child2 | Grand child3 | Col1 | 5 |
| Parent1 | Child2 | Grand child3 | Col2 | 3 |
| Parent1 | Child2 | Grand child4 | Col1 | 4 |
| Parent1 | Child2 | Grand child4 | Col2 | 9 |
| Parent1 | Child2 | Grand child5 | Col1 | 3 |
| Parent1 | Child2 | Grand child5 | Col2 | 5 |
| Parent2 | Child3 | Grand child6 | Col1 | 1 |
| Parent2 | Child3 | Grand child6 | Col2 | 2 |
| Parent2 | Child3 | Grand child7 | Col1 | 7 |
| Parent2 | Child3 | Grand child7 | Col2 | 1 |
| Parent2 | Child3 | Grand child8 | Col1 | 10 |
| Parent2 | Child3 | Grand child8 | Col2 | 13 |
Power BI 的核心矩阵视觉对象将数据呈现为表。
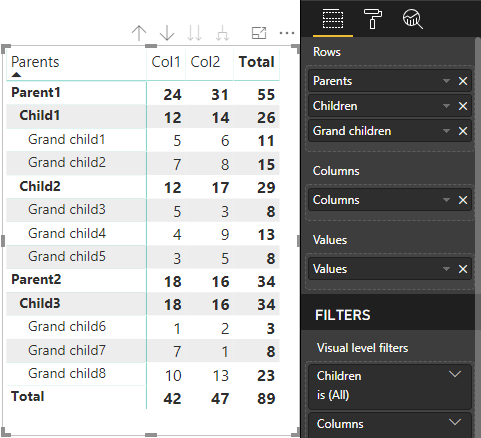
视觉对象按以下代码所述获取其数据结构(此处仅显示前两个表行):
{
    "metadata": {...},
    "matrix": {
        "rows": {
            "levels": [...],
            "root": {
                "childIdentityFields": [...],
                "children": [
                    {
                        "level": 0,
                        "levelValues": [...],
                        "value": "Parent1",
                        "identity": {...},
                        "childIdentityFields": [...],
                        "children": [
                            {
                                "level": 1,
                                "levelValues": [...],
                                "value": "Child1",
                                "identity": {...},
                                "childIdentityFields": [...],
                                "children": [
                                    {
                                        "level": 2,
                                        "levelValues": [...],
                                        "value": "Grand child1",
                                        "identity": {...},
                                        "values": {
                                            "0": {
                                                "value": 5 // value for Col1
                                            },
                                            "1": {
                                                "value": 6 // value for Col2
                                            }
                                        }
                                    },
                                    ...
                                ]
                            },
                            ...
                        ]
                    },
                    ...
                ]
            }
        },
        "columns": {
            "levels": [...],
            "root": {
                "childIdentityFields": [...],
                "children": [
                    {
                        "level": 0,
                        "levelValues": [...],
                        "value": "Col1",
                        "identity": {...}
                    },
                    {
                        "level": 0,
                        "levelValues": [...],
                        "value": "Col2",
                        "identity": {...}
                    },
                    ...
                ]
            }
        },
        "valueSources": [...]
    }
}
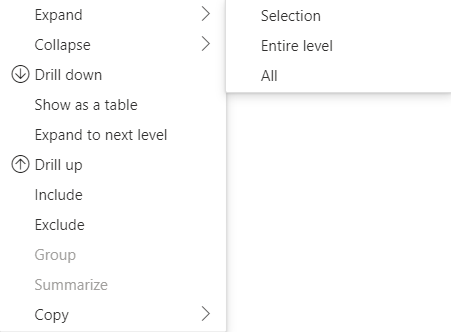
展开和折叠行标题
对于 API 4.1.0 或更高版本,矩阵数据支持扩展和折叠行标题。 从 API 4.2,可以以编程方式展开/折叠整个级别。 展开和折叠功能允许用户展开或折叠行,而无需提取下一级别的所有数据,从而优化了将数据提取到 dataView 的过程。 它仅提取所选行的数据。 行标题的展开状态仍将在书签之间甚至在报告保存之间保持一致。 它并不特定于每个视觉对象。
可通过将 dataRoles 参数提供给 showContextMenu 方法,将展开和折叠命令添加到上下文菜单中。
若要扩展大量数据点,请使用带展开/折叠 API 的提取更多数据 API。
API 功能
为了能够展开和折叠行标题,我们在 API 版本 4.1.0 中添加了以下元素:
isCollapsed中的DataViewTreeNode标志:interface DataViewTreeNode { //... /** * TRUE if the node is Collapsed * FALSE if it is Expanded * Undefined if it cannot be Expanded (e.g. subtotal) */ isCollapsed?: boolean; }toggleExpandCollapse接口中的ISelectionManger方法:interface ISelectionManager { //... showContextMenu(selectionId: ISelectionId, position: IPoint, dataRoles?: string): IPromise<{}>; // dataRoles is the name of the role of the selected data point toggleExpandCollapse(selectionId: ISelectionId, entireLevel?: boolean): IPromise<{}>; // Expand/Collapse an entire level will be available from API 4.2.0 //... }DataViewTreeNodeValue 中的
canBeExpanded标志:interface DataViewHierarchyLevel { //... /** If TRUE, this level can be expanded/collapsed */ canBeExpanded?: boolean; }
视觉对象要求
使用矩阵数据视图对视觉对象启用展开/折叠功能:
在 capabilities.json 文件中添加以下代码:
   "expandCollapse": {
    "roles": ["Rows"], //”Rows” is the name of rows data role
    "addDataViewFlags": {
        "defaultValue": true //indicates if the DataViewTreeNode will get the isCollapsed flag by default
    }
},
确认角色可钻取:
    "drilldown": {
    "roles": ["Rows"]
},
对于每个节点,在所选节点层次结构级别调用
withMatrixNode方法并创建selectionId,以创建选择生成器的实例。 例如:let nodeSelectionBuilder: ISelectionIdBuilder = visualHost.createSelectionIdBuilder(); // parantNodes is a list of the parents of the selected node. // node is the current node which the selectionId is created for. parentNodes.push(node); for (let i = 0; i < parentNodes.length; i++) { nodeSelectionBuilder = nodeSelectionBuilder.withMatrixNode(parentNodes[i], levels); } const nodeSelectionId: ISelectionId = nodeSelectionBuilder.createSelectionId();创建选择管理器的实例,并将
selectionManager.toggleExpandCollapse()方法与为所选节点创建的selectionId的参数一起使用。 例如:// handle click events to apply expand\collapse action for the selected node button.addEventListener("click", () => { this.selectionManager.toggleExpandCollapse(nodeSelectionId); });
注意
- 如果所选节点不是行节点,则 PowerBI 将忽略展开和折叠调用,并将从上下文菜单中删除展开和折叠命令。
- 只有在视觉对象支持
drilldown或expandCollapse功能时,showContextMenu方法才需要dataRoles参数。 如果视觉对象支持这些功能,但未提供 dataRoles,则在使用开发者视觉对象或调试启用了调试模式的公共视觉对象时,将向控制台输出一个错误。
注意事项和限制
- 展开节点后,新的数据限制将应用到 DataView。 新的 DataView 可能不包括以前的 DataView 中出现的某些节点。
- 使用展开或折叠时,即使视觉对象未请求,也会添加合计。
- 不支持展开和折叠列。
保留所有元数据列
对于 API 5.1.0 或更高版本,支持保留所有元数据列。 此功能允许视觉对象接收所有列的元数据,无论其活动投影是什么。
将以下行添加到 capabilities.json 文件中:
"keepAllMetadataColumns": {
    "type": "boolean",
    "description": "Indicates that visual is going to receive all metadata columns, no matter what the active projections are"
}
将此属性设置为 true 将导致接收所有元数据,包括从折叠列接收。 将其设置为 false 或将其保留为未定义,将导致仅在具有活动投影(例如展开)的列上接收元数据。
数据缩减算法
数据缩减算法控制数据视图中接收的数据和数据量。
count 设置为数据视图可接受的最大值数。 如果实际数量超过 count 值,则数据缩减算法可确定应该接收哪些值。
数据缩减算法类型
有四种类型的数据缩减算法设置:
top:将从语义模型中获取第一个“count”值。bottom:将从语义模型中获取最后一个“count”值。sample:包含第一项和最后一项,以及具有相等间隔的一组“count”数量的项。 例如,如果你有语义模型 [0, 1, 2, ...100] 且“count”值为 9,则会收到值 [0, 10, 20 ...100]。window:一次加载一个“窗口”的数据点,其中包含“count”元素 。 当前top和window等效。 未来将完全支持窗口化设置。
默认情况下,所有 Power BI 视觉对象都应用了顶级数据缩减算法,并将“count”设置为 1000 个数据点。 此默认功能相当于在 capabilities.json 文件中设置了以下属性:
"dataReductionAlgorithm": {
    "top": {
        "count": 1000
    }
}
可以将“count”值修改为不超过 30000 的任何整数值。 基于 R 的 Power BI 视觉对象最多可支持 150000 行。
数据缩减算法使用情况
数据缩减算法可用于分类、表或矩阵数据视图映射。
在分类数据映射中,可以将此算法添加到分类数据映射的 values 的“类别”和/或“组”部分。
"dataViewMappings": {
    "categorical": {
        "categories": {
            "for": { "in": "category" },
            "dataReductionAlgorithm": {
                "window": {
                    "count": 300
                }
            }
        },
        "values": {
            "group": {
                "by": "series",
                "select": [{
                        "for": {
                            "in": "measure"
                        }
                    }
                ],
                "dataReductionAlgorithm": {
                    "top": {
                        "count": 100
                    }
                }
            }
        }
    }
}
在表数据视图映射中,可以将数据缩减算法应用于数据视图映射表的 rows 部分。
"dataViewMappings": [
    {
        "table": {
            "rows": {
                "for": {
                    "in": "values"
                },
                "dataReductionAlgorithm": {
                    "top": {
                        "count": 2000
                    }
                }
            }
        }
    }
]
可以将数据缩减算法应用于数据视图映射矩阵的 rows 和 columns 部分。
后续步骤
反馈
即将发布:在整个 2024 年,我们将逐步淘汰作为内容反馈机制的“GitHub 问题”,并将其取代为新的反馈系统。 有关详细信息,请参阅:https://aka.ms/ContentUserFeedback。
提交和查看相关反馈