Collect telemetry data for search traffic analytics
Search traffic analytics is a pattern for collecting telemetry about user interactions with your Azure AI Search application, such as user-initiated click events and keyboard inputs. Using this information, you can determine the effectiveness of your search solution, including popular search terms, clickthrough rate, and which query inputs yield zero results.
This pattern takes a dependency on Application Insights (a feature of Azure Monitor) to collect user data. It requires that you add instrumentation to your client code, as described in this article. Finally, you need a reporting mechanism to analyze the data. We recommend Power BI, but you can use the Application Dashboard or any tool that connects to Application Insights.
Note
The pattern described in this article is for advanced scenarios and clickstream data generated by code you add to your client. In contrast, service logs are easy to set up, provide a range of metrics, and can be done in the portal with no code required. Enabling logging is recommended for all scenarios. For more information, see Collect and analyze log data.
Identify relevant search data
To have useful metrics for search traffic analytics, it's necessary to log some signals from the users of your search application. These signals signify content that users are interested in and that they consider relevant. For search traffic analytics, these include:
User-generated search events: Only search queries initiated by a user are interesting. Other search requests, such as those used to populate facets or retrieve internal information, aren't important. Be sure to only instrument user-initiated events to avoid skew or bias in your results.
User-generated click events: On a search results page, a click event generally means that a document is a relevant result for a specific search query.
By linking search and click events with a correlation ID, you can gain a deeper understanding of how well your application's search functionality is performing.
Add search traffic analytics
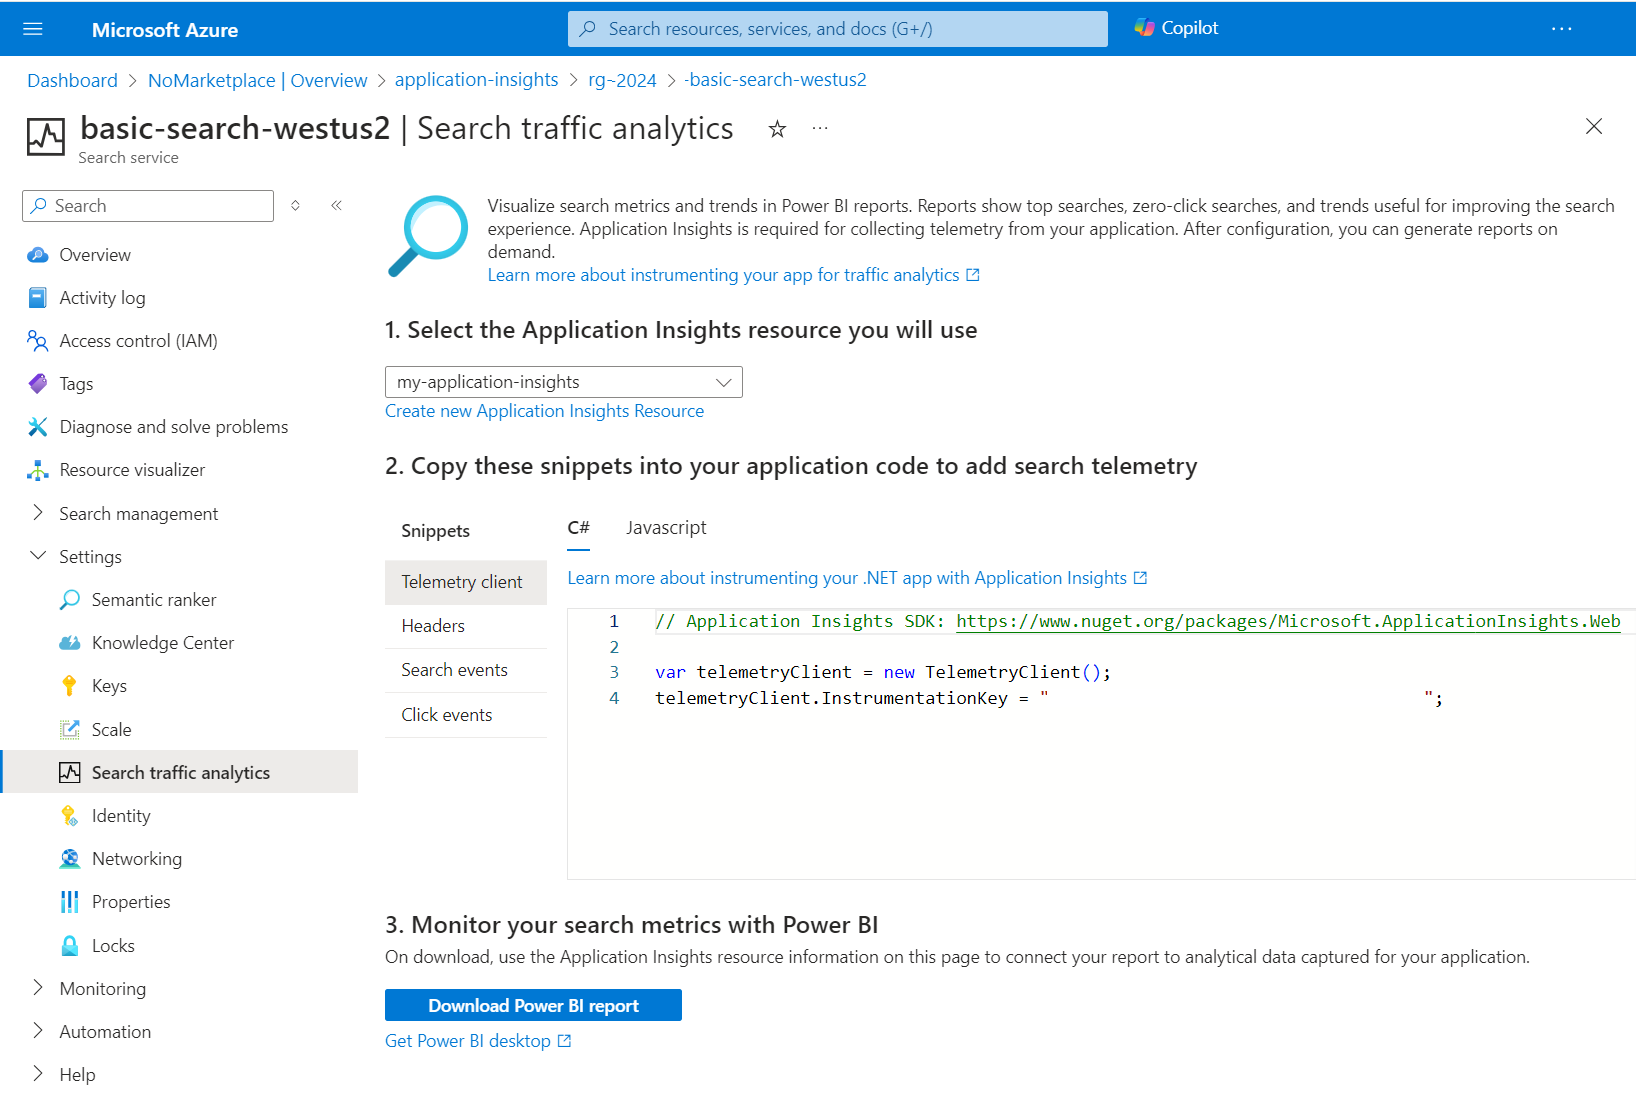
In the portal page for your Azure AI Search service, open the Search Traffic Analytics page to access a cheat sheet for following this telemetry pattern. From this page, you can select or create an Application Insights resource, get the instrumentation key, copy snippets that you can adapt for your solution, and download a Power BI report that's built over the schema reflected in the pattern.
Step 1: Set up Application Insights
Select an existing Application Insights resource or create one if you don't have one already.
A shortcut that works for some Visual Studio project types is reflected in the following steps.
For illustration, these steps use the client from Add search to a static web app.
Open your solution in Visual Studio.
On the Project menu, select Connected services > Add > Azure Application Insights.
In Connect to dependency, select Azure Application Insights, and then select Next.
Select your Azure subscription, your Application Insights resource, and then select Finish.
At this point, your application is set up for application monitoring, which means all page loads in your client app are tracked with default metrics.
If this shortcut didn't work for you, see Enable Application Insights server-side telemetry.
Step 2: Add instrumentation
Add instrumentation code to your client application. The Search Traffic Analytics page in the Azure portal provides code snippets that you can paste into your application code.
Create a telemetry client
Create an object that sends events to Application Insights. You can add instrumentation to your server-side application code or client-side code running in a browser, expressed here as C# and JavaScript variants. For other languages, see supported platforms and frameworks.
Server-side telemetry captures metrics at the application layer, for example in applications running as a web service on Azure, or as an on-premises app on a corporate network. Server-side telemetry captures search and click events, the position of a document in results, and query information, but your data collection will be scoped to whatever information is available at that layer.
On the client, you might have other code that manipulates query inputs, adds navigation, or includes context (for example, queries initiated from a home page versus a product page). If this describes your solution, you might opt for client-side instrumentation so that your telemetry reflects the extra detail. How this extra detail is collected goes beyond the scope of this pattern, but you can review Application Insights for web pages for help with that decision.
You can get the instrumentation key from Azure portal, either in the pages for Application Insights or in the Search traffic analytics page for Azure AI Search.
// Application Insights SDK: https://www.nuget.org/packages/Microsoft.ApplicationInsights.Web

var telemetryClient = new TelemetryClient();
telemetryClient.InstrumentationKey = "0000000000000000000000000000";
Log search events
Every time that a search request is issued by a user, you should log that as a search event with the following schema on an Application Insights custom event. Remember to log only user-generated search queries.
- SearchServiceName: (string) search service name
- SearchId: (guid) unique identifier of the search query (comes in the search response)
- IndexName: (string) search service index to be queried
- QueryTerms: (string) search terms entered by the user
- ResultCount: (int) number of documents that were returned (comes in the search response)
- ScoringProfile: (string) name of the scoring profile used, if any
Note
Request the count of user generated queries by adding $count=true to your search query. For more information, see Search Documents (REST).
var properties = new Dictionary <string, string> {
	{"SearchServiceName", <SEARCH SERVICE NAME>},
	{"SearchId", <SEARCH ID>},
	{"IndexName", <INDEX NAME>},
	{"QueryTerms", <SEARCH TERMS>},
	{"ResultCount", <RESULTS COUNT>},
	{"ScoringProfile", <SCORING PROFILE USED>}
};

telemetryClient.TrackEvent("Search", properties);
Log click events
Every time that a user clicks on a document, that's a signal that must be logged for search analysis purposes. Use Application Insights custom events to log these events with the following schema:
- ServiceName: (string) search service name
- SearchId: (guid) unique identifier of the related search query
- DocId: (string) document identifier
- Position: (int) rank of the document in the search results page
Note
Position refers to the cardinal order in your application. You are free to set this number, as long as it's always the same, to allow for comparison.
var properties = new Dictionary <string, string> {
	{"SearchServiceName", <SEARCH SERVICE NAME>},
	{"SearchId", <SEARCH ID>},
	{"ClickedDocId", <CLICKED DOCUMENT ID>},
	{"Rank", <CLICKED DOCUMENT POSITION>}
};

telemetryClient.TrackEvent("Click", properties);
Step 3: Analyze in Power BI
After you have instrumented your app and verified your application is correctly connected to Application Insights, you download a predefined report template to analyze data in Power BI desktop. The report contains predefined charts and tables useful for analyzing the extra data captured for search traffic analytics.
In the Azure portal on the search service pages, under Settings, select Search traffic analytics.
Select Get Power BI Desktop to install Power BI.
Select Download Power BI report to get the report.
The report opens in Power BI Desktop, and you're prompted to connect to Application Insights and provide credentials. You can find connection information in the Azure portal pages for your Application Insights resource. For credentials, provide the same user name and password that you use for portal sign-in.
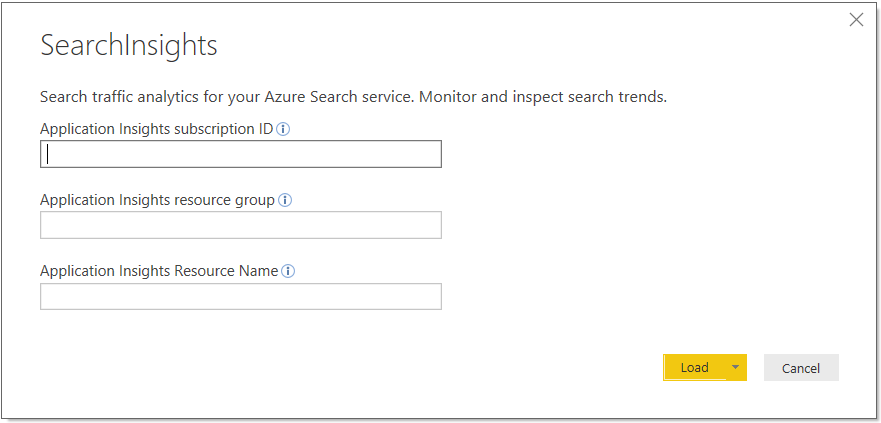
Select Load.
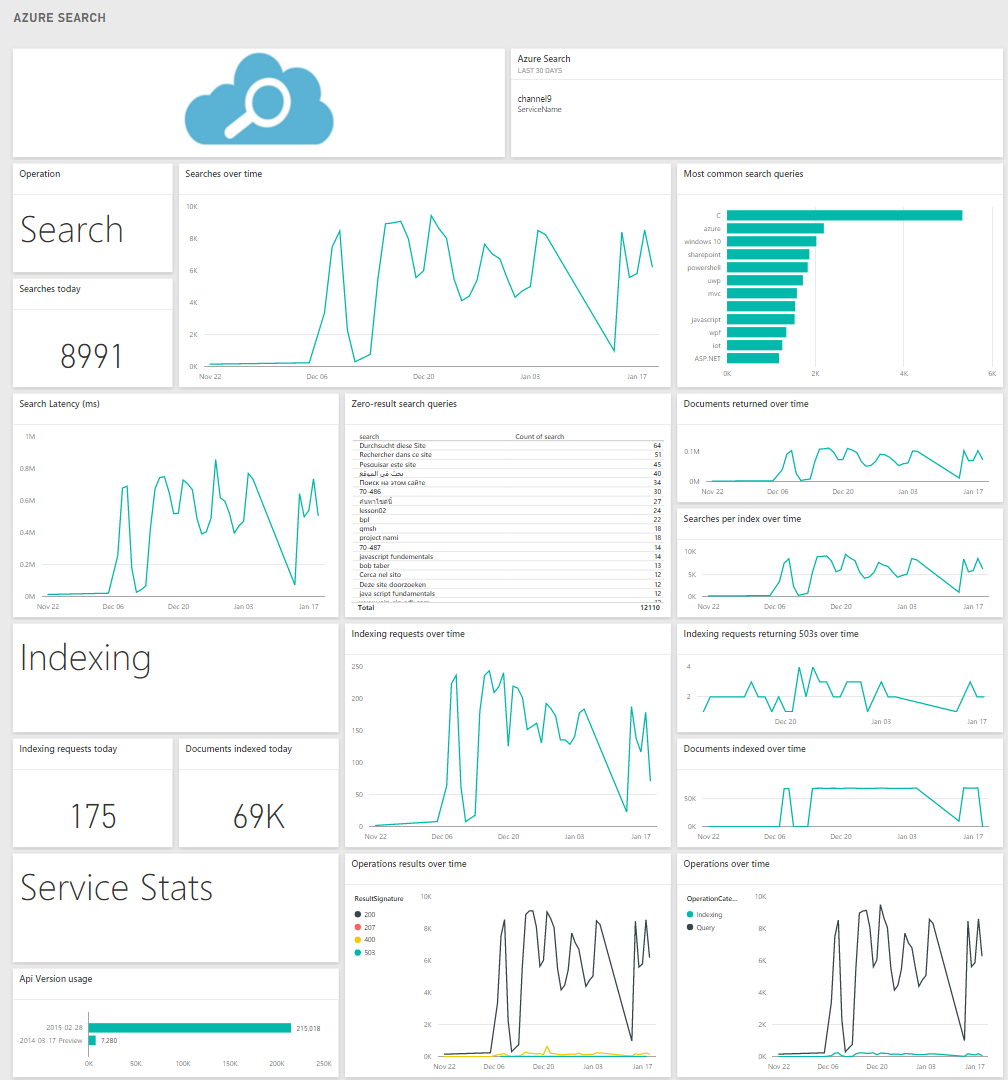
The report contains charts and tables that help you make more informed decisions to improve your search performance and relevance.
Metrics included the following items:
- Search volume and most popular term-document pairs: terms that result in the same document clicked, ordered by clicks.
- Searches without clicks: terms for top queries that register no clicks
The following screenshot shows what a built-in report might look like if you have used all of the schema elements.
Next steps
Instrument your search application to get powerful and insightful data about your search service.
You can find more information on Application Insights and visit the pricing page to learn more about their different service tiers.
Learn more about creating reports. See Getting started with Power BI Desktop for details.
Feedback
Coming soon: Throughout 2024 we will be phasing out GitHub Issues as the feedback mechanism for content and replacing it with a new feedback system. For more information see: https://aka.ms/ContentUserFeedback.
Submit and view feedback for