Azure Monitor Application Insights is an OpenTelemetry feature of Azure Monitor that offers application performance monitoring (APM) for live web applications. By integrating with OpenTelemetry (OTel), it provides a vendor-neutral approach to collecting and analyzing telemetry data, enabling comprehensive observability of your applications.

Application Insights Experiences
Application Insights supports OpenTelemetry (OTel) to collect telemetry data in a standardized format across platforms. Integration with Azure services allows for efficient monitoring and diagnostics, improving application observability and performance.
- Application dashboard: An at-a-glance assessment of your application's health and performance.
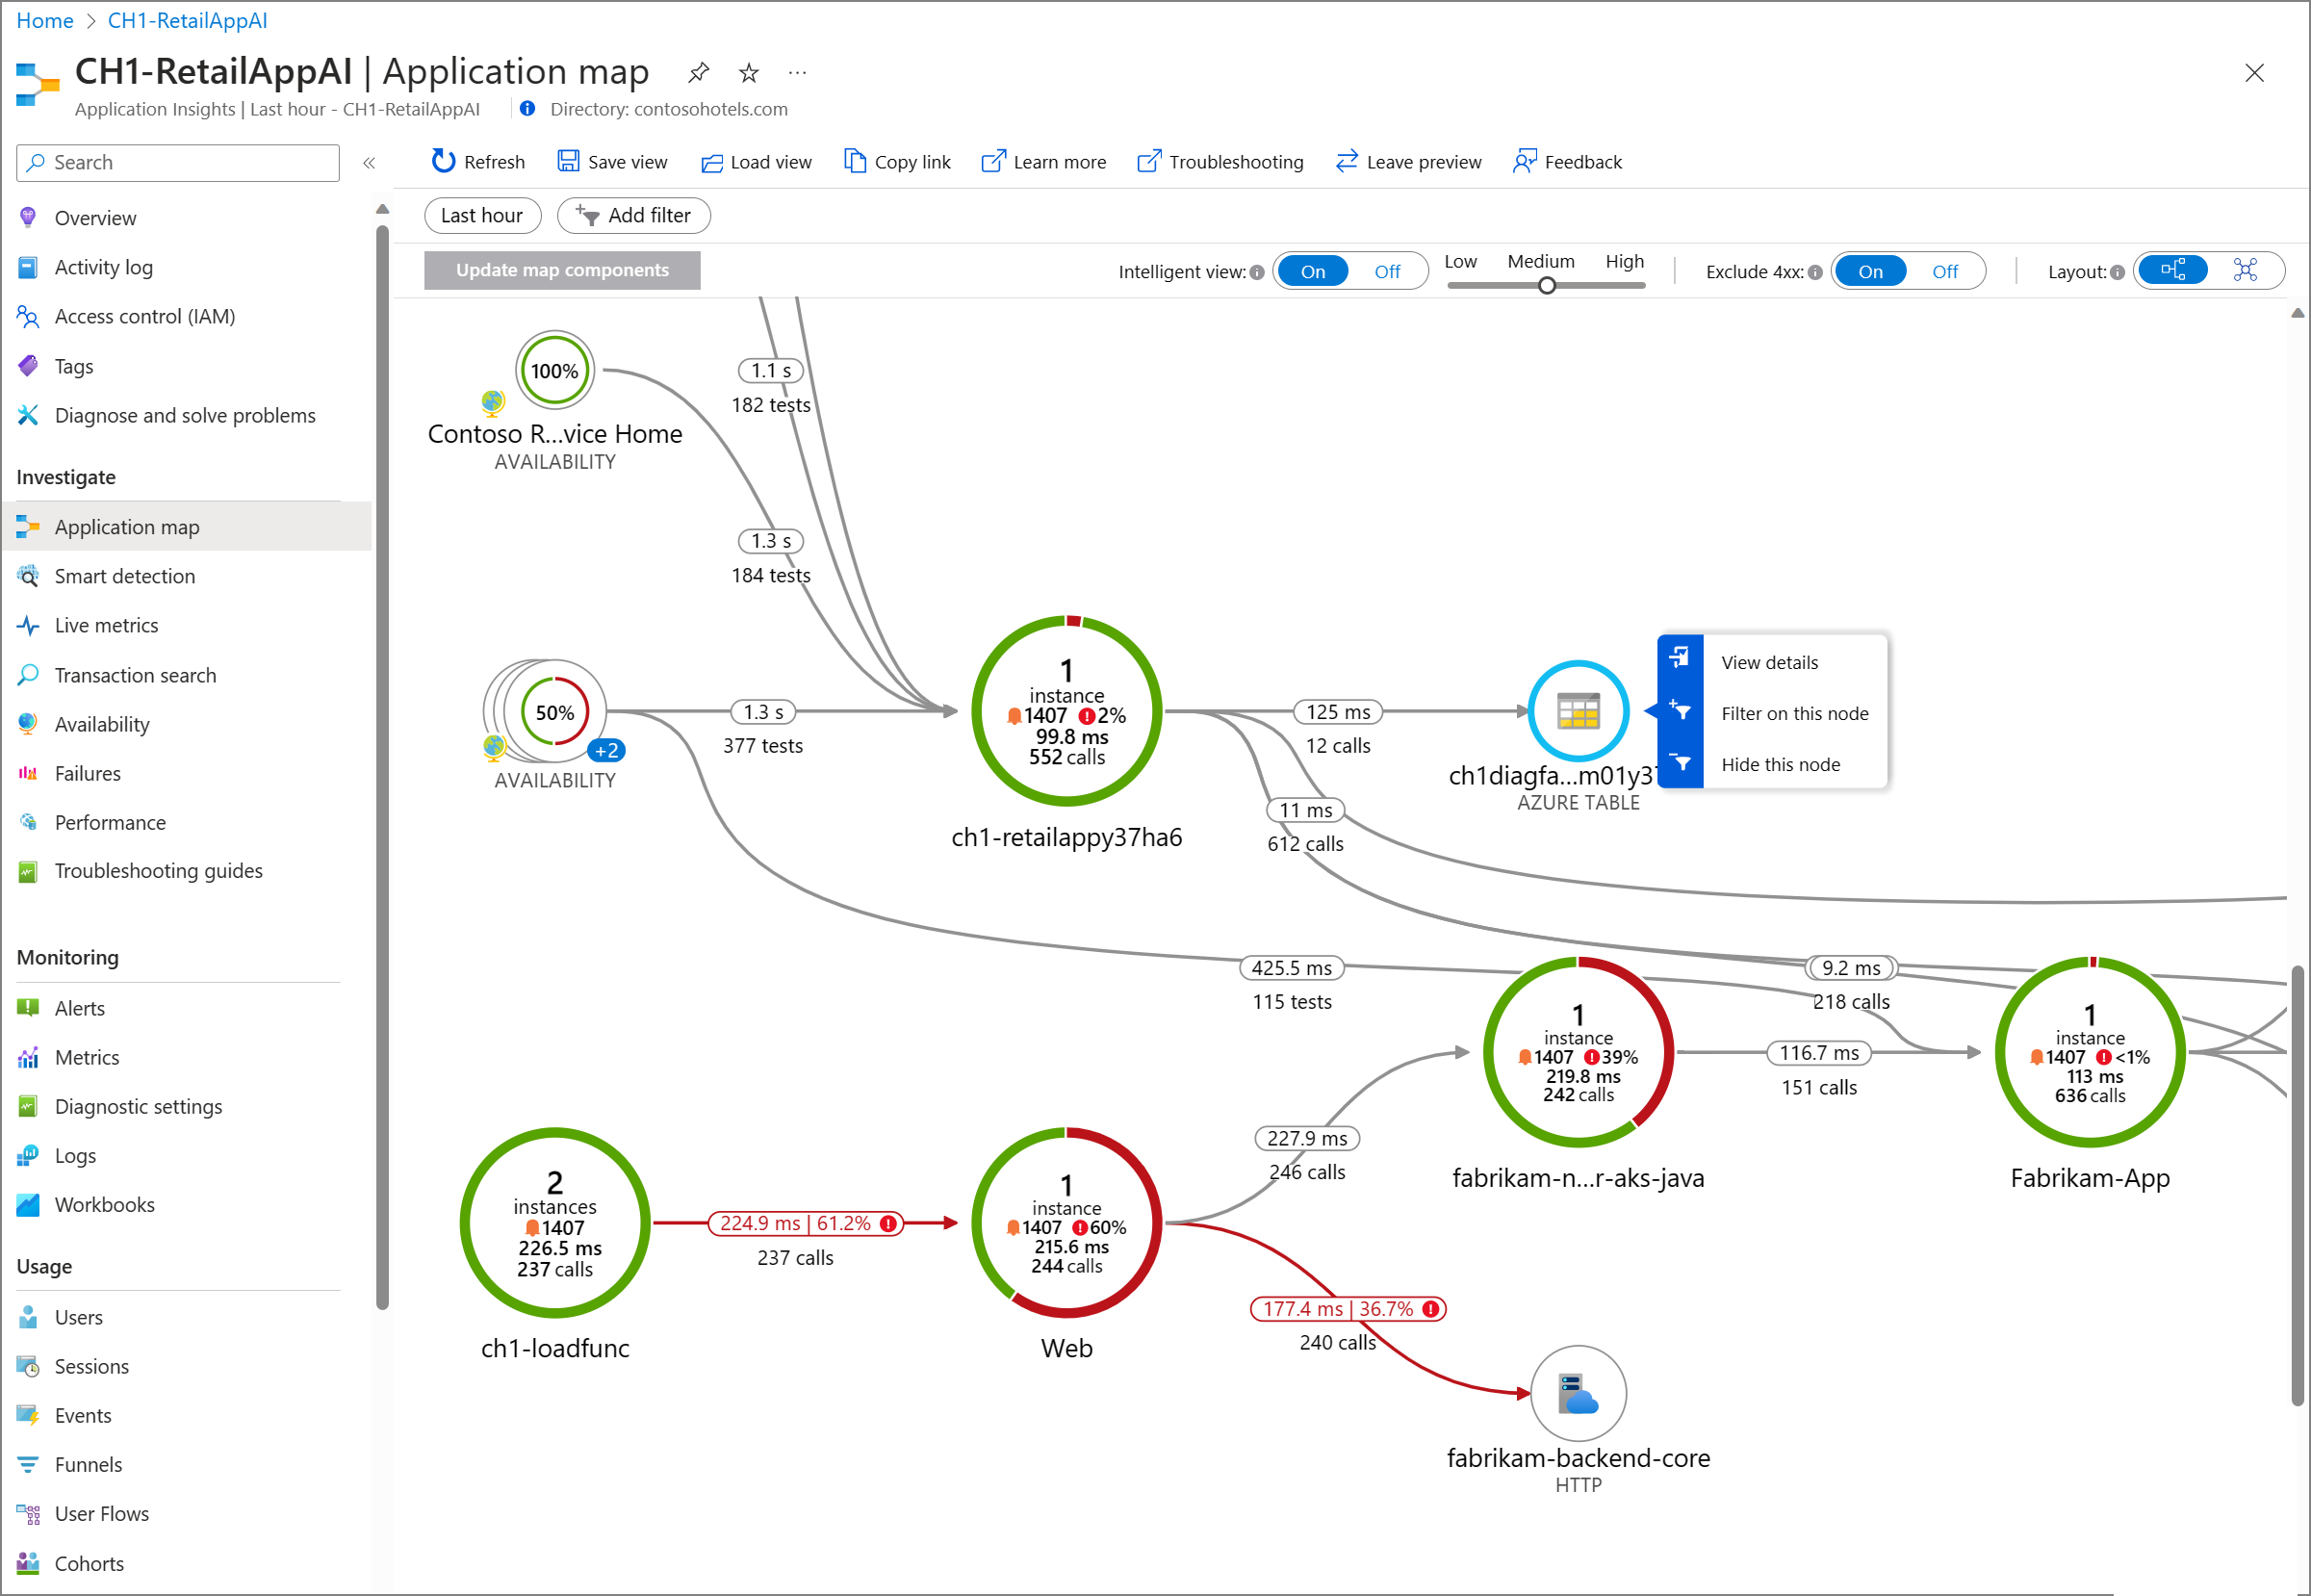
- Application map: A visual overview of application architecture and components' interactions.
- Live metrics: A real-time analytics dashboard for insight into application activity and performance.
- Transaction search: Trace and diagnose transactions to identify issues and optimize performance.
- Availability view: Proactively monitor and test the availability and responsiveness of application endpoints.
- Failures view: Identify and analyze failures in your application to minimize downtime.
- Performance view: Review application performance metrics and potential bottlenecks.
- Alerts: Monitor a wide range of aspects of your application and trigger various actions.
- Metrics: Dive deep into metrics data to understand usage patterns and trends.
- Diagnostic settings: Configure streaming export of platform logs and metrics to the destination of your choice.
- Logs: Retrieve, consolidate, and analyze all data collected into Azure Monitoring Logs.
- Workbooks: Create interactive reports and dashboards that visualize application monitoring data.
- Users, sessions, and events: Determine when, where, and how users interact with your web app.
- Funnels: Analyze conversion rates to identify where users progress or drop off in the funnel.
- Flows: Visualize user paths on your site to identify high engagement areas and exit points.
- Cohorts: Group users by shared characteristics to simplify trend identification, segmentation, and performance troubleshooting.
- .NET Profiler: Capture, identify, and view performance traces for your application.
- Code optimizations: Harness AI to create better and more efficient applications.
- Snapshot debugger: Automatically collect debug snapshots when exceptions occur in .NET application
The logic model diagram visualizes components of Application Insights and how they interact.

This section outlines supported scenarios.
For more information about instrumenting applications to enable Application Insights, see data collection basics.
Automatic instrumentation (enable without code changes)
Client-side JavaScript SDK
Application Insights SDK (Classic API)
This section lists all supported platforms and frameworks.
Azure service integration (portal enablement, Azure Resource Manager deployments)
Unsupported Software Development Kits (SDKs)
Many community-supported Application Insights SDKs exist, but Microsoft only provides support for instrumentation options listed in this article.
For assistance with troubleshooting Application Insights, see our dedicated troubleshooting documentation.
Frequently asked questions
This section provides answers to common questions.
How do I instrument an application?
For detailed information about instrumenting applications to enable Application Insights, see data collection basics.
How do I use Application Insights?
After enabling Application Insights by instrumenting an application, we suggest first checking out Live metrics and the Application map.
What telemetry does Application Insights collect?
From server web apps:
From client webpages:
Uncaught exceptions in your app, including information on
- Stack trace
- Exception details and message accompanying the error
- Line & column number of error
- URL where error was raised
- Network Dependency Requests made by your app XML Http Request (XHR) and Fetch (fetch collection is disabled by default) requests, include information on:
- Url of dependency source
- Command & Method used to request the dependency
- Duration of the request
- Result code and success status of the request
- ID (if any) of user making the request
- Correlation context (if any) where request is made
User information (for example, Location, network, IP)
Device information (for example, Browser, OS, version, language, model)
Session information
Note
For some applications, such as single-page applications (SPAs), the duration may not be recorded and will default to 0.
For more information, see Data collection, retention, and storage in Application Insights.
From other sources, if you configure them:
How many Application Insights resources should I deploy?
To understand the number of Application Insights resources required to cover your application or components across environments, see the Application Insights deployment planning guide.
How can I manage Application Insights resources with PowerShell?
You can write PowerShell scripts by using Azure Resource Monitor to:
- Create and update Application Insights resources.
- Set the pricing plan.
- Get the instrumentation key.
- Add a metric alert.
- Add an availability test.
You can't set up a metrics explorer report or set up continuous export.
How can I query Application Insights telemetry?
Use the REST API to run Log Analytics queries.
Can I send telemetry to the Application Insights portal?
We recommend the Azure Monitor OpenTelemetry Distro.
The ingestion schema and endpoint protocol are available publicly.
How long does it take for telemetry to be collected?
Most Application Insights data has a latency of under 5 minutes. Some data can take longer, which is typical for larger log files. See the Application Insights service-level agreement.
How does Application Insights handle data collection, retention, storage, and privacy?
Application Insights collects telemetry about your app, including web server telemetry, web page telemetry, and performance counters. This data can be used to monitor your app's performance, health, and usage. You can select the location when you create a new Application Insights resource.
Data is sent to an Application Insights Log Analytics workspace. You can choose the retention period for raw data, from 30 to 730 days. Aggregated data is retained for 90 days, and debug snapshots are retained for 15 days.
Application Insights doesn't handle sensitive data by default. We recommend you don't put sensitive data in URLs as plain text and ensure your custom code doesn't collect personal or other sensitive details. During development and testing, check the sent data in your IDE and browser's debugging output windows.
For archived information, see Data collection, retention, and storage in Application Insights.
What is the Application Insights pricing model?
Application Insights is billed through the Log Analytics workspace into which its log data ingested. The default Pay-as-you-go Log Analytics pricing tier includes 5 GB per month of free data allowance per billing account. Learn more about Azure Monitor logs pricing options.
Are there data transfer charges between an Azure web app and Application Insights?
- If your Azure web app is hosted in a datacenter where there's an Application Insights collection endpoint, there's no charge.
- If there's no collection endpoint in your host datacenter, your app's telemetry incurs Azure outgoing charges.
This answer depends on the distribution of our endpoints, not on where your Application Insights resource is hosted.
Do I incur network costs if my Application Insights resource is monitoring an Azure resource (that is, telemetry producer) in a different region?
Yes, you can incur more network costs, which vary depending on the region the telemetry is coming from and where it's going.
Refer to Azure bandwidth pricing for details.
What TLS versions does Application Insights support
Important
On 1 March 2025, in alignment with the Azure wide legacy TLS retirement, TLS 1.0/1.1 protocol versions and the listed TLS 1.2/1.3 legacy Cipher suites and Elliptical curves will be retired for Application Insights.
To provide best-in-class encryption, Application Insights uses Transport Layer Security (TLS) 1.2 and 1.3 as the encryption mechanisms of choice.
For any general questions around the legacy TLS problem, see Solving TLS problems and Azure Resource Manager TLS Support.
For Azure support issues, open an Azure support ticket.
Microsoft Questions and Answers forum
Post general questions to the Microsoft Questions and Answers forum.
Post coding questions to Stack Overflow by using an azure-application-insights tag.
Leave product feedback for the engineering team in the Feedback Community.
