Προσθήκη υποστήριξης διερεύνησης
Όταν μια απεικόνιση έχει μια ιεραρχία, μπορείτε να επιτρέψετε στους χρήστες να χρησιμοποιούν τη δυνατότητα λεπτομερούς έρευνας του Power BI για να αποκαλύψουν περισσότερες λεπτομέρειες.
Διαβάστε περισσότερα σχετικά με τη δυνατότητα λεπτομερούς έρευνας του Power BI στη λειτουργία λεπτομερούς έρευνας στο Υπηρεσία Power BI. Για να επιτρέψετε στην απεικόνιση να ενεργοποιήσει ή να απενεργοποιήσει δυναμικά τη δυνατότητα λεπτομερούς έρευνας, ανατρέξτε στο θέμα Δυναμικό στοιχείο ελέγχου λεπτομερούς έρευνας.
Ενεργοποίηση υποστήριξης διερεύνησης στην απεικόνιση
Για να υποστηρίξετε ενέργειες λεπτομερούς έρευνας στην απεικόνισή σας, προσθέστε ένα νέο πεδίο στο capabilities.json όνομα drill-down. Αυτό το πεδίο έχει μία ιδιότητα που ονομάζεται roles που περιέχει το όνομα του dataRole στον οποίο θέλετε να ενεργοποιήσετε τις ενέργειες διερεύνησης.
    "drilldown": {
        "roles": [
            "category"
        ]
    }
Σημείωμα
Το dataRole διερεύνησης πρέπει να είναι Grouping τύπου .
max Η ιδιότητα στις συνθήκες dataRole πρέπει να οριστεί σε 1.
Αφού προσθέσετε τον ρόλο στο πεδίο λεπτομερούς έρευνας, οι χρήστες μπορούν να μεταφέρουν πολλά πεδία στον ρόλο δεδομένων.
Για παράδειγμα:
{
    "dataRoles": [
        {
            "displayName": "Category",
            "name": "category",
            "kind": "Grouping"
        },
        {
            "displayName": "Value",
            "name": "value",
            "kind": "Measure"
        }
    ],
    "drilldown": {
        "roles": [
            "category"
        ]
    },
    "dataViewMappings": [
        {
            "categorical": {
                "categories": {
                    "for": {
                        "in": "category"
                    }
                },
                "values": {
                    "select": [
                        {
                            "bind": {
                                "to": "value"
                            }
                        }
                    ]
                }
            }
        }
    ]
}
Δημιουργία απεικόνισης με υποστήριξη διερεύνησης
Για να δημιουργήσετε μια απεικόνιση με υποστήριξη διερεύνησης, εκτελέστε την ακόλουθη εντολή:
pbiviz new testDrillDown -t default
Για να δημιουργήσετε ένα προεπιλεγμένο δείγμα απεικόνισης, εφαρμόστε το παραπάνω δείγμαcapabilities.json στην απεικόνιση που μόλις δημιουργήθηκε.
Δημιουργήστε την ιδιότητα για το κοντέινερ ώστε div να περιέχει στοιχεία HTML της απεικόνισης:
"use strict";

import "core-js/stable";
import "./../style/visual.less";
// imports

export class Visual implements IVisual {
    // visual properties
    // ...
    private div: HTMLDivElement; // <== NEW PROPERTY

    constructor(options: VisualConstructorOptions) {
        // constructor body
        // ...
    }

    public update(options: VisualUpdateOptions) {
        // update method body
        // ...
    }

    /**
     * Returns properties pane formatting model content hierarchies, properties and latest formatting values, Then populate properties pane.
     * This method is called once each time we open the properties pane or when the user edits any format property.
     */
    public getFormattingModel(): powerbi.visuals.FormattingModel {
        return this.formattingSettingsService.buildFormattingModel(this.formattingSettings);
    }
}
Ενημερώστε την κατασκευή της απεικόνισης:
export class Visual implements IVisual {
    // visual properties
    // ...
    private div: HTMLDivElement;

    constructor(options: VisualConstructorOptions) {
        console.log('Visual constructor', options);
        this.formattingSettingsService = new FormattingSettingsService();
        this.target = options.element;
        this.updateCount = 0;

        if (document) {
            const new_p: HTMLElement = document.createElement("p");
            new_p.appendChild(document.createTextNode("Update count:"));
            const new_em: HTMLElement = document.createElement("em");
            this.textNode = document.createTextNode(this.updateCount.toString());
            new_em.appendChild(this.textNode);
            new_p.appendChild(new_em);
            this.div = document.createElement("div"); // <== CREATE DIV ELEMENT
            this.target.appendChild(new_p);
        }
    }
}
Για να δημιουργήσετε buttons, ενημερώστε τη update μέθοδο της απεικόνισης:
export class Visual implements IVisual {
    // ...

    public update(options: VisualUpdateOptions) {
        this.formattingSettings = this.formattingSettingsService.populateFormattingSettingsModel(VisualFormattingSettingsModel, options.dataViews);
        console.log('Visual update', options);

        const dataView: DataView = options.dataViews[0];
        const categoricalDataView: DataViewCategorical = dataView.categorical;

        // don't create elements if no data
        if (!options.dataViews[0].categorical ||
            !options.dataViews[0].categorical.categories) {
            return
        }

        // to display current level of hierarchy
        if (typeof this.textNode !== undefined) {
            this.textNode.textContent = categoricalDataView.categories[categoricalDataView.categories.length - 1].source.displayName.toString();
        }

        // remove old elements
        // for better performance use D3js pattern:
        // https://d3js.org/#enter-exit
        while (this.div.firstChild) {
            this.div.removeChild(this.div.firstChild);
        }

        // create buttons for each category value
        categoricalDataView.categories[categoricalDataView.categories.length - 1].values.forEach( (category: powerbi.PrimitiveValue, index: number) => {
            let button = document.createElement("button");
            button.innerText = category.toString();

            this.div.appendChild(button);
        })

    }
    // ...
Εφαρμόστε απλά στυλ στο .\style\visual.less:
button {
    margin: 5px;
    min-width: 50px;
    min-height: 50px;
}
Προετοιμασία δείγματος δεδομένων για τη δοκιμή της απεικόνισης:
| H1 | H2 | H3 | ΤΙΜΈΣ |
|---|---|---|---|
| A | A1 | A11 | 1 |
| A | A1 | A12 | 2 |
| A | A2 | A21 | 3 |
| A | A2 | A22 | 4 |
| A | A3 | A31 | 5 |
| A | A3 | A32 | 6 |
| B | B1 | B11 | 7 |
| B | B1 | B12 | 8 |
| B | Β2 | B21 | 9 |
| B | Β2 | B22 | 10 |
| B | B3 | B31 | 11 |
| B | B3 | B32 | 12 |
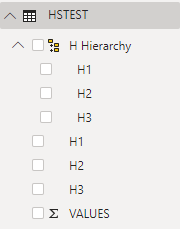
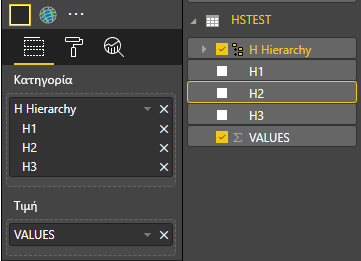
Και δημιουργήστε ιεραρχία στο Power BI Desktop:
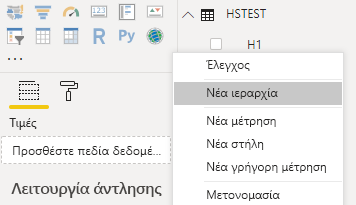
Συμπεριλάβετε όλες τις στήλες κατηγοριών (H1, H2, H3) στη νέα ιεραρχία:
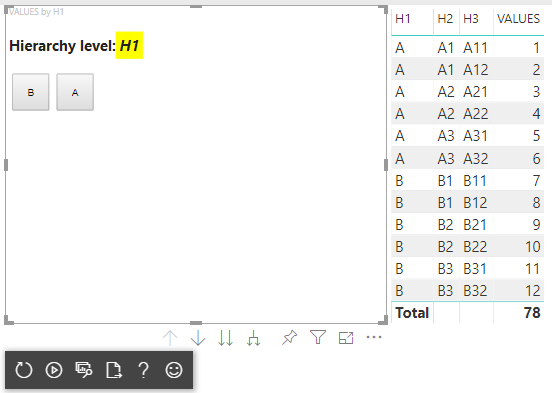
Μετά από αυτά τα βήματα θα πρέπει να λάβετε την ακόλουθη απεικόνιση:
Προσθήκη μενού περιβάλλοντος σε οπτικά στοιχεία
Για να προσθέσετε ένα μενού περιβάλλοντος στα κουμπιά στην απεικόνιση:
Αποθηκεύστε host το αντικείμενο στις ιδιότητες της απεικόνισης και καλέστε createSelectionManager τη μέθοδο στη διαχείριση δημιουργίας επιλογών για να εμφανίσετε ένα μενού περιβάλλοντος χρησιμοποιώντας το API απεικονίσεων Power BI.
"use strict";

import "core-js/stable";
import "./../style/visual.less";
// default imports

import IVisualHost = powerbi.extensibility.visual.IVisualHost;
import ISelectionManager = powerbi.extensibility.ISelectionManager;
import ISelectionId = powerbi.visuals.ISelectionId;

export class Visual implements IVisual {
    // visual properties
    // ...
    private div: HTMLDivElement;
    private host: IVisualHost; // <== NEW PROPERTY
    private selectionManager: ISelectionManager; // <== NEW PROPERTY

    constructor(options: VisualConstructorOptions) {
        // constructor body
        // save the host in the visuals properties
        this.host = options.host;
        // create selection manager
        this.selectionManager = this.host.createSelectionManager();
        // ...
    }

    public update(options: VisualUpdateOptions) {
        // update method body
        // ...
    }

    // ...
}
Αλλάξτε το σώμα της επιστροφής κλήσης forEach συνάρτησης σε:
    categoricalDataView.categories[categoricalDataView.categories.length - 1].values.forEach( (category: powerbi.PrimitiveValue, index: number) => {
        // create selectionID for each category value
        let selectionID: ISelectionId = this.host.createSelectionIdBuilder()
            .withCategory(categoricalDataView.categories[0], index)
            .createSelectionId();

        let button = document.createElement("button");
        button.innerText = category.toString();

        // add event listener to click event
        button.addEventListener("click", (event) => {
            // call select method in the selection manager
            this.selectionManager.select(selectionID);
        });

        button.addEventListener("contextmenu", (event) => {
            // call showContextMenu method to display context menu on the visual
            this.selectionManager.showContextMenu(selectionID, {
                x: event.clientX,
                y: event.clientY
            });
            event.preventDefault();
        });

        this.div.appendChild(button);
    });
Εφαρμογή δεδομένων στην απεικόνιση:
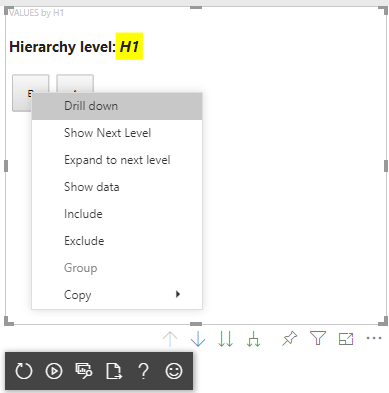
Στο τελικό βήμα θα πρέπει να λάβετε απεικόνιση με επιλογές και μενού περιβάλλοντος:
Προσθήκη υποστήριξης διερεύνησης για αντιστοίχιση προβολής δεδομένων μήτρας
Για να δοκιμάσετε την απεικόνιση με αντιστοιχίσεις προβολής δεδομένων μήτρας, προετοιμάστε πρώτα το δείγμα δεδομένων:
| Γραμμή 1 | Γραμμή 2 | Γραμμή 3 | Στήλη 1 | Στήλη 2 | Στήλη 3 | Τιμές |
|---|---|---|---|---|---|---|
| R1 | R11 | R111 | C1 | C11 | C111 | 1 |
| R1 | R11 | R112 | C1 | C11 | C112 | 2 |
| R1 | R11 | R113 | C1 | C11 | C113 | 3 |
| R1 | R12 | R121 | C1 | C12 | C121 | 4 |
| R1 | R12 | R122 | C1 | C12 | C122 | 5 |
| R1 | R12 | R123 | C1 | C12 | C123 | 6 |
| R1 | R13 | R131 | C1 | C13 | C131 | 7 |
| R1 | R13 | R132 | C1 | C13 | C132 | 8 |
| R1 | R13 | R133 | C1 | C13 | C133 | 9 |
| R2 | R21 | R211 | C2 | C21 | C211 | 10 |
| R2 | R21 | R212 | C2 | C21 | C212 | 11 |
| R2 | R21 | R213 | C2 | C21 | C213 | 12 |
| R2 | R22 | R221 | C2 | C22 | C221 | 13 |
| R2 | R22 | R222 | C2 | C22 | C222 | 14 |
| R2 | R22 | R223 | C2 | C22 | C223 | 16 |
| R2 | R23 | R231 | C2 | C23 | C231 | 17 |
| R2 | R23 | R232 | C2 | C23 | C232 | 18 |
| R2 | R23 | R233 | C2 | C23 | C233 | 19 |
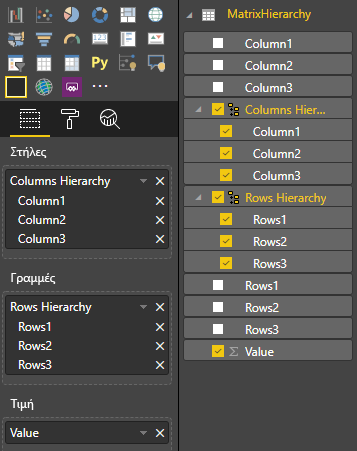
Στη συνέχεια, εφαρμόστε την παρακάτω αντιστοίχιση προβολής δεδομένων στην απεικόνιση:
{
    "dataRoles": [
        {
            "displayName": "Columns",
            "name": "columns",
            "kind": "Grouping"
        },
        {
            "displayName": "Rows",
            "name": "rows",
            "kind": "Grouping"
        },
        {
            "displayName": "Value",
            "name": "value",
            "kind": "Measure"
        }
    ],
    "drilldown": {
        "roles": [
            "columns",
            "rows"
        ]
    },
    "dataViewMappings": [
        {
            "matrix": {
                "columns": {
                    "for": {
                        "in": "columns"
                    }
                },
                "rows": {
                    "for": {
                        "in": "rows"
                    }
                },
                "values": {
                    "for": {
                        "in": "value"
                    }
                }
            }
        }
    ]
}
Εφαρμογή δεδομένων στην απεικόνιση:
Εισαγάγετε τις απαιτούμενες διασυνδέσεις για την επεξεργασία αντιστοιχίσεων προβολής δεδομένων μήτρας:
// ...
import DataViewMatrix = powerbi.DataViewMatrix;
import DataViewMatrixNode = powerbi.DataViewMatrixNode;
import DataViewHierarchyLevel = powerbi.DataViewHierarchyLevel;
// ...
Δημιουργήστε δύο ιδιότητες για δύο divστοιχεία γραμμών και στηλών:
export class Visual implements IVisual {
    // ...
    private rowsDiv: HTMLDivElement;
    private colsDiv: HTMLDivElement;
    // ...
    constructor(options: VisualConstructorOptions) {
        // constructor body
        // ...
        // Create div elements and append to main div of the visual
        this.rowsDiv = document.createElement("div");
        this.target.appendChild(this.rowsDiv);

        this.colsDiv = document.createElement("div");
        this.target.appendChild(this.colsDiv);
    }
    // ...
}
Ελέγξτε τα δεδομένα πριν την απόδοση στοιχείων και εμφανίστε το τρέχον επίπεδο ιεραρχίας:
export class Visual implements IVisual {
    // ...
    constructor(options: VisualConstructorOptions) {
        // constructor body
    }

    public update(options: VisualUpdateOptions) {
        this.formattingSettings = this.formattingSettingsService.populateFormattingSettingsModel(VisualFormattingSettingsModel, options.dataViews);
        console.log('Visual update', options);

        const dataView: DataView = options.dataViews[0];
        const matrixDataView: DataViewMatrix = dataView.matrix;

        // if the visual doesn't receive the data no reason to continue rendering
        if (!matrixDataView ||
            !matrixDataView.columns ||
            !matrixDataView.rows ) {
            return
        }

        // to display current level of hierarchy
        if (typeof this.textNode !== undefined) {
            this.textNode.textContent = categoricalDataView.categories[categoricalDataView.categories.length - 1].source.displayName.toString();
        }
        // ...
    }
    // ...
}
Δημιουργία συνάρτησης treeWalker για τη διέλευση της ιεραρχίας:
export class Visual implements IVisual {
    // ...
    public update(options: VisualUpdateOptions) {
        // ...

        // if the visual doesn't receive the data no reason to continue rendering
        if (!matrixDataView ||
            !matrixDataView.columns ||
            !matrixDataView.rows ) {
            return
        }

        const treeWalker = (matrixNode: DataViewMatrixNode, index: number, levels: DataViewHierarchyLevel[], div: HTMLDivElement)  => {
            // ...
            if (matrixNode.children) {
                // ...
                // traversing child nodes
                matrixNode.children.forEach((node, index) => treeWalker(node, index, levels, childDiv));
            }
        }

        // traversing rows
        const rowRoot: DataViewMatrixNode = matrixDataView.rows.root;
        rowRoot.children.forEach((node, index) => treeWalker(node, index, matrixDataView.rows.levels, this.rowsDiv));

        // traversing columns
        const colRoot = matrixDataView.columns.root;
        colRoot.children.forEach((node, index) => treeWalker(node, index, matrixDataView.columns.levels, this.colsDiv));
    }
    // ...
}
Δημιουργήστε τις επιλογές για σημεία δεδομένων.
const treeWalker = (matrixNode: DataViewMatrixNode, index: number, levels: DataViewHierarchyLevel[], div: HTMLDivElement)  => {
    // generate selectionID for each node of matrix
    const selectionID: ISelectionID = this.host.createSelectionIdBuilder()
        .withMatrixNode(matrixNode, levels)
        .createSelectionId();
    // ...
    if (matrixNode.children) {
        // ...
        // traversing child nodes
        matrixNode.children.forEach((node, index) => treeWalker(node, index, levels, childDiv));
    }
}
Δημιουργία div για κάθε επίπεδο ιεραρχίας:
const treeWalker = (matrixNode: DataViewMatrixNode, index: number, levels: DataViewHierarchyLevel[], div: HTMLDivElement)  => {
    // generate selectionID for each node of matrix
    const selectionID: ISelectionID = this.host.createSelectionIdBuilder()
        .withMatrixNode(matrixNode, levels)
        .createSelectionId();
    // ...
    if (matrixNode.children) {
        // create div element for level
        const childDiv = document.createElement("div");
        // add to current div
        div.appendChild(childDiv);
        // create paragraph element to display next
        const p = document.createElement("p");
        // display level name on paragraph element
        const level = levels[matrixNode.level];
        p.innerText = level.sources[level.sources.length - 1].displayName;
        // add paragraph element to created child div
        childDiv.appendChild(p);
        // traversing child nodes
        matrixNode.children.forEach((node, index) => treeWalker(node, index, levels, childDiv));
    }
}
Δημιουργήστε το buttons για να αλληλεπιδράσετε με την απεικόνιση και να εμφανίσετε το μενού περιβάλλοντος για σημεία δεδομένων μήτρας:
const treeWalker = (matrixNode: DataViewMatrixNode, index: number, levels: DataViewHierarchyLevel[], div: HTMLDivElement)  => {
    // generate selectionID for each node of matrix
    const selectionID: ISelectionID = this.host.createSelectionIdBuilder()
        .withMatrixNode(matrixNode, levels)
        .createSelectionId();

    // create button element
    let button = document.createElement("button");
    // display node value/name of the button's text
    button.innerText = matrixNode.value.toString();

    // add event listener on click
    button.addEventListener("click", (event) => {
        // call select method in the selection manager
        this.selectionManager.select(selectionID);
    });

    // display context menu on click
    button.addEventListener("contextmenu", (event) => {
        // call showContextMenu method to display context menu on the visual
        this.selectionManager.showContextMenu(selectionID, {
            x: event.clientX,
            y: event.clientY
        });
        event.preventDefault();
    });

    div.appendChild(button);

    if (matrixNode.children) {
        // ...
    }
}
Καταργήστε div τα στοιχεία πριν την απόδοση των στοιχείων ξανά:
public update(options: VisualUpdateOptions) {
    // ...
    const treeWalker = (matrixNode: DataViewMatrixNode, index: number, levels: DataViewHierarchyLevel[], div: HTMLDivElement)  => {
        // ...
    }

    // remove old elements
    // to better performance use D3js pattern:
    // https://d3js.org/#enter-exit
    while (this.rowsDiv.firstChild) {
        this.rowsDiv.removeChild(this.rowsDiv.firstChild);
    }
    // create label for row elements
    const prow = document.createElement("p");
    prow.innerText = "Rows";
    this.rowsDiv.appendChild(prow);

    while (this.colsDiv.firstChild) {
        this.colsDiv.removeChild(this.colsDiv.firstChild);
    }
    // create label for columns elements
    const pcol = document.createElement("p");
    pcol.innerText = "Columns";
    this.colsDiv.appendChild(pcol);

    // render elements for rows
    const rowRoot: DataViewMatrixNode = matrixDataView.rows.root;
    rowRoot.children.forEach((node, index) => treeWalker(node, index, matrixDataView.rows.levels, this.rowsDiv));

    // render elements for columns
    const colRoot = matrixDataView.columns.root;
    colRoot.children.forEach((node, index) => treeWalker(node, index, matrixDataView.columns.levels, this.colsDiv));
}
Τέλος, θα πρέπει να λάβετε μια απεικόνιση με μενού περιβάλλοντος:
Σχετικό περιεχόμενο
Σχόλια
Σύντομα διαθέσιμα: Καθ' όλη τη διάρκεια του 2024 θα καταργήσουμε σταδιακά τα ζητήματα GitHub ως μηχανισμό ανάδρασης για το περιεχόμενο και θα το αντικαταστήσουμε με ένα νέο σύστημα ανάδρασης. Για περισσότερες πληροφορίες, ανατρέξτε στο θέμα: https://aka.ms/ContentUserFeedback.
Υποβολή και προβολή σχολίων για