Sample code for DevTools
Use the Demos repo to learn how to use Microsoft Edge to develop webpages and web apps. There are various ways to view, download, and modify these demo webpages, including:
- DevTools in Microsoft Edge.
- Visual Studio Code, with optional DevTools.
- Visual Studio, with optional DevTools.
To view the source code for a rendered demo webpage in DevTools in Microsoft Edge:
In a Readme page, click the Demo link. The live page opens in Microsoft Edge.
Right-click the demo webpage, and then select Inspect to open DevTools.
List of DevTools samples
The following demos demonstrate DevTools features.
A few of these samples are shown below.
To Do demo
This simple To Do list webpage is used to demonstrate various DevTools features. It has an .html file, a .js file, and .css files:
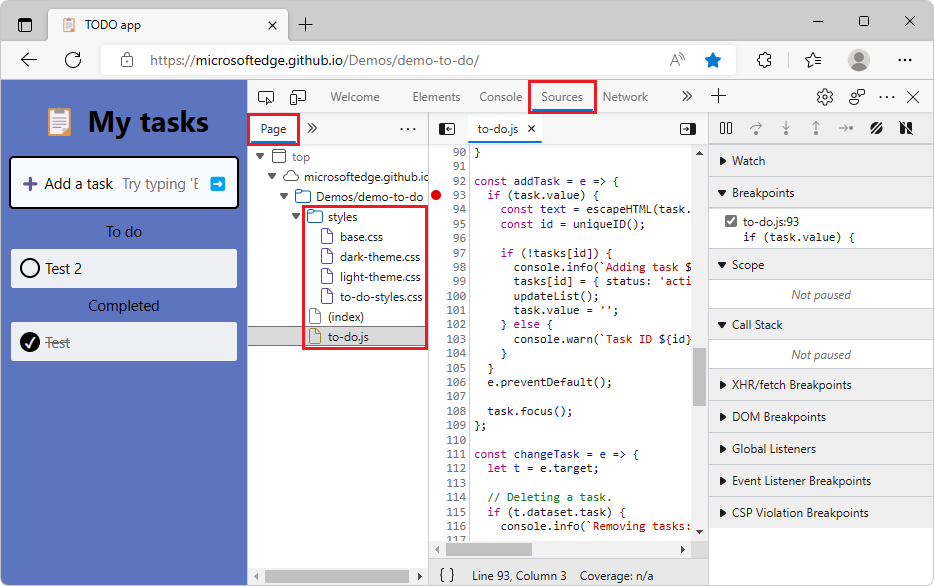
Rendered page: TODO app
Source code: demo-to-do
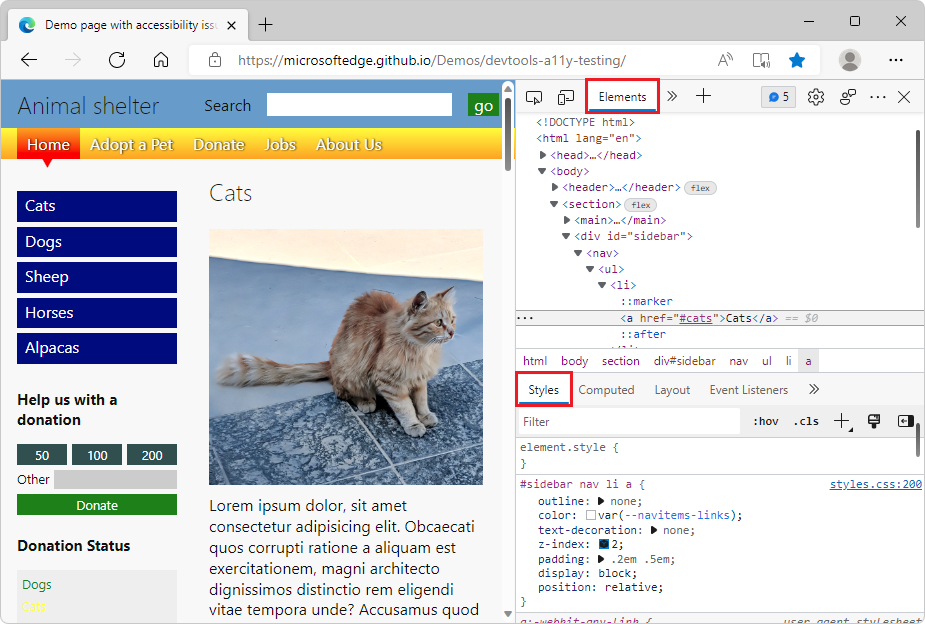
Demo webpage with accessibility issues
This Animal Shelter demo webpage is useful for exploring various DevTools features, including accessibility testing features.
Open the Demo webpage with accessibility issues in a new window or tab.
Right-click anywhere in the rendered webpage and then select Inspect. DevTools opens next to the demo webpage.
Articles
These articles walk you through using this demo webpage:
Use the Inspect tool to detect accessibility issues by hovering over the webpage - One of several short articles that are derived from sections of the above article.
Accessibility-testing features - A list of accessibility testing features of DevTools, with links to several articles that use the "Demo webpage with accessibility issues".
Source code repo
This is the source code repo and its directory which stores the files for this demo webpage:
MicrosoftEdge/Demos > devtools-a11y-testing - Contains files including:
index.html- The demo webpage, including page sections and input forms that send data to thebuttons.jsJavaScript file. To view the rendered webpage, use the demo webpage link above.buttons.js- Contains the JavaScript code that's used by the demo webpage.styles.css,light-theme.css, anddark-theme.css- CSS files that control the presentation of the demo webpage.Image files that are used in the demo webpage.
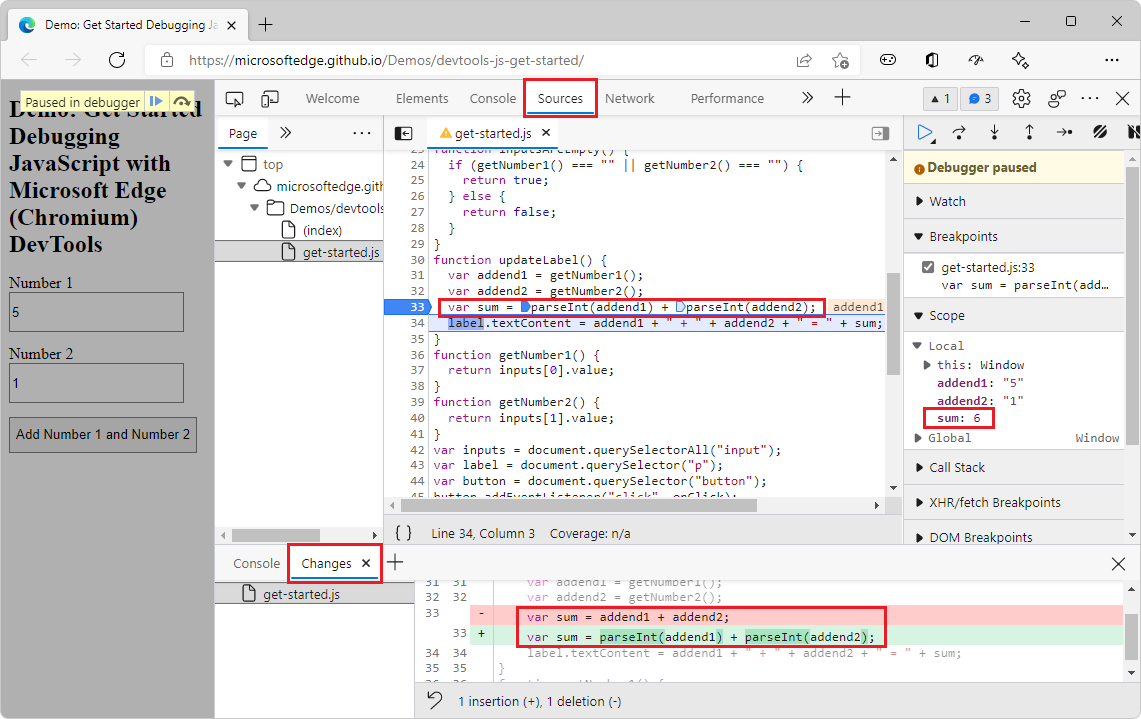
Demo webpage: Debugging JavaScript with DevTools
This demo webpage is useful for exploring the Sources tool, especially the JavaScript debugger.
Open the demo webpage Get started Debugging JavaScript with DevTools in a new window or tab.
Right-click anywhere in the rendered webpage and then select Inspect. DevTools opens next to the demo webpage.
Articles
These articles or article sections walk you through using this demo webpage:
The basic approach to using a debugger in Sources tool overview. This article section briefly walks you through the steps to use the JavaScript debugger in the Sources tool, to find the bug in the demo webpage. To fix the bug, you convert the input strings to numbers before adding them.
Get started debugging JavaScript - A more in-depth walkthrough of using the demo webpage along with the debugger, demonstrating various features of the debugger, and setting different kinds of breakpoints.
Source code repo
This is the source code repo and its directory which stores the files for this demo webpage:
MicrosoftEdge/Demos > devtools-js-get-started - Contains the files:
README.md- Contains links to the rendered demo webpage and the in-depth tutorial article about using the demo webpage.index.html- The webpage with an input form that sends data to the JavaScript file, and that displays the result of the JavaScript.get-started.js- The JavaScript file that's used by the form in the demo webpage.
Download or clone the Demos repo
The Demos repo is useful for following the various DevTools documentation.
Download the Demos repo
To download the Demos repo:
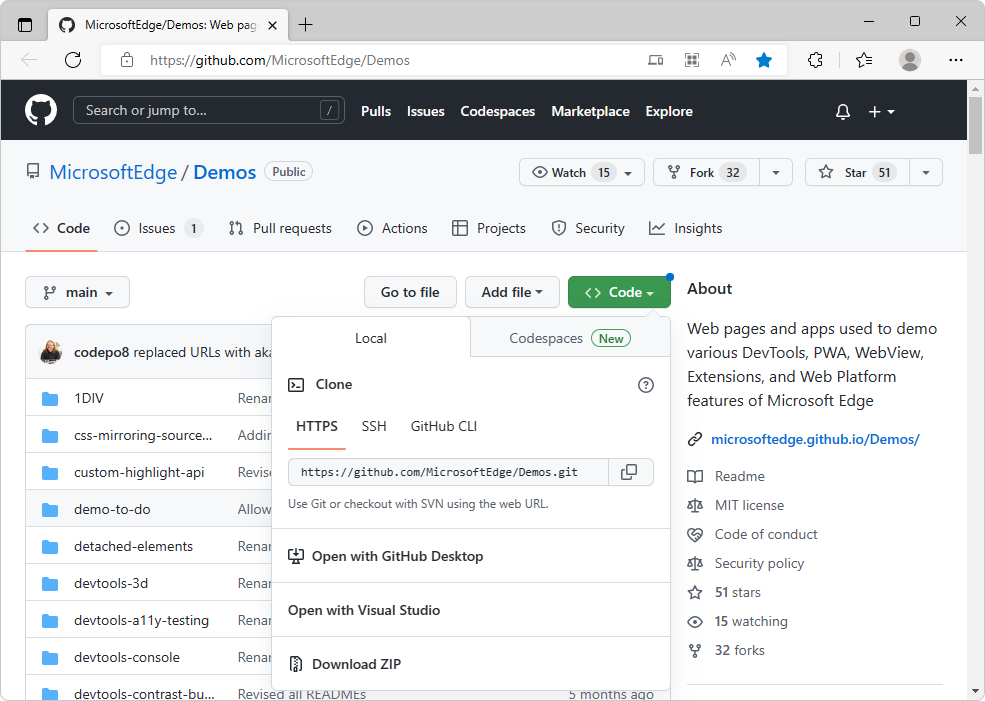
In a new window or tab, go to the MicrosoftEdge / Demos repo.
Click the Code dropdown button, and then click Download ZIP.
The
.zipfile is placed in your download directory. Unzip these webpage source files into a suitable location.
To download a single directory of the Demos repo:
Go to https://download-directory.github.io/ and then paste the URL https://github.com/MicrosoftEdge/Demos/tree/main/demo-to-do.
The
.zipfile is placed in your download directory. Unzip these webpage source files into a suitable location.
See also:
- Download the WebView2Samples repo in Set up your Dev environment for WebView2.
Clone the Demos repo
Cloning a repo enables updating your local copy when the repo is updated. The GitHub UI and various tools support cloning. We'll show cloning by using Visual Studio Code, but you can use many other coding tools, such as GitHub Desktop, Visual Studio, or git bash shell.
To clone the repo:
In a new window or tab, go to the MicrosoftEdge / Demos repo.
If the green Code button isn't shown, click Demos in the path Microsoft Edge / Demos in the upper left to go to the main page of the repo.
Click the Code dropdown button, and then click the Copy button next to the URL https://github.com/MicrosoftEdge/Demos.git. You can then paste the URL into git bash or a Visual Studio Code dialog, for example.
Or, click the Code dropdown button, and then click Open with Visual Studio if it appears. A list of Handler Selector items is offered, one per Visual Studio instance installed. This option appears only if you're logged in.
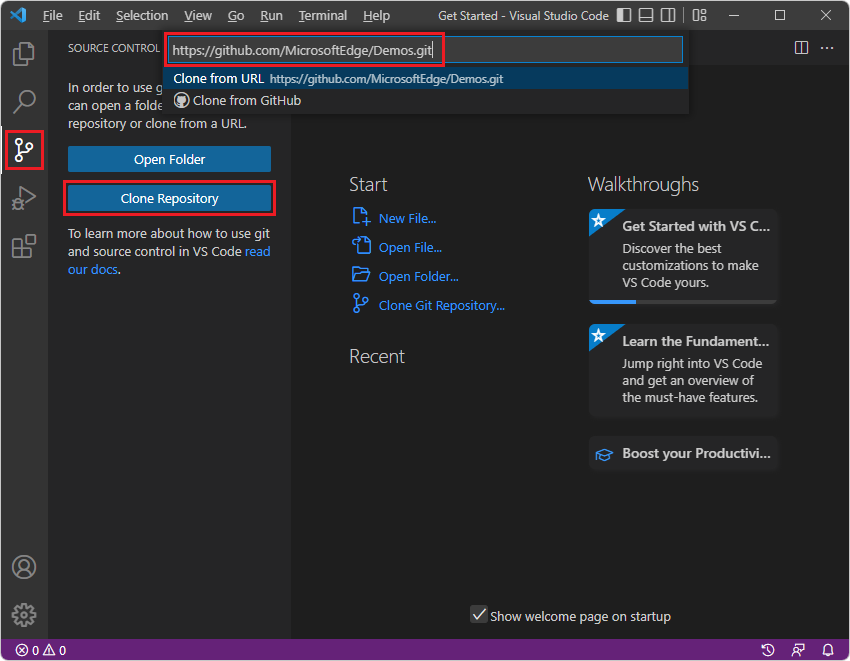
In Visual Studio Code, in the Activity Bar, click the Source Control (
 ) button, and then click the Clone Repository button.
In the Provide repository URL text box, paste the copied URL: https://github.com/MicrosoftEdge/Demos.git and then press Enter. A folder selection dialog opens.
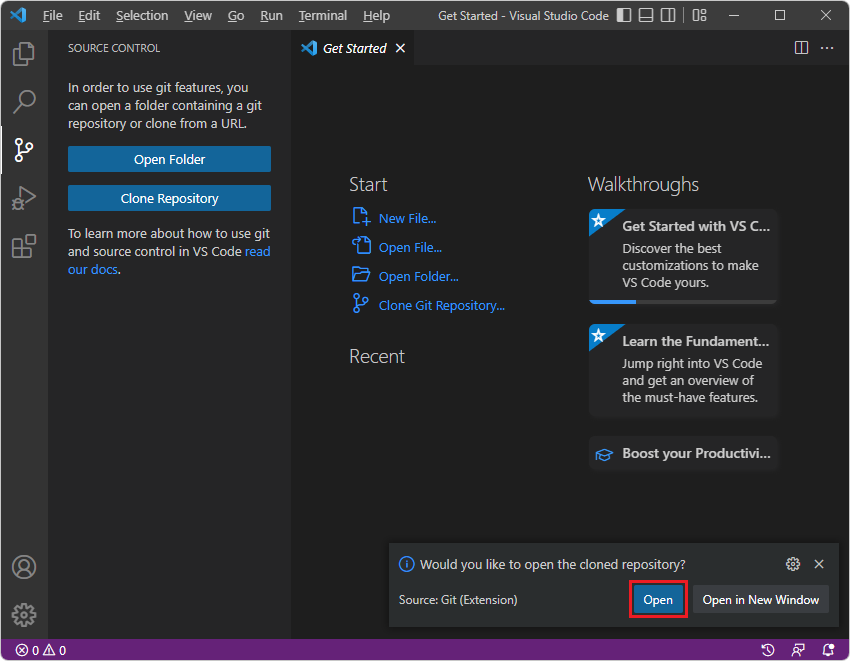
Navigate to your desired path, such as
C:\Users\username\Documents\GitHuborUsers/username/GitHub, and then click the Select Repository Location button.The message Cloning git repository appears, then you're prompted to open the cloned repository. Click the Open button:
If prompted Do you trust..., click the Yes button. Or, click the No button and continue with most parts of this walkthrough.
The Explorer tree lists many demos, including demo-to-do.
See also:
- Cloning a repository - GitHub docs.
- Clone the WebView2Samples repo in Set up your Dev environment for WebView2.
Open a demo folder in the Sources tool and edit a file
To use this section, first Download or clone the Demos repo.
To edit local files in the Sources tool, you might need to first click the Allow button to grant read/write access. To do that, follow the steps in Opening a folder from the Filesystem (Workspace) tab in the Sources tool below.
See also:
- Approaches compared in Microsoft Edge DevTools extension for Visual Studio Code. Summarizes and compares several options for editing webpage files.
Opening a folder from the Filesystem (Workspace) tab in the Sources tool
After downloading or cloning the Demos repo:
In Microsoft Edge, open a new tab.
Right-click the webpage, and then select Inspect. Or, press Ctrl+Shift+I (Windows, Linux) or Command+Option+I (macOS). DevTools opens.
In DevTools, on the main toolbar, select the Sources tab. If that tab isn't visible, click the More tabs (
 ) button.
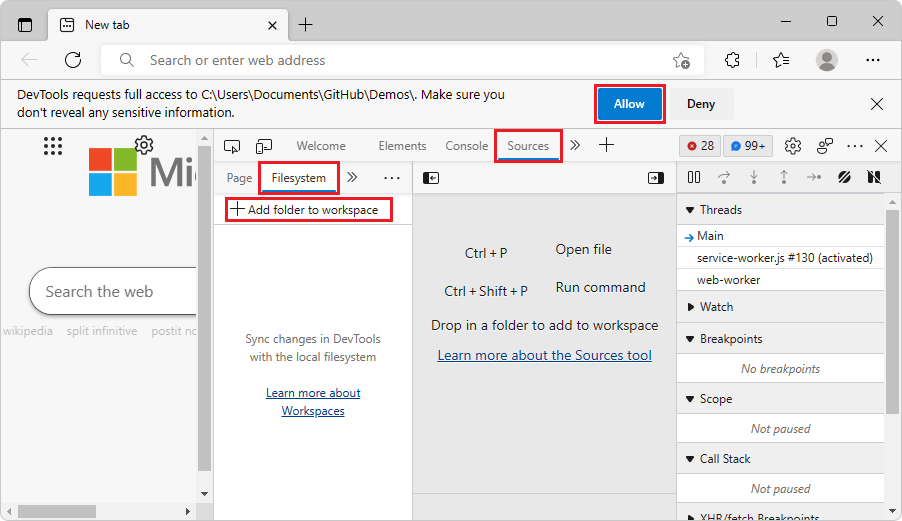
In the Sources tab, on the left, select the Filesystem tab, which is grouped with the Page tab. If the Filesystem tab isn't displayed, click the More tabs (
) button.Click + Add folder to workspace. A folder selection dialog opens.
Select a specific folder, such as demo-to-do, or select the Demos root folder:
Above DevTools, your're prompted "DevTools requests full access to (directory)". Click the Allow button:
To edit the files, see the editing steps in the next section.
See also:
- Edit files with Workspaces (Filesystem tab) - to open a local folder in the Sources tool of DevTools in the browser.
- Using the Filesystem tab to define a local Workspace in Sources tool overview.
Opening a local HTML file from the browser's File Open dialog and editing it from the Page tab of the Sources tool
To edit files in the Sources tool, before doing the steps in this section, you might need to click the Allow button to grant read/write access by following the steps in Opening a folder from the Filesystem (Workspace) tab in the Sources tool above.
To open an .html file and edit it:
In Microsoft Edge, open a new tab, and then press Ctrl+O (Windows/Linux) or Command+O (macOS). A file selection dialog opens.
Select an HTML file from the local copy of the Demos repo, such as
C:\Users\username\Documents\GitHub\Demos\demo-to-do\index.html. The.htmlfile is opened and rendered in Microsoft Edge.Right-click the webpage, and then select Inspect. Or, press Ctrl+Shift+I (Windows, Linux) or Command+Option+I (macOS). DevTools opens.
In DevTools, on the main toolbar, select the Sources tab. If that tab isn't visible, click the More tabs (
) button.In DevTools, on the left, select the Page tab, and then select the HTML file, such as
index.htmlor (index).Press Esc to open the Drawer at the bottom of DevTools.
In the Drawer, click the More Tools (
 ) button, and then select the Changes tool.
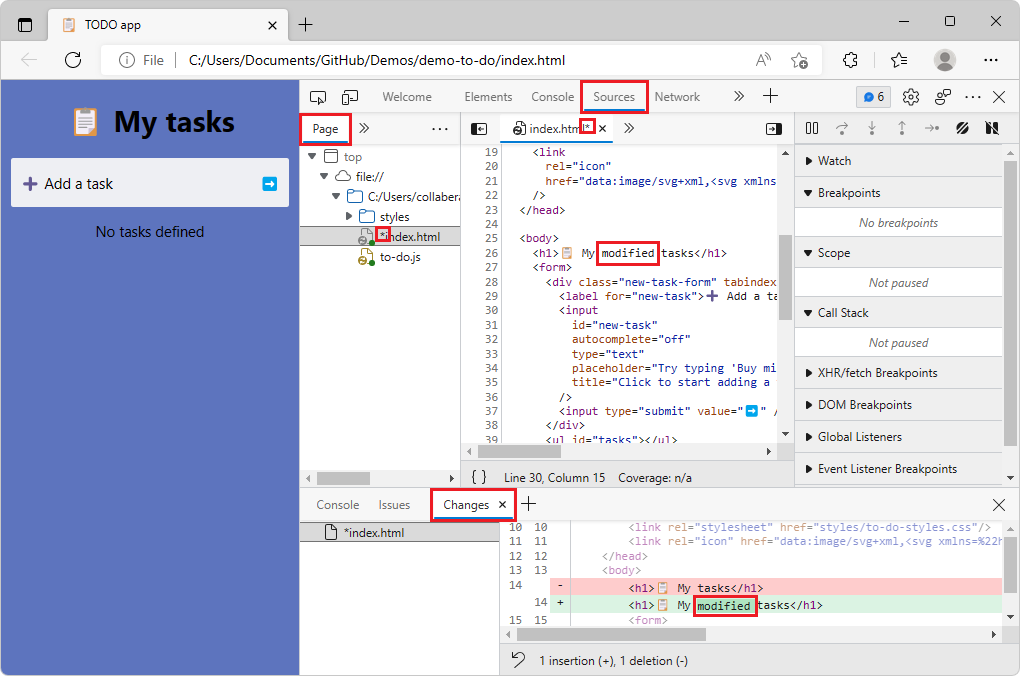
In the middle, editor pane of the Sources tool, edit the
.htmlfile. For example, indemo-to-do/index.htmlfolder, in the<h1>heading line, change My tasks to My modified tasks:<h1>📋 My modified tasks</h1>If editing isn't enabled, click the Allow button to grant read/write access to the folder by doing the steps in Opening a folder from the Filesystem (Workspace) tab in the Sources tool above.
The change is displayed in the Changes tool in the Drawer, and an asterisk is added to the file name in the index.html tab in the Sources tool:
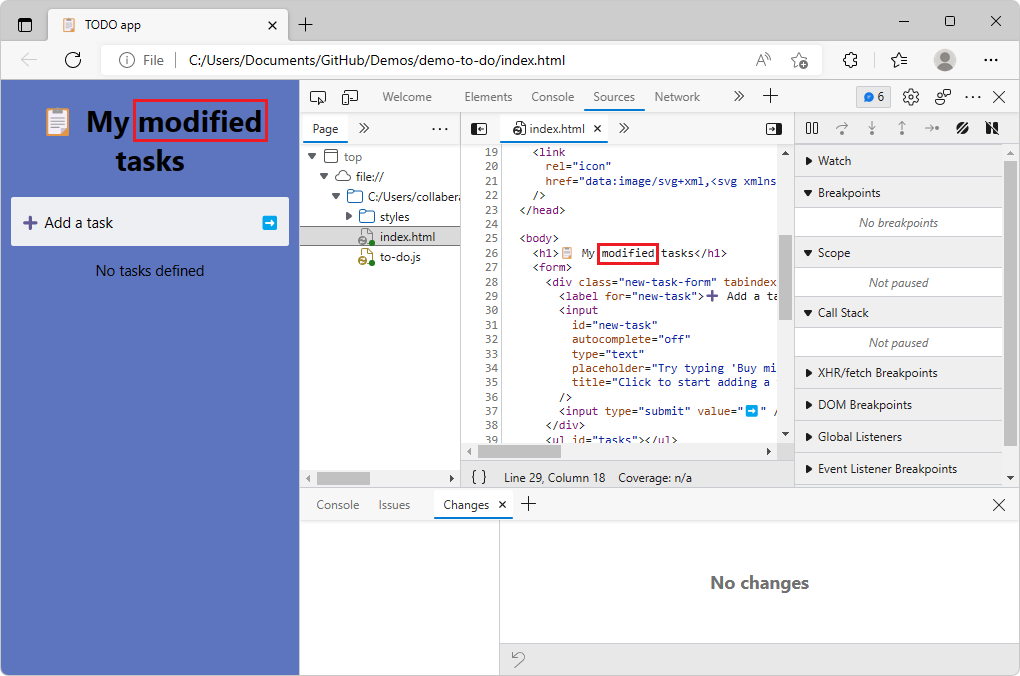
Press Ctrl+S (Windows, Linux) or Command+S (macOS) to save the change. The asterisk is removed from the index.html tab in the Sources tool.
Refresh the page. The change is displayed in the rendered webpage; for example, the word modified is added to the title:
Opening a local HTML file from File Explorer and editing it in the browser
In File Explorer on Windows, or Finder on macOS, select an HTML file from the local copy of the Demos repo, such as
C:\Users\username\Documents\GitHub\Demos\demo-to-do\index.html. The.htmlfile is opened and rendered in Microsoft Edge.Follow the steps in the sections above.
Open a demo folder in Visual Studio Code
After downloading or cloning the Demos repo:
In Visual Studio Code, in the Activity Bar, click the Explorer (
 ) button. The Explorer pane opens.
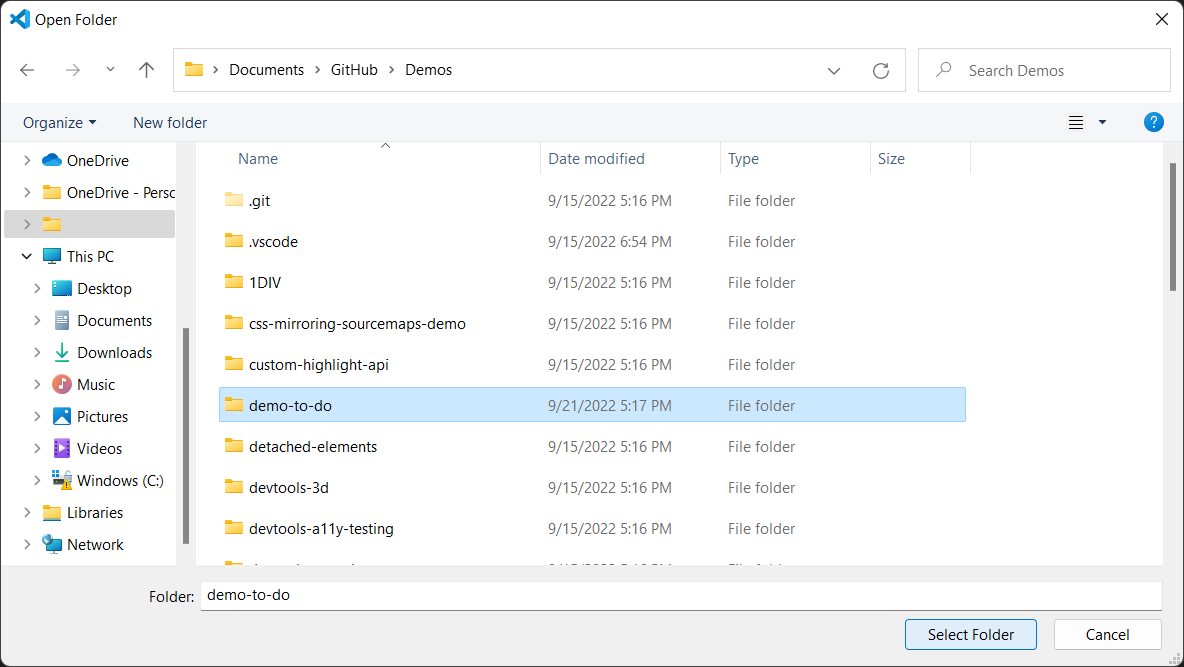
In the Explorer pane, click the Open Folder button. The Open Folder dialog opens. Navigate to the
demo-to-dofolder in the Demo repo that you cloned, select the folder or go into it, and then click the Select Folder button:An example of a repo location where the Demos repo has been cloned is shown above. The
demo-to-dofolder of the cloned Demos repo opens in the Explorer of Visual Studio Code: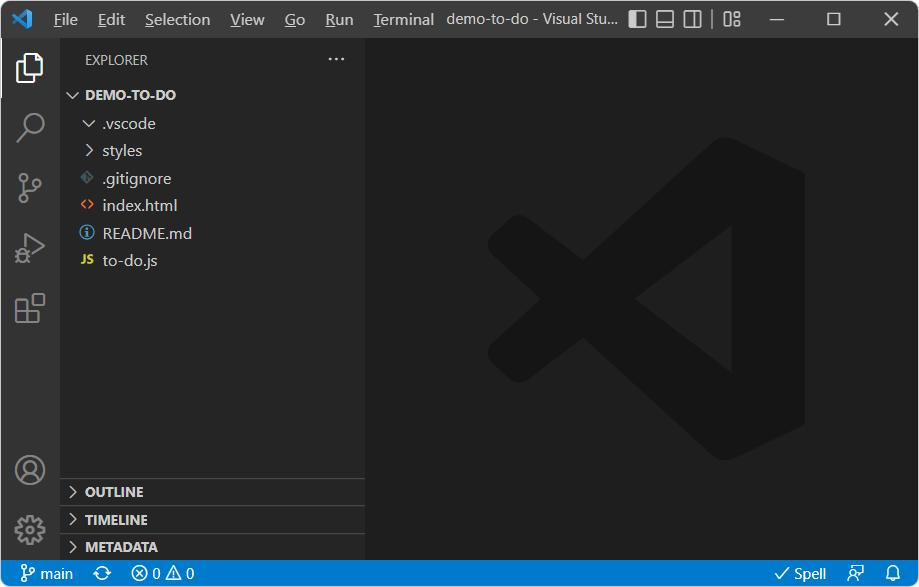
Or, you can open the root folder of the Demos repo, to explore all of the demo folders in the Explorer pane.
See also:
- Microsoft Edge DevTools extension for Visual Studio Code - to open a local folder in Visual Studio Code and use DevTools within Visual Studio Code.
URL patterns for rendered demo webpages and source code
Most of the Readme files in the Demos repo have a link that opens the rendered .html file from the GitHub.io server. Sometimes you have a URL for an HTML source file at GitHub.com, but instead you need to derive the github.io server URL to display the rendered file, rather than displaying the code listing of the .html source code in the GitHub directory.
To convert from the URL for the source code directory at GitHub.com to the URL for a rendered demo webpage at GitHub.io, the pattern is as follows.
Suppose the URL for the webpage's source code at GitHub.com is:
https://github.com/MicrosoftEdge/Demos/tree/main/demo-to-do/
The key components of that GitHub.com URL are:
https://github.com/[org]/[repo]/tree/main/[path]
In contrast, the desired GitHub.io URL pattern is:
https://[org].github.io/[repo]/[path]
To fill in that GitHub.io URL pattern, in this example:
- [org] is
MicrosoftEdge. - [repo] is
Demos. - [path] is
demo-to-do.
Therefore, the resulting GitHub.io server URL for the rendered demo webpage is:
https://MicrosoftEdge.github.io/Demos/demo-to-do/
These URLs aren't case-sensitive.
See also
Opening and editing files:
- Edit files with Workspaces (Filesystem tab) - to open a local folder in the Sources tool of DevTools in the browser.
- Using the Filesystem tab to define a local Workspace in Sources tool overview.
- Approaches compared in Microsoft Edge DevTools extension for Visual Studio Code. Summarizes and compares several options for editing webpage files.
- Microsoft Edge IDE integration - Webpage app development using Visual Studio Code or Visual Studio, including Microsoft Edge DevTools.
Downloading and cloning:
- Step 5: Clone the Demos repo in Installing the DevTools extension for Visual Studio Code.
- Cloning a repository - GitHub docs.
Running a local web server:
- Step 6: Set up a localhost server in Installing the DevTools extension for Visual Studio Code.
Feedback
Coming soon: Throughout 2024 we will be phasing out GitHub Issues as the feedback mechanism for content and replacing it with a new feedback system. For more information see: https://aka.ms/ContentUserFeedback.
Submit and view feedback for