Show traffic data on the map in the iOS SDK (Preview)
Flow data and incidents data are the two types of traffic data that can be displayed on the map. This guide shows you how to display both types of traffic data. Incidents data consists of point and line-based data for things such as constructions, road closures, and accidents. Flow data shows metrics about the flow of traffic on the road.
Note
Azure Maps iOS SDK retirement
The Azure Maps Native SDK for iOS is now deprecated and will be retired on 3/31/25. To avoid service disruptions, migrate to the Azure Maps Web SDK by 3/31/25. For more information, see The Azure Maps iOS SDK migration guide.
Prerequisites
Complete the Create an iOS app quickstart. Code blocks from this quickstart can be inserted into the viewDidLoad function of ViewController.
Show traffic on the map
There are two types of traffic data available in Azure Maps:
Incident data - consists of point and line-based data for things such as construction, road closures, and accidents.
Flow data - provides metrics on the flow of traffic on the roads. Often, traffic flow data is used to color the roads. The colors are based on how much traffic is slowing down the flow, relative to the speed limit, or another metric. There are four values that can be passed into the traffic
flowoption of the map.Flow enum Description TrafficFlow.noneDoesn't display traffic data on the map TrafficFlow.relativeShows traffic data that's relative to the free-flow speed of the road TrafficFlow.relativeDelayDisplays areas that are slower than the average expected delay TrafficFlow.absoluteShows the absolute speed of all vehicles on the road
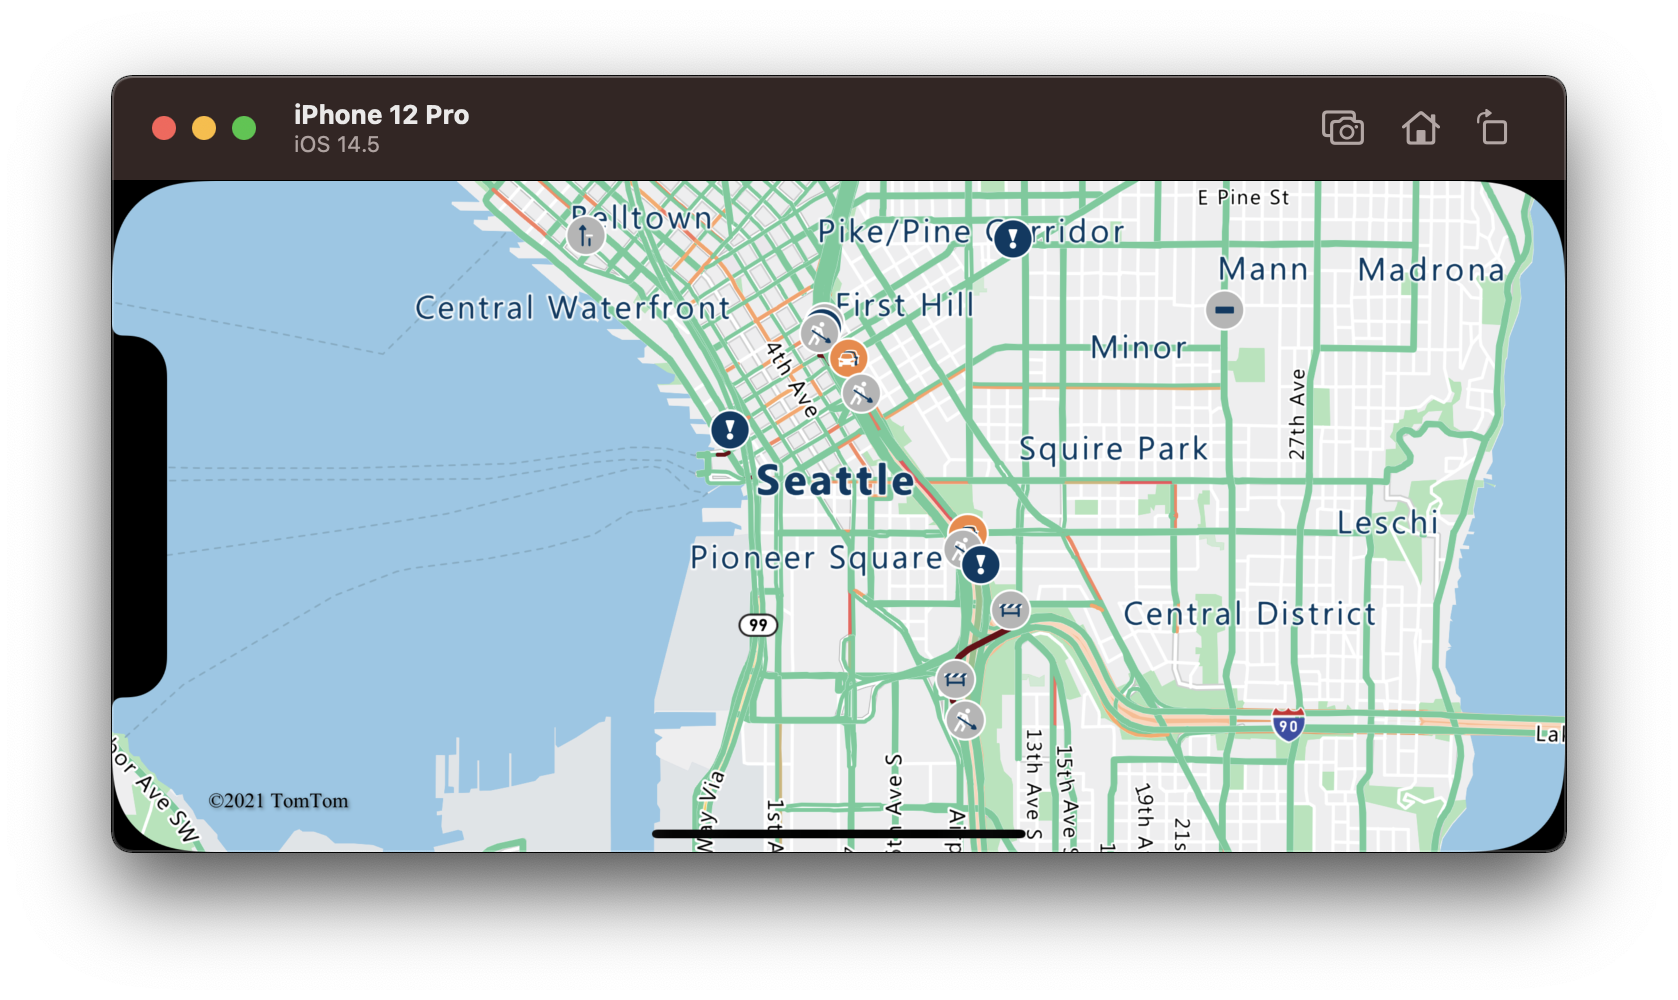
The following code shows how to display traffic data on the map.
// Show traffic on the map using the traffic options.
map.setTrafficOptions([
    .incidents(true),
    .flow(.relative)
])
The following screenshot shows the above code rendering real-time traffic information on the map.
Get traffic incident details
Details about a traffic incident are available within the properties of the feature used to display the incident on the map. Traffic incidents are added to the map using the Azure Maps traffic incident vector tile service. The format of the data in these vector tiles can be found in the Vector Incident Tiles article on the TomTom site. The following code adds a delegate to the map. This delegate handles a click event, retrieves the traffic incident feature that was selected and displays an alert with some of the details.
// Show traffic information on the map.
map.setTrafficOptions([
    .incidents(true),
    .flow(.relative)
])

// Add the delegate to handle taps on traffic incidents only.
map.events.addDelegate(self, for: [.trafficIncidentLayerId])
extension ShowDetailedTrafficViewController: AzureMapDelegate {
    func azureMap(_ map: AzureMap, didTapOn features: [Feature]) {
        guard let feature = features.first else {
            // No features provided.
            return
        }

        // Get the incident's type based on icon_category_[idx] property.
        let iconCategoryKeys = ["icon_category"] + (0...9).map { "icon_category_\($0)" }
        let title = iconCategoryKeys
            .compactMap { feature.properties[$0] as? Int }
            .last
            .map { IncidentCategory(categoryNumber: $0).description }

        // Get the incident's description based on description_[idx] property.
        let descriptionKeys = ["description"] + (0...9).map { "description_\($0)" }
        let message = descriptionKeys
            .compactMap { feature.properties[$0] as? String }
            .last
            .map { $0.capitalized }

        // Show an alert with the details.
        let alert = UIAlertController(title: title ?? "Traffic Incident", message: message, preferredStyle: .alert)
        alert.addAction(UIAlertAction(title: "OK", style: .default) { _ in
            alert.dismiss(animated: true)
        })
        present(alert, animated: true)
    }
}
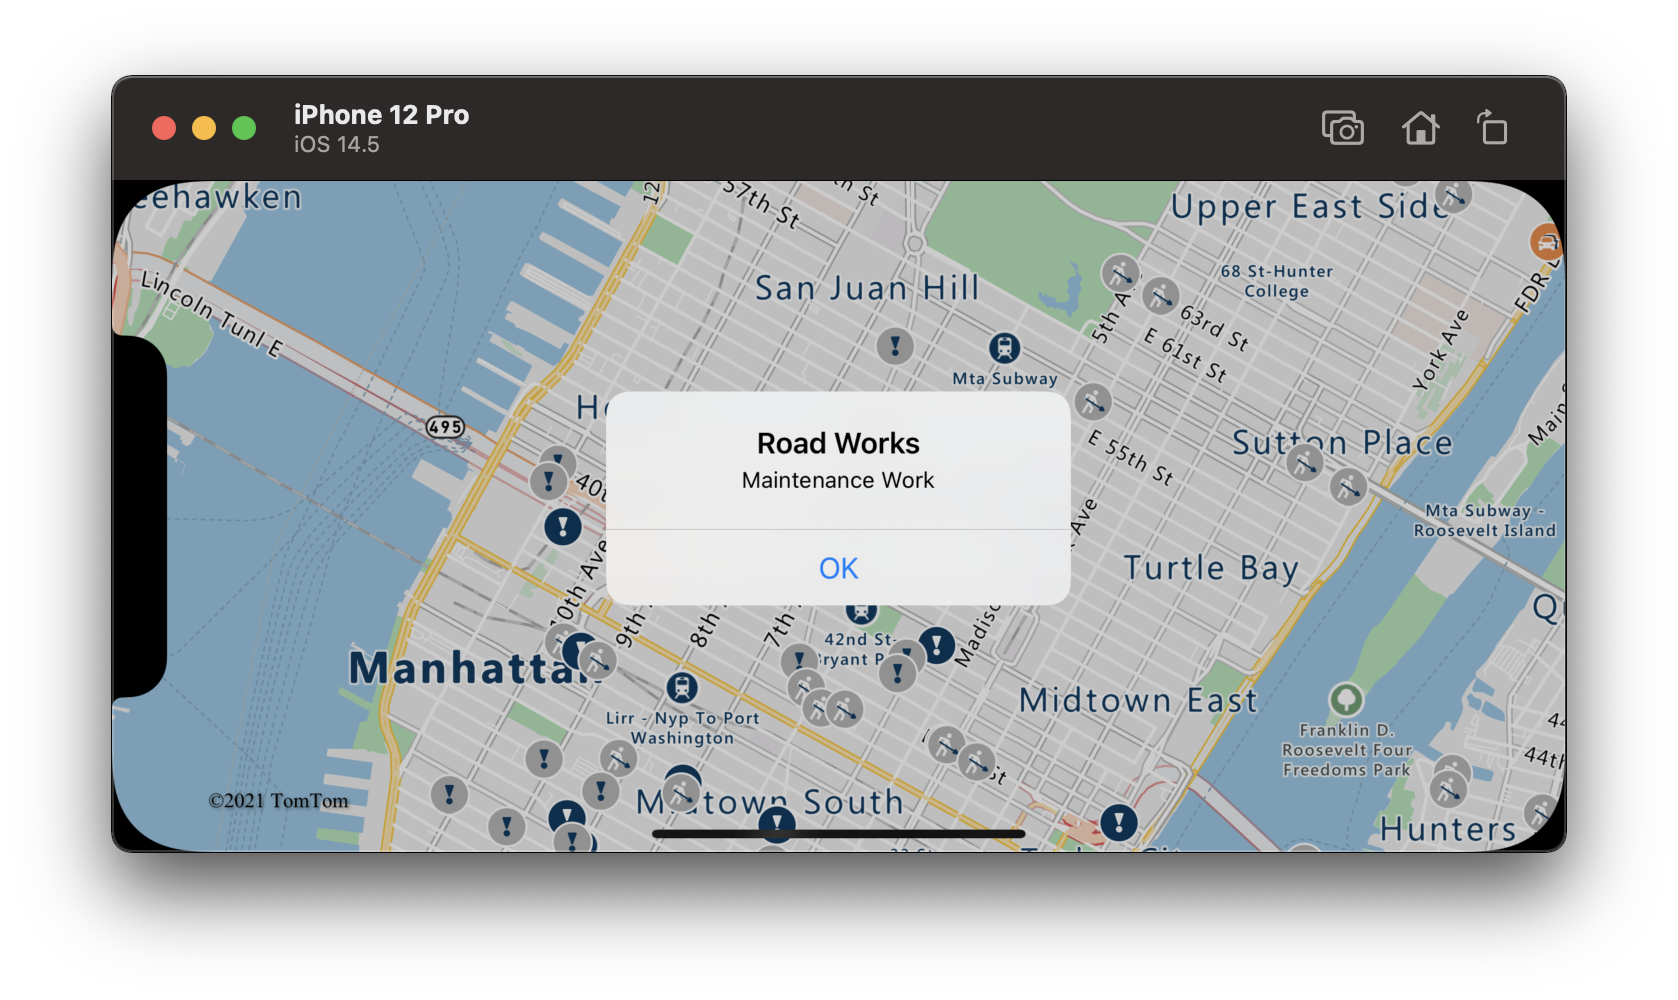
The following screenshot shows the above code rendering real-time traffic information on the map with an alert displaying the incident details.
Filter traffic incidents
On a typical day in most major cities, there can be an overwhelming number of traffic incidents, however, depending on your scenario, it may be desirable to filter and display a subset of these incidents. When setting traffic options, there are incidentCategoryFilter and incidentMagnitudeFilter options that take in an array of incident category or magnitude enumerators.
The following table shows all the traffic incident categories that can be used within the incidentCategoryFilter option.
| Category enum | Description |
|---|---|
IncidentCategory.unknown |
An incident that either doesn't fit any of the defined categories or hasn't yet been classified. |
IncidentCategory.accident |
Traffic accident. |
IncidentCategory.fog |
Fog that reduces visibility, likely reducing traffic flow, and possibly increasing the risk of an accident. |
IncidentCategory.dangerousConditions |
Dangerous situation on the road, such as an object on the road. |
IncidentCategory.rain |
Heavy rain that may be reducing visibility, making driving conditions difficult, and possibly increasing the risk of an accident. |
IncidentCategory.ice |
Icy road conditions that may make driving difficult or dangerous. |
IncidentCategory.jam |
Traffic jam resulting in slower moving traffic. |
IncidentCategory.laneClosed |
A road lane is closed. |
IncidentCategory.roadClosed |
A road is closed. |
IncidentCategory.roadWorks |
Road works/construction in this area. |
IncidentCategory.wind |
High winds that may make driving difficult for vehicles with a large side profile or high center of gravity. |
IncidentCategory.flooding |
Flooding occurring on road. |
IncidentCategory.detour |
Traffic being directed to take a detour. |
IncidentCategory.cluster |
A cluster of traffic incidents of different categories. Zooming in the map results in the cluster breaking apart into its individual incidents. |
The following table shows all the traffic incident magnitudes that can be used within the incidentMagnitudeFilter option.
| Magnitude enum | Description |
|---|---|
IncidentMagnitude.unknown |
An incident who's magnitude hasn't yet been classified. |
IncidentMagnitude.minor |
A minor traffic issue that is often just for information and has minimal impact to traffic flow. |
IncidentMagnitude.moderate |
A moderate traffic issue that has some impact on traffic flow. |
IncidentMagnitude.major |
A major traffic issue that has a significant impact to traffic flow. |
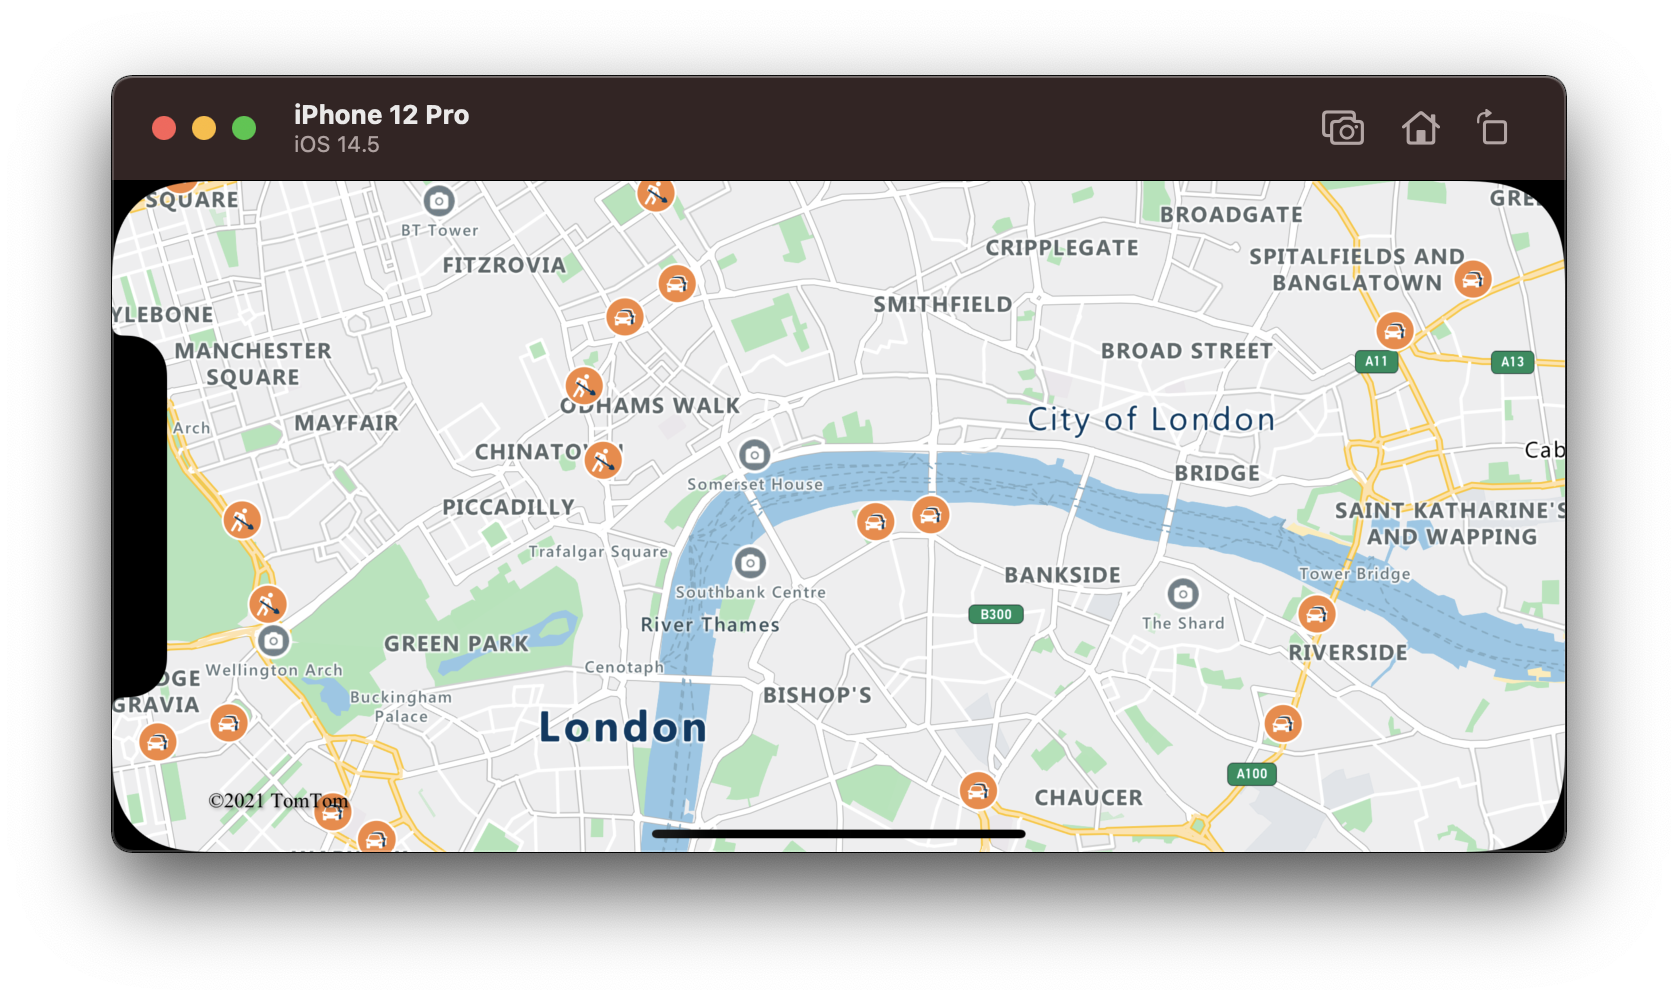
The following filters traffic incidents such that only moderate traffic jams and incidents with dangerous conditions are displayed on the map.
map.setTrafficOptions([
    .incidents(true),
    .incidentMagnitudeFilter([.moderate]),
    .incidentCategoryFilter([.jam, .dangerousConditions])
])
The following screenshot shows a map of moderate traffic jams and incidents with dangerous conditions.
Note
Some traffic incidents may have multiple categories assigned to them. If an incident has any category that matches any option passed into incidentCategoryFilter, it will be displayed. The primary incident category may be different from the categories specified in the filter and thus display a different icon.
Additional information
The following articles describe different ways to add data to your map:
Feedback
Coming soon: Throughout 2024 we will be phasing out GitHub Issues as the feedback mechanism for content and replacing it with a new feedback system. For more information see: https://aka.ms/ContentUserFeedback.
Submit and view feedback for