Manage an Azure Monitor workspace
This article shows you how to create and delete an Azure Monitor workspace. When you configure Azure Monitor managed service for Prometheus, you can select an existing Azure Monitor workspace or create a new one.
Note
When you create an Azure Monitor workspace, by default a data collection rule and a data collection endpoint in the form <azure-monitor-workspace-name> will automatically be created in a resource group in the form MA_<azure-monitor-workspace-name>_<location>_managed.
Create an Azure Monitor workspace
Open the Azure Monitor workspaces menu in the Azure portal.
Select Create.

On the Create an Azure Monitor Workspace page, select a Subscription and Resource group where the workspace should be created.
Provide a Name and a Region for the workspace.
Select Review + create to create the workspace.

When you create an Azure Monitor workspace, a new resource group is created. The resource group name has the following format: MA_<azure-monitor-workspace-name>_<location>_managed, where the tokenized elements are lowercased. The resource group contains both a data collection endpoint and a data collection rule with the same name as the workspace. The resource group and its resources are automatically deleted when you delete the workspace.
To connect your Azure Monitor managed service for Prometheus to your Azure Monitor workspace, see Collect Prometheus metrics from AKS cluster
Delete an Azure Monitor workspace
When you delete an Azure Monitor workspace, unlike with a Log Analytics workspace, there is no soft delete operation. The data in the workspace is immediately deleted, and there's no recovery option.
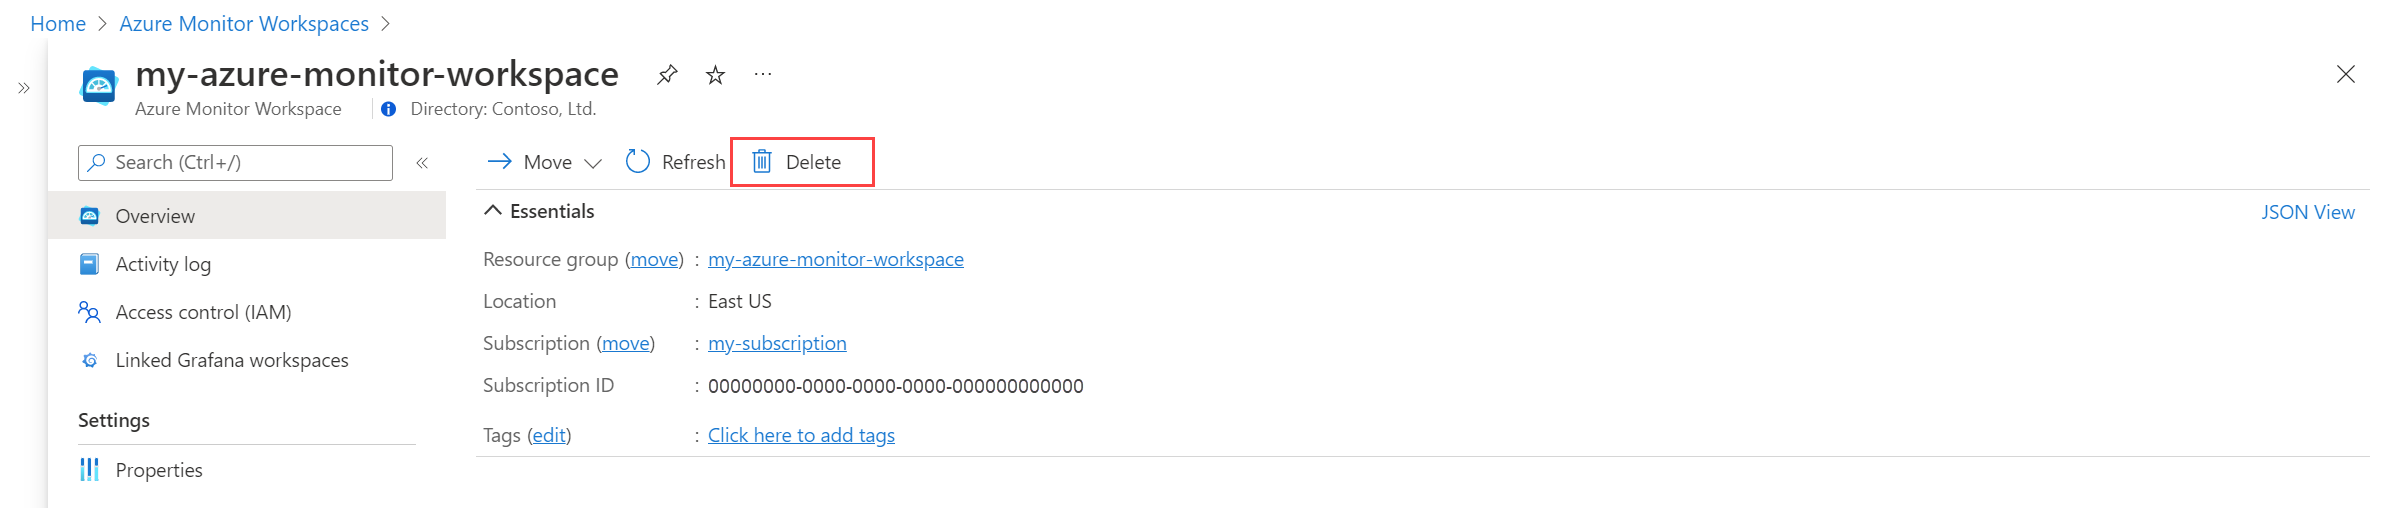
Open the Azure Monitor workspaces menu in the Azure portal.
Select your workspace.
Select Delete.

Link a Grafana workspace
Connect an Azure Monitor workspace to an Azure Managed Grafana workspace to allow Grafana to use the Azure Monitor workspace data in a Grafana dashboard. An Azure Monitor workspace can be connected to multiple Grafana workspaces, and a Grafana workspace can be connected to multiple Azure Monitor workspaces.
Note
When you add the Azure Monitor workspace as a data source to Grafana, it will be listed in form Managed_Prometheus_<azure-monitor-workspace-name>.
- Open the Azure Monitor workspace menu in the Azure portal.
- Select your workspace.
- Select Linked Grafana workspaces.
- Select a Grafana workspace.
If your Grafana instance is self managed, see Use Azure Monitor managed service for Prometheus as data source for self-managed Grafana using managed system identity
Frequently asked questions
This section provides answers to common questions.
Can I use Azure Managed Grafana in a different region than my Azure Monitor workspace and managed service for Prometheus?
Yes. When you use managed service for Prometheus, you can create your Azure Monitor workspace in any of the supported regions. Your Azure Kubernetes Service clusters can be in any region and send data into an Azure Monitor workspace in a different region. Azure Managed Grafana can also be in a different region than where you created your Azure Monitor workspace.
Next steps
- Learn more about the Azure Monitor data platform.
- Azure Monitor workspace Overview
Feedback
Coming soon: Throughout 2024 we will be phasing out GitHub Issues as the feedback mechanism for content and replacing it with a new feedback system. For more information see: https://aka.ms/ContentUserFeedback.
Submit and view feedback for