Log Analytics workspace data export in Azure Monitor
Data export in a Log Analytics workspace lets you continuously export data per selected tables in your workspace. You can export to an Azure Storage Account or Azure Event Hubs as the data arrives to an Azure Monitor pipeline. This article provides details on this feature and steps to configure data export in your workspaces.
Overview
Data in Log Analytics is available for the retention period defined in your workspace. It's used in various experiences provided in Azure Monitor and Azure services. There are cases where you need to use other tools:
- Tamper-protected store compliance: Data can't be altered in Log Analytics after it's ingested, but it can be purged. Export to a Storage Account set with immutability policies to keep data tamper protected.
- Integration with Azure services and other tools: Export to Event Hubs as data arrives and is processed in Azure Monitor.
- Long-term retention of audit and security data: Export to a Storage Account in the workspace's region. Or you can replicate data to other regions by using any of the Azure Storage redundancy options including GRS and GZRS.
After you've configured data export rules in a Log Analytics workspace, new data for tables in rules is exported from the Azure Monitor pipeline to your Storage Account or Event Hubs as it arrives. Data export traffic is in Azure backbone network and doesn't leave the Azure network.

Data is exported without a filter. For example, when you configure a data export rule for a SecurityEvent table, all data sent to the SecurityEvent table is exported starting from the configuration time. Alternatively, you can filter or modify exported data by configuring transformations in your workspace, which apply to incoming data, before it's sent to your Log Analytics workspaces and to export destinations.
Other export options
Log Analytics workspace data export continuously exports data that's sent to your Log Analytics workspace. There are other options to export data for particular scenarios:
- Configure diagnostic settings in Azure resources. Logs are sent to a destination directly. This approach has lower latency compared to data export in Log Analytics.
- Schedule export of data based on a log query you define with the Log Analytics query API. Use Azure Data Factory, Azure Functions, or Azure Logic Apps to orchestrate queries in your workspace and export data to a destination. This method is similar to the data export feature, but you can use it to export historical data from your workspace by using filters and aggregation. This method is subject to log query limits and isn't intended for scale. For more information, see Export data from a Log Analytics workspace to a Storage Account by using Logic Apps.
- One-time export to a local machine by using a PowerShell script. For more information, see Invoke-AzOperationalInsightsQueryExport.
Limitations
- Custom logs created using the HTTP Data Collector API can't be exported, including text-based logs consumed by Log Analytics agent. Custom logs created using data collection rules, including text-based logs, can be exported.
- Data export will gradually support more tables, but is currently limited to tables specified in the supported tables section. You can include tables that aren't yet supported in rules, but no data will be exported for them until the tables are supported.
- You can define up to 10 enabled rules in your workspace, each can include multiple tables. You can create more rules in workspace in disabled state.
- Destinations must be in the same region as the Log Analytics workspace.
- The Storage Account must be unique across rules in the workspace.
- Table names can be 60 characters long when you're exporting to a Storage Account. They can be 47 characters when you're exporting to Event Hubs. Tables with longer names won't be exported.
- Export to Premium Storage Account isn't supported.
Data completeness
Data export is optimized to move large data volume to your destinations. The export operation might fail if the destination doesn't have sufficient capacity or is unavailable. In the event of failure, the retry process continues for up to 12 hours. For more information about destination limits and recommended alerts, see Create or update a data export rule. If the destinations are still unavailable after the retry period, the data is discarded. In certain cases, retry can cause duplication of a fraction of the exported records.
Pricing model
Data export charges are based on the number of bytes exported to destinations in JSON formatted data, and measured in GB (10^9 bytes). Size calculation in workspace query can't correspond with export charges since doesn't include the JSON formatted data. You can use PowerShell to calculate the total billing size of a blob container.
For more information, including the data export billing timeline, see Azure Monitor pricing. Billing for Data Export was enabled in early October 2023.
Export destinations
The data export destination must be available before you create export rules in your workspace. Destinations don't have to be in the same subscription as your workspace. When you use Azure Lighthouse, it's also possible to send data to destinations in another Microsoft Entra tenant.
You need to have write permissions to both workspace and destination to configure a data export rule on any table in a workspace. The shared access policy for the Event Hubs namespace defines the permissions that the streaming mechanism has. Streaming to Event Hubs requires manage, send, and listen permissions. To update the export rule, you must have the ListKey permission on that Event Hubs authorization rule.
Storage Account
Avoid using existing Storage Account that has other non-monitoring data, to better control access to the data, prevent reaching storage ingress rate limit failures, and latency.
To send data to an immutable Storage Account, set the immutable policy for the Storage Account as described in Set and manage immutability policies for Azure Blob Storage. You must follow all steps in this article, including enabling protected append blobs writes.
The Storage Account can't be Premium, must be StorageV1 or later, and located in the same region as your workspace. If you need to replicate your data to other Storage Accounts in other regions, you can use any of the Azure Storage redundancy options, including GRS and GZRS.
Data is sent to Storage Accounts as it reaches Azure Monitor and exported to destinations located in a workspace region. A container is created for each table in the Storage Account with the name am- followed by the name of the table. For example, the table SecurityEvent would send to a container named am-SecurityEvent.
Blobs are stored in 5-minute folders in the following path structure: WorkspaceResourceId=/subscriptions/subscription-id/resourcegroups/<resource-group>/providers/microsoft.operationalinsights/workspaces/<workspace>/y=<four-digit numeric year>/m=<two-digit numeric month>/d=<two-digit numeric day>/h=<two-digit 24-hour clock hour>/m=<two-digit 60-minute clock minute>/PT05M.json. Appends to blobs are limited to 50-K writes. More blobs will be added in the folder as PT05M_#.json*, where '#' is the incremental blob count.
Note
Appends to blobs are written based on the "TimeGenerated" field and occur when receiving source data. Data arriving to Azure Monitor with delay, or retried following destinations throttling, is written to blobs according to its TimeGenerated.
The format of blobs in a Storage Account is in JSON lines, where each record is delimited by a new line, with no outer records array and no commas between JSON records.

Event Hubs
Avoid using existing Event Hub that has non-monitoring data to prevent reaching the Event Hubs namespace ingress rate limit failures, and latency.
Data is sent to your Event Hub as it reaches Azure Monitor and is exported to destinations located in a workspace region. You can create multiple export rules to the same Event Hubs namespace by providing a different Event Hub name in the rule. When an Event Hub name isn't provided, a default Event Hub is created for tables that you export with the name am- followed by the name of the table. For example, the table SecurityEvent would be sent to an Event Hub named am-SecurityEvent.
The number of supported Event Hubs in Basic and Standard namespace tiers is 10. When you're exporting more than 10 tables to these tiers, either split the tables between several export rules to different Event Hubs namespaces or provide an Event Hub name to export all tables to it.
Note
- The Basic Event Hubs namespace tier is limited. It supports lower event size and no Auto-inflate option to automatically scale up and increase the number of throughput units. Because data volume to your workspace increases over time and as a consequence Event Hub scaling is required, use Standard, Premium, or Dedicated Event Hubs tiers with the Auto-inflate feature enabled. For more information, see Automatically scale up Azure Event Hubs throughput units.
- Data export can't reach Event Hubs resources when virtual networks are enabled. You have to select the Allow Azure services on the trusted services list to access this Storage Account checkbox to bypass this firewall setting in an Event Hub to grant access to your Event Hubs.
Query exported data
Exporting data from workspaces to Storage Accounts help satisfy various scenarios mentioned in overview, and can be consumed by tools that can read blobs from Storage Accounts. The following methods let you query data using Log Analytics query language, which is the same for Azure Data Explorer.
- Use Azure Data Explorer to query data in Azure Data Lake.
- Use Azure Data Explorer to ingest data from a Storage Account.
- Use Log Analytics workspace to query ingested data using Logs Ingestion API . Ingested data is to a custom log table and not to the original table.
Enable data export
The following steps must be performed to enable Log Analytics data export. For more information on each, see the following sections:
- Register the resource provider
- Allow trusted Microsoft services
- Create or update a data export rule
Register the resource provider
The Azure resource provider Microsoft.Insights needs to be registered in your subscription to enable Log Analytics data export.
This resource provider is probably already registered for most Azure Monitor users. To verify, go to Subscriptions in the Azure portal. Select your subscription and then select Resource providers under the Settings section of the menu. Locate Microsoft.Insights. If its status is Registered, then it's already registered. If not, select Register to register it.
You can also use any of the available methods to register a resource provider as described in Azure resource providers and types. The following sample command uses the Azure CLI:
az provider register --namespace 'Microsoft.insights'
The following sample command uses PowerShell:
Register-AzResourceProvider -ProviderNamespace Microsoft.insights
Allow trusted Microsoft services
If you've configured your Storage Account to allow access from selected networks, you need to add an exception to allow Azure Monitor to write to the account. From Firewalls and virtual networks for your Storage Account, select Allow Azure services on the trusted services list to access this Storage Account.

Monitor destinations
Important
Export destinations have limits and should be monitored to minimize throttling, failures, and latency. For more information, see Storage Account scalability and Event Hubs namespace quotas.
The following metrics are available for data export operation and alerts
| Metric name | Description |
|---|---|
| Bytes Exported | Total number of bytes exported to destination from Log Analytics workspace within the selected time range. The size of data exported is the number of bytes in the exported JSON formatted data. 1 GB = 10^9 bytes. |
| Export Failures | Total number of failed export requests to destination from Log Analytics workspace within the selected time range. This number includes export attempts failures due to destination resource throttling, forbidden access error, or any server error. A retry process handles failed attempts and the number isn’t an indication for missing data. |
| Records exported | Total number of records exported from Log Analytics workspace within the selected time range. This number counts records for operations that ended with success. |
Monitor a Storage Account
Use a separate Storage Account for export.
Configure an alert on the metric:
Scope Metric namespace Metric Aggregation Threshold storage-name Account Ingress Sum 80% of maximum ingress per alert evaluation period. For example, the limit is 60 Gbps for general-purpose v2 in West US. The alert threshold is 1676 GiB per 5-minute evaluation period. Alert remediation actions:
- Use a separate Storage Account for export that isn't shared with non-monitoring data.
- Azure Storage Standard accounts support higher ingress limit by request. To request an increase, contact Azure Support.
- Split tables between more Storage Accounts.
Monitor Event Hubs
Configure alerts on the metrics:
Scope Metric namespace Metric Aggregation Threshold namespaces-name Event Hubs standard metrics Incoming bytes Sum 80% of maximum ingress per alert evaluation period. For example, the limit is 1 MB/s per unit (TU or PU) and five units used. The threshold is 228 MiB per 5-minute evaluation period. namespaces-name Event Hubs standard metrics Incoming requests Count 80% of maximum events per alert evaluation period. For example, the limit is 1,000/s per unit (TU or PU) and five units used. The threshold is 1,200,000 per 5-minute evaluation period. namespaces-name Event Hubs standard metrics Quota exceeded errors Count Between 1% of request. For example, requests per 5 minutes is 600,000. The threshold is 6,000 per 5-minute evaluation period. Alert remediation actions:
- Use a separate Event Hubs namespace for export that isn't shared with non-monitoring data.
- Configure the Auto-inflate feature to automatically scale up and increase the number of throughput units to meet usage needs.
- Verify the increase of throughput units to accommodate data volume.
- Split tables between more namespaces.
- Use Premium or Dedicated tiers for higher throughput.
Create or update a data export rule
A data export rule defines the destination and tables for which data is exported. The rule provisioning takes about 30 minutes before the export operation initiated. Data export rules considerations:
- The Storage Account must be unique across rules in the workspace.
- Multiple rules can use the same Event Hubs namespace when you're sending to separate Event Hubs.
- Export to a Storage Account: A separate container is created in the Storage Account for each table.
- Export to Event Hubs: If an Event Hub name isn't provided, a separate Event Hub is created for each table. The number of supported Event Hubs in Basic and Standard namespace tiers is 10. When you're exporting more than 10 tables to these tiers, either split the tables between several export rules to different Event Hubs namespaces or provide an Event Hub name in the rule to export all tables to it.
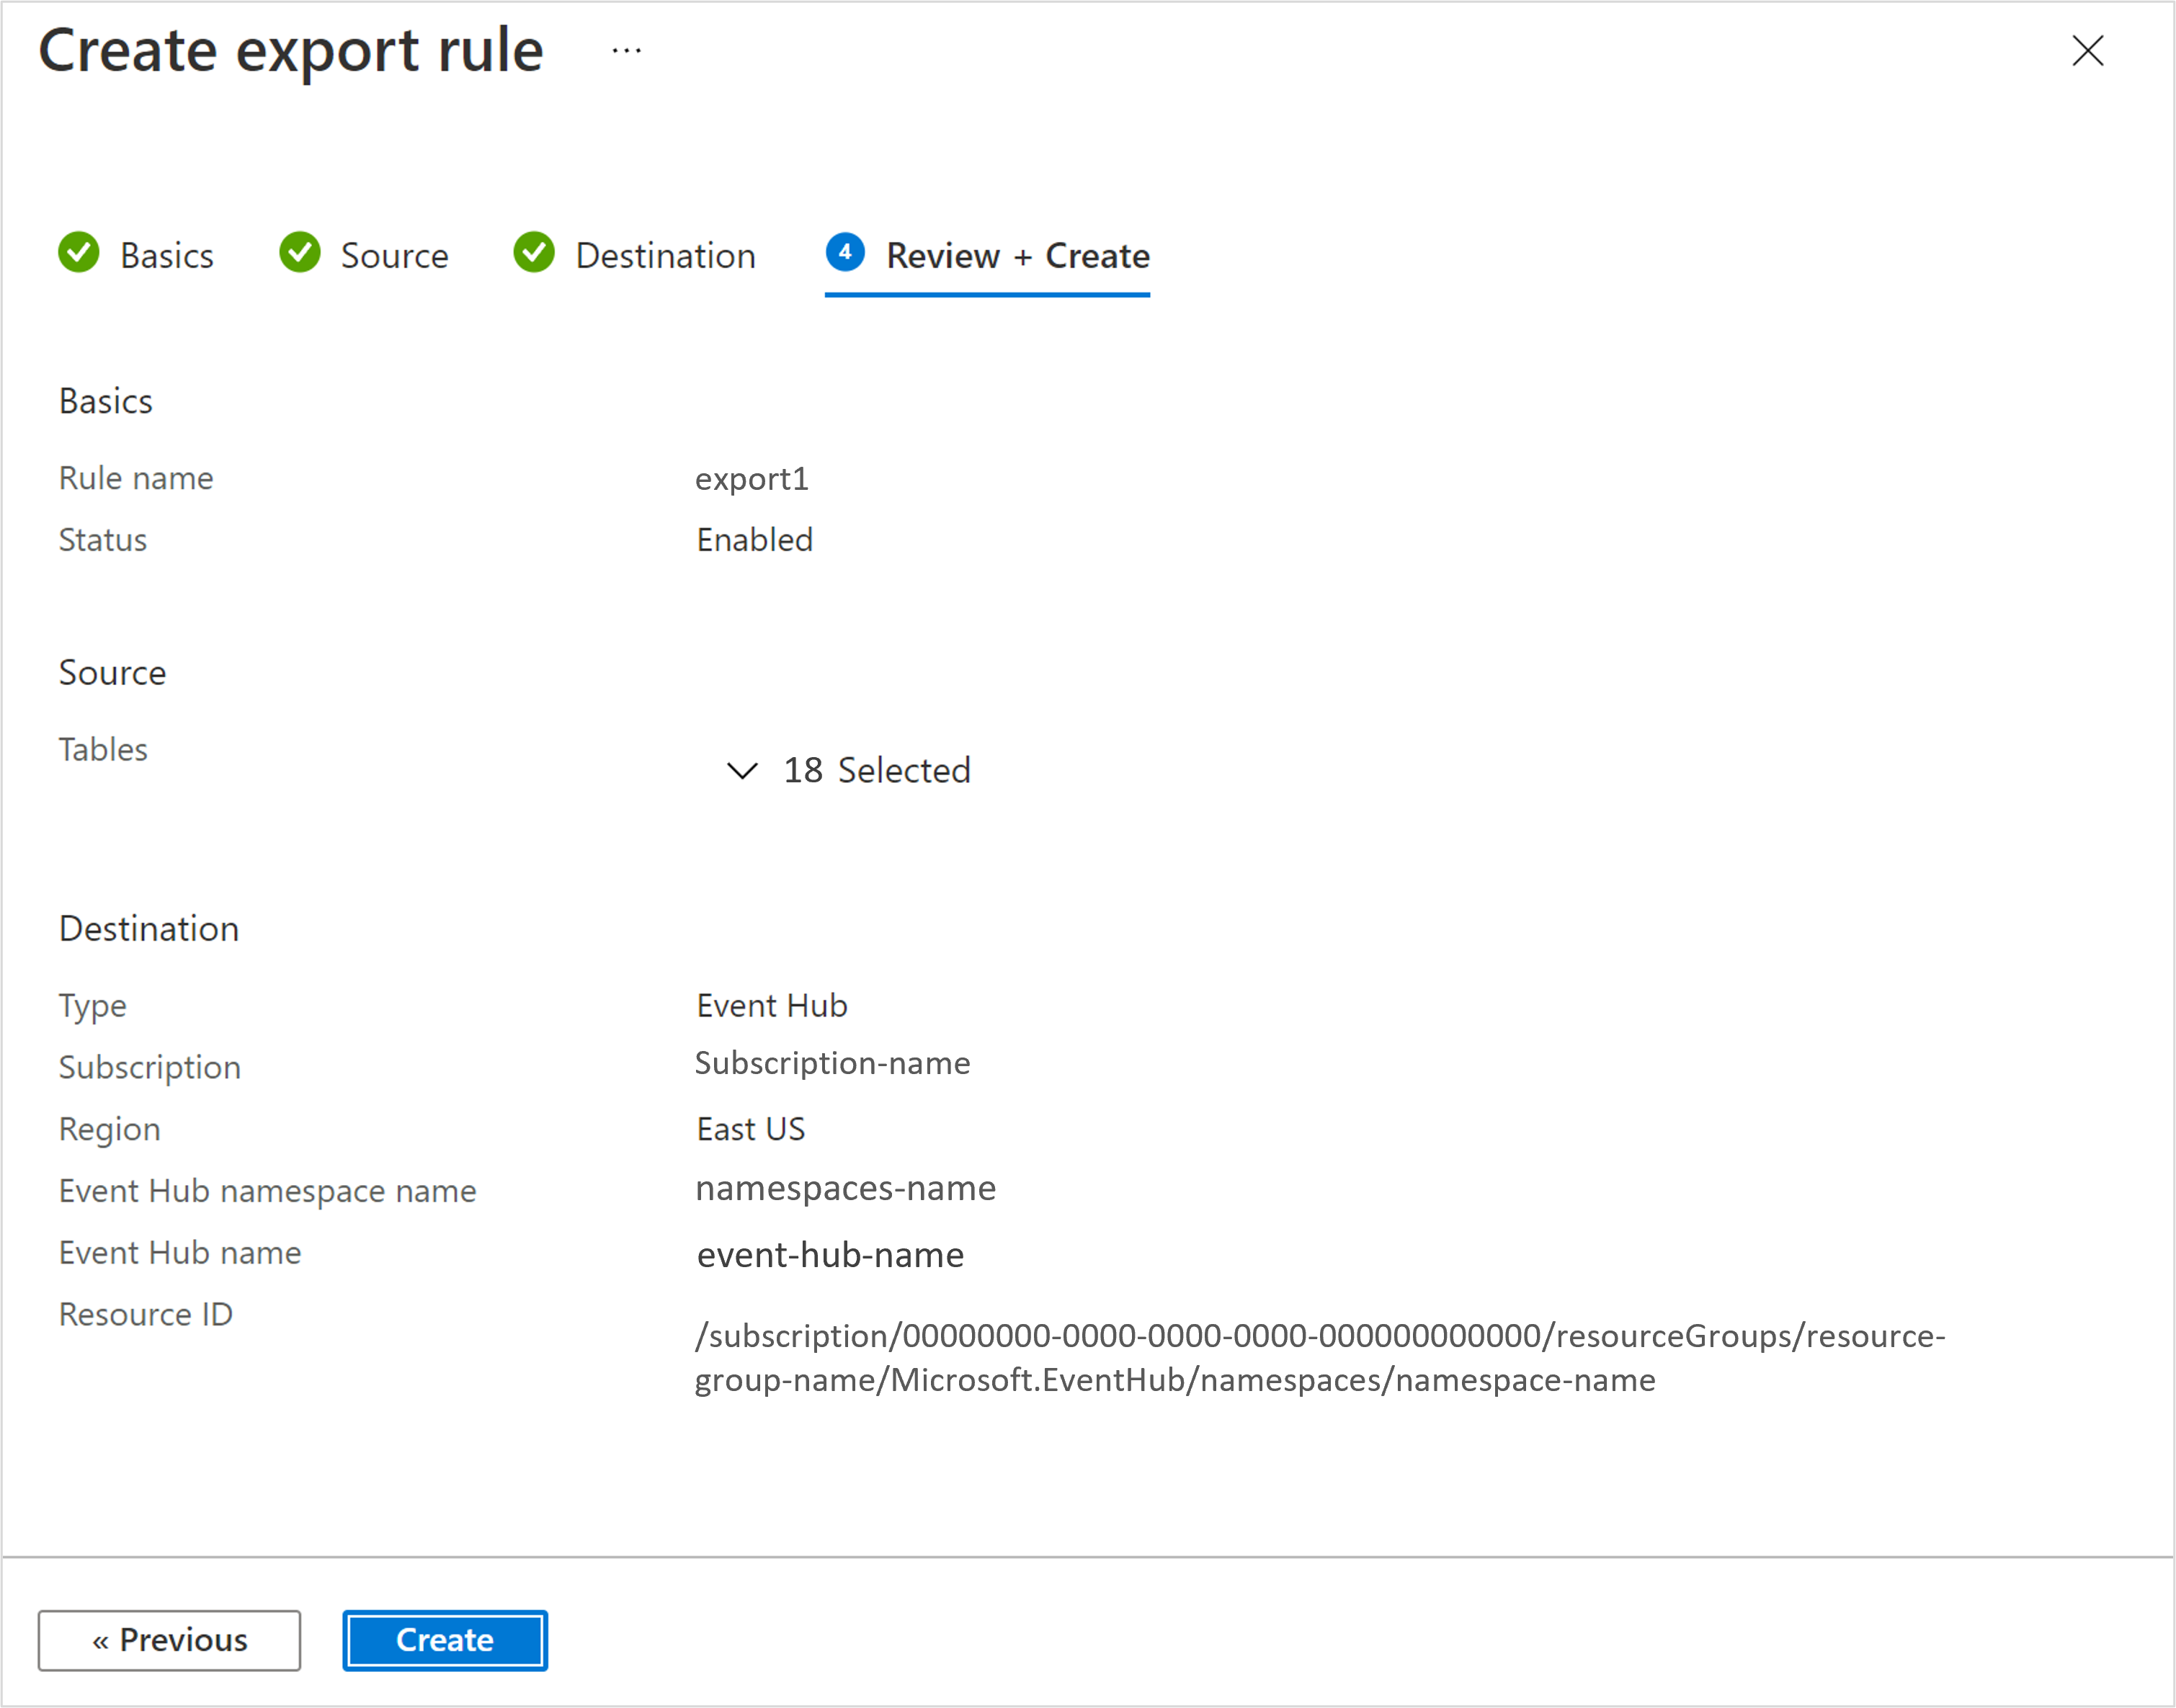
On the Log Analytics workspace menu in the Azure portal, select Data Export under the Settings section. Select New export rule at the top of the pane.

Follow the steps, and then select Create.


View data export rule configuration
On the Log Analytics workspace menu in the Azure portal, select Data Export under the Settings section.

Select a rule for a configuration view.


Disable or update an export rule
You can disable export rules to stop the export for a certain period, such as when testing is being held. On the Log Analytics workspace menu in the Azure portal, select Data Export under the Settings section. Select the Status toggle to disable or enable the export rule.

Delete an export rule
On the Log Analytics workspace menu in the Azure portal, select Data Export under the Settings section. Select the ellipsis to the right of the rule and select Delete.

View all data export rules in a workspace
On the Log Analytics workspace menu in the Azure portal, select Data Export under the Settings section to view all export rules in the workspace.

Unsupported tables
If the data export rule includes an unsupported table, the configuration will succeed, but no data will be exported for that table. If the table is later supported, then its data will be exported at that time.
Supported tables
Note
We are in a process of adding support for more tables. Please check this article regularly. Data must be in one of these tables for it to appear in a Data Export Rule.
| Table | Limitations |
|---|---|
| AACAudit | |
| AACHttpRequest | |
| AADB2CRequestLogs | |
| AADCustomSecurityAttributeAuditLogs | |
| AADDomainServicesAccountLogon | |
| AADDomainServicesAccountManagement | |
| AADDomainServicesDirectoryServiceAccess | |
| AADDomainServicesDNSAuditsDynamicUpdates | |
| AADDomainServicesDNSAuditsGeneral | |
| AADDomainServicesLogonLogoff | |
| AADDomainServicesPolicyChange | |
| AADDomainServicesPrivilegeUse | |
| AADManagedIdentitySignInLogs | |
| AADNonInteractiveUserSignInLogs | |
| AADProvisioningLogs | |
| AADRiskyServicePrincipals | |
| AADRiskyUsers | |
| AADServicePrincipalRiskEvents | |
| AADServicePrincipalSignInLogs | |
| AADUserRiskEvents | |
| ABSBotRequests | |
| ACICollaborationAudit | |
| ACRConnectedClientList | |
| ACSAuthIncomingOperations | |
| ACSBillingUsage | |
| ACSCallAutomationIncomingOperations | |
| ACSCallAutomationMediaSummary | |
| ACSCallClientMediaStatsTimeSeries | |
| ACSCallClientOperations | |
| ACSCallClosedCaptionsSummary | |
| ACSCallDiagnostics | |
| ACSCallRecordingIncomingOperations | |
| ACSCallRecordingSummary | |
| ACSCallSummary | |
| ACSCallSurvey | |
| ACSChatIncomingOperations | |
| ACSEmailSendMailOperational | |
| ACSEmailStatusUpdateOperational | |
| ACSEmailUserEngagementOperational | |
| ACSJobRouterIncomingOperations | |
| ACSNetworkTraversalDiagnostics | |
| ACSNetworkTraversalIncomingOperations | |
| ACSRoomsIncomingOperations | |
| ACSSMSIncomingOperations | |
| ADAssessmentRecommendation | |
| AddonAzureBackupAlerts | |
| AddonAzureBackupJobs | |
| AddonAzureBackupPolicy | |
| AddonAzureBackupProtectedInstance | |
| AddonAzureBackupStorage | |
| ADFActivityRun | |
| ADFAirflowSchedulerLogs | |
| ADFAirflowTaskLogs | |
| ADFAirflowWebLogs | |
| ADFAirflowWorkerLogs | |
| ADFPipelineRun | |
| ADFSandboxActivityRun | |
| ADFSandboxPipelineRun | |
| ADFSSignInLogs | |
| ADFSSISIntegrationRuntimeLogs | |
| ADFSSISPackageEventMessageContext | |
| ADFSSISPackageEventMessages | |
| ADFSSISPackageExecutableStatistics | |
| ADFSSISPackageExecutionComponentPhases | |
| ADFSSISPackageExecutionDataStatistics | |
| ADFTriggerRun | |
| ADPAudit | |
| ADPDiagnostics | |
| ADPRequests | |
| ADReplicationResult | |
| ADSecurityAssessmentRecommendation | |
| ADTDataHistoryOperation | |
| ADTDigitalTwinsOperation | |
| ADTEventRoutesOperation | |
| ADTModelsOperation | |
| ADTQueryOperation | |
| ADXCommand | |
| ADXJournal | |
| ADXQuery | |
| ADXTableDetails | |
| ADXTableUsageStatistics | |
| AegDataPlaneRequests | |
| AegDeliveryFailureLogs | |
| AegPublishFailureLogs | |
| AEWAssignmentBlobLogs | |
| AEWAuditLogs | |
| AEWComputePipelinesLogs | |
| AFSAuditLogs | |
| AGCAccessLogs | |
| AgriFoodApplicationAuditLogs | |
| AgriFoodFarmManagementLogs | |
| AgriFoodFarmOperationLogs | |
| AgriFoodInsightLogs | |
| AgriFoodJobProcessedLogs | |
| AgriFoodModelInferenceLogs | |
| AgriFoodProviderAuthLogs | |
| AgriFoodSatelliteLogs | |
| AgriFoodSensorManagementLogs | |
| AgriFoodWeatherLogs | |
| AGSGrafanaLoginEvents | |
| AGWAccessLogs | |
| AGWFirewallLogs | |
| AGWPerformanceLogs | |
| AHDSDicomAuditLogs | |
| AHDSDicomDiagnosticLogs | |
| AHDSMedTechDiagnosticLogs | |
| AirflowDagProcessingLogs | |
| AKSAudit | |
| AKSAuditAdmin | |
| AKSControlPlane | |
| Alert | Partial support. Data ingestion for Zabbix alerts isn't supported. |
| AlertEvidence | |
| AlertInfo | |
| AmlComputeClusterEvent | |
| AmlComputeCpuGpuUtilization | |
| AmlComputeInstanceEvent | |
| AmlComputeJobEvent | |
| AmlDataSetEvent | |
| AmlDataStoreEvent | |
| AmlDeploymentEvent | |
| AmlEnvironmentEvent | |
| AmlInferencingEvent | |
| AmlModelsEvent | |
| AmlOnlineEndpointConsoleLog | |
| AmlOnlineEndpointEventLog | |
| AmlOnlineEndpointTrafficLog | |
| AmlPipelineEvent | |
| AmlRegistryReadEventsLog | |
| AmlRegistryWriteEventsLog | |
| AmlRunEvent | |
| AmlRunStatusChangedEvent | |
| AMSKeyDeliveryRequests | |
| AMSLiveEventOperations | |
| AMSMediaAccountHealth | |
| AMSStreamingEndpointRequests | |
| ANFFileAccess | |
| Anomalies | |
| AOIDatabaseQuery | |
| AOIDigestion | |
| AOIStorage | |
| ApiManagementGatewayLogs | |
| AppAvailabilityResults | |
| AppBrowserTimings | |
| AppCenterError | |
| AppDependencies | |
| AppEnvSpringAppConsoleLogs | |
| AppEvents | |
| AppExceptions | |
| AppMetrics | |
| AppPageViews | |
| AppPerformanceCounters | |
| AppPlatformIngressLogs | |
| AppPlatformLogsforSpring | |
| AppPlatformSystemLogs | |
| AppRequests | |
| AppServiceAntivirusScanAuditLogs | |
| AppServiceAppLogs | |
| AppServiceAuditLogs | |
| AppServiceAuthenticationLogs | |
| AppServiceConsoleLogs | |
| AppServiceEnvironmentPlatformLogs | |
| AppServiceFileAuditLogs | |
| AppServiceHTTPLogs | |
| AppServiceIPSecAuditLogs | |
| AppServicePlatformLogs | |
| AppServiceServerlessSecurityPluginData | |
| AppSystemEvents | |
| AppTraces | |
| ArcK8sAudit | |
| ArcK8sAuditAdmin | |
| ArcK8sControlPlane | |
| ASCAuditLogs | |
| ASCDeviceEvents | |
| ASimAuditEventLogs | |
| ASimAuthenticationEventLogs | |
| ASimDhcpEventLogs | |
| ASimDnsActivityLogs | |
| ASimFileEventLogs | |
| ASimNetworkSessionLogs | |
| ASimProcessEventLogs | |
| ASimRegistryEventLogs | |
| ASimUserManagementActivityLogs | |
| ASimWebSessionLogs | |
| ASRJobs | |
| ASRReplicatedItems | |
| ATCExpressRouteCircuitIpfix | |
| AuditLogs | |
| AutoscaleEvaluationsLog | |
| AutoscaleScaleActionsLog | |
| AVNMConnectivityConfigurationChange | |
| AVNMIPAMPoolAllocationChange | |
| AVNMNetworkGroupMembershipChange | |
| AVNMRuleCollectionChange | |
| AVSSyslog | |
| AWSCloudTrail | |
| AWSCloudWatch | |
| AWSGuardDuty | |
| AWSVPCFlow | |
| AZFWApplicationRule | |
| AZFWApplicationRuleAggregation | |
| AZFWDnsQuery | |
| AZFWFatFlow | |
| AZFWFlowTrace | |
| AZFWIdpsSignature | |
| AZFWInternalFqdnResolutionFailure | |
| AZFWNatRule | |
| AZFWNatRuleAggregation | |
| AZFWNetworkRule | |
| AZFWNetworkRuleAggregation | |
| AZFWThreatIntel | |
| AZKVAuditLogs | |
| AZKVPolicyEvaluationDetailsLogs | |
| AZMSApplicationMetricLogs | |
| AZMSArchiveLogs | |
| AZMSAutoscaleLogs | |
| AZMSCustomerManagedKeyUserLogs | |
| AZMSHybridConnectionsEvents | |
| AZMSKafkaCoordinatorLogs | |
| AZMSKafkaUserErrorLogs | |
| AZMSOperationalLogs | |
| AZMSRunTimeAuditLogs | |
| AZMSVnetConnectionEvents | |
| AzureActivity | Partial support. Data arriving from the Log Analytics agent or Azure Monitor Agent is fully supported in export. Data arriving via the Diagnostics extension agent is collected through storage. This path isn't supported in export. |
| AzureAssessmentRecommendation | |
| AzureAttestationDiagnostics | |
| AzureBackupOperations | |
| AzureDevOpsAuditing | |
| AzureLoadTestingOperation | |
| AzureMetricsV2 | |
| BehaviorAnalytics | |
| CassandraAudit | |
| CassandraLogs | |
| CCFApplicationLogs | |
| CDBCassandraRequests | |
| CDBControlPlaneRequests | |
| CDBDataPlaneRequests | |
| CDBGremlinRequests | |
| CDBMongoRequests | |
| CDBPartitionKeyRUConsumption | |
| CDBPartitionKeyStatistics | |
| CDBQueryRuntimeStatistics | |
| ChaosStudioExperimentEventLogs | |
| CHSMManagementAuditLogs | |
| CIEventsAudit | |
| CIEventsOperational | |
| CloudAppEvents | |
| CommonSecurityLog | |
| ComputerGroup | |
| ConfidentialWatchlist | |
| ConfigurationData | Partial support. Some of the data is ingested through internal services that aren't supported in export. Currently, this portion is missing in export. |
| ContainerAppConsoleLogs | |
| ContainerAppSystemLogs | |
| ContainerEvent | |
| ContainerImageInventory | |
| ContainerInstanceLog | |
| ContainerInventory | |
| ContainerLog | |
| ContainerLogV2 | |
| ContainerNodeInventory | |
| ContainerRegistryLoginEvents | |
| ContainerRegistryRepositoryEvents | |
| ContainerServiceLog | |
| CoreAzureBackup | |
| DatabricksAccounts | |
| DatabricksCapsule8Dataplane | |
| DatabricksClamAVScan | |
| DatabricksClusterLibraries | |
| DatabricksClusters | |
| DatabricksDBFS | |
| DatabricksDeltaPipelines | |
| DatabricksFeatureStore | |
| DatabricksGenie | |
| DatabricksGitCredentials | |
| DatabricksGlobalInitScripts | |
| DatabricksIAMRole | |
| DatabricksInstancePools | |
| DatabricksJobs | |
| DatabricksMLflowAcledArtifact | |
| DatabricksMLflowExperiment | |
| DatabricksModelRegistry | |
| DatabricksNotebook | |
| DatabricksPartnerHub | |
| DatabricksRemoteHistoryService | |
| DatabricksRepos | |
| DatabricksSecrets | |
| DatabricksServerlessRealTimeInference | |
| DatabricksSQLPermissions | |
| DatabricksSSH | |
| DatabricksUnityCatalog | |
| DatabricksWebTerminal | |
| DatabricksWorkspace | |
| DatabricksWorkspaceLogs | |
| DataTransferOperations | |
| DataverseActivity | |
| DCRLogErrors | |
| DCRLogTroubleshooting | |
| DevCenterBillingEventLogs | |
| DevCenterDiagnosticLogs | |
| DevCenterResourceOperationLogs | |
| DeviceEvents | |
| DeviceFileCertificateInfo | |
| DeviceFileEvents | |
| DeviceImageLoadEvents | |
| DeviceInfo | |
| DeviceLogonEvents | |
| DeviceNetworkEvents | |
| DeviceNetworkInfo | |
| DeviceProcessEvents | |
| DeviceRegistryEvents | |
| DeviceTvmSecureConfigurationAssessment | |
| DeviceTvmSecureConfigurationAssessmentKB | |
| DeviceTvmSoftwareInventory | |
| DeviceTvmSoftwareVulnerabilities | |
| DeviceTvmSoftwareVulnerabilitiesKB | |
| DnsEvents | |
| DnsInventory | |
| DNSQueryLogs | |
| DSMAzureBlobStorageLogs | |
| DSMDataClassificationLogs | |
| DSMDataLabelingLogs | |
| Dynamics365Activity | |
| DynamicSummary | |
| EGNFailedMqttConnections | |
| EGNFailedMqttPublishedMessages | |
| EGNFailedMqttSubscriptions | |
| EGNMqttDisconnections | |
| EGNSuccessfulMqttConnections | |
| EmailAttachmentInfo | |
| EmailEvents | |
| EmailPostDeliveryEvents | |
| EmailUrlInfo | |
| EnrichedMicrosoft365AuditLogs | |
| ETWEvent | Partial support. Data arriving from the Log Analytics agent or Azure Monitor Agent is fully supported in export. Data arriving via the Diagnostics extension agent is collected through storage. This path isn't supported in export. |
| Event | Partial support. Data arriving from the Log Analytics agent or Azure Monitor Agent is fully supported in export. Data arriving via the Diagnostics extension agent is collected through storage. This path isn't supported in export. |
| ExchangeAssessmentRecommendation | |
| ExchangeOnlineAssessmentRecommendation | |
| FailedIngestion | |
| FunctionAppLogs | |
| GCPAuditLogs | |
| GoogleCloudSCC | |
| HDInsightAmbariClusterAlerts | |
| HDInsightAmbariSystemMetrics | |
| HDInsightGatewayAuditLogs | |
| HDInsightHadoopAndYarnLogs | |
| HDInsightHadoopAndYarnMetrics | |
| HDInsightHBaseLogs | |
| HDInsightHBaseMetrics | |
| HDInsightHiveAndLLAPLogs | |
| HDInsightHiveAndLLAPMetrics | |
| HDInsightHiveQueryAppStats | |
| HDInsightHiveTezAppStats | |
| HDInsightJupyterNotebookEvents | |
| HDInsightKafkaLogs | |
| HDInsightKafkaMetrics | |
| HDInsightOozieLogs | |
| HDInsightRangerAuditLogs | |
| HDInsightSecurityLogs | |
| HDInsightSparkApplicationEvents | |
| HDInsightSparkBlockManagerEvents | |
| HDInsightSparkEnvironmentEvents | |
| HDInsightSparkExecutorEvents | |
| HDInsightSparkExtraEvents | |
| HDInsightSparkJobEvents | |
| HDInsightSparkLogs | |
| HDInsightSparkSQLExecutionEvents | |
| HDInsightSparkStageEvents | |
| HDInsightSparkStageTaskAccumulables | |
| HDInsightSparkTaskEvents | |
| HDInsightStormLogs | |
| HDInsightStormMetrics | |
| HDInsightStormTopologyMetrics | |
| HealthStateChangeEvent | |
| Heartbeat | |
| HuntingBookmark | |
| IdentityDirectoryEvents | |
| IdentityInfo | |
| IdentityLogonEvents | |
| IdentityQueryEvents | |
| InsightsMetrics | Partial support. Some of the data is ingested through internal services that aren't supported in export. Currently, this portion is missing in export. |
| IntuneAuditLogs | |
| IntuneDevices | |
| IntuneOperationalLogs | |
| KubeEvents | |
| KubeHealth | |
| KubeMonAgentEvents | |
| KubeNodeInventory | |
| KubePodInventory | |
| KubePVInventory | |
| KubeServices | |
| LAQueryLogs | |
| LASummaryLogs | |
| LinuxAuditLog | |
| LogicAppWorkflowRuntime | |
| McasShadowItReporting | |
| MCCEventLogs | |
| MCVPAuditLogs | |
| MCVPOperationLogs | |
| MicrosoftAzureBastionAuditLogs | |
| MicrosoftDataShareReceivedSnapshotLog | |
| MicrosoftDataShareSentSnapshotLog | |
| MicrosoftDataShareShareLog | |
| MicrosoftGraphActivityLogs | |
| MicrosoftHealthcareApisAuditLogs | |
| MicrosoftPurviewInformationProtection | |
| MNFDeviceUpdates | |
| MNFSystemStateMessageUpdates | |
| NCBMBreakGlassAuditLogs | |
| NCBMSecurityDefenderLogs | |
| NCBMSecurityLogs | |
| NCBMSystemLogs | |
| NCCKubernetesLogs | |
| NCCVMOrchestrationLogs | |
| NCSStorageAlerts | |
| NCSStorageLogs | |
| NetworkAccessTraffic | |
| NetworkMonitoring | |
| NGXOperationLogs | |
| NSPAccessLogs | |
| NTAIpDetails | |
| NTANetAnalytics | |
| NTATopologyDetails | |
| NWConnectionMonitorDestinationListenerResult | |
| NWConnectionMonitorPathResult | |
| NWConnectionMonitorTestResult | |
| OEPAirFlowTask | |
| OEPAuditLogs | |
| OEPDataplaneLogs | |
| OEPElasticOperator | |
| OEPElasticsearch | |
| OfficeActivity | |
| OLPSupplyChainEntityOperations | |
| OLPSupplyChainEvents | |
| Operation | Partial support. Some of the data is ingested through internal services that aren't supported in export. Currently, this portion is missing in export. |
| Perf | |
| PFTitleAuditLogs | |
| PowerAppsActivity | |
| PowerAutomateActivity | |
| PowerBIActivity | |
| PowerBIAuditTenant | |
| PowerBIDatasetsTenant | |
| PowerBIDatasetsWorkspace | |
| PowerBIReportUsageWorkspace | |
| PowerPlatformAdminActivity | |
| PowerPlatformConnectorActivity | |
| PowerPlatformDlpActivity | |
| ProjectActivity | |
| PurviewDataSensitivityLogs | |
| PurviewScanStatusLogs | |
| PurviewSecurityLogs | |
| REDConnectionEvents | |
| RemoteNetworkHealthLogs | |
| ResourceManagementPublicAccessLogs | |
| SCCMAssessmentRecommendation | |
| SCOMAssessmentRecommendation | |
| SecureScoreControls | |
| SecureScores | |
| SecurityAlert | |
| SecurityAttackPathData | |
| SecurityBaseline | |
| SecurityBaselineSummary | |
| SecurityDetection | |
| SecurityEvent | Partial support. Data arriving from the Log Analytics agent or Azure Monitor Agent is fully supported in export. Data arriving via the Diagnostics extension agent is collected through storage. This path isn't supported in export. |
| SecurityIncident | |
| SecurityIoTRawEvent | |
| SecurityNestedRecommendation | |
| SecurityRecommendation | |
| SecurityRegulatoryCompliance | |
| SentinelAudit | |
| SentinelHealth | |
| ServiceFabricOperationalEvent | Partial support. Data arriving from the Log Analytics agent or Azure Monitor Agent is fully supported in export. Data arriving via the Diagnostics extension agent is collected through storage. This path isn't supported in export. |
| ServiceFabricReliableActorEvent | Partial support. Data arriving from the Log Analytics agent or Azure Monitor Agent is fully supported in export. Data arriving via the Diagnostics extension agent is collected through storage. This path isn't supported in export. |
| ServiceFabricReliableServiceEvent | Partial support. Data arriving from the Log Analytics agent or Azure Monitor Agent is fully supported in export. Data arriving via the Diagnostics extension agent is collected through storage. This path isn't supported in export. |
| SfBAssessmentRecommendation | |
| SharePointOnlineAssessmentRecommendation | |
| SignalRServiceDiagnosticLogs | |
| SigninLogs | |
| SPAssessmentRecommendation | |
| SQLAssessmentRecommendation | |
| SQLSecurityAuditEvents | |
| SqlVulnerabilityAssessmentScanStatus | |
| StorageBlobLogs | |
| StorageCacheOperationEvents | |
| StorageCacheUpgradeEvents | |
| StorageCacheWarningEvents | |
| StorageFileLogs | |
| StorageMalwareScanningResults | |
| StorageMoverCopyLogsFailed | |
| StorageMoverCopyLogsTransferred | |
| StorageMoverJobRunLogs | |
| StorageQueueLogs | |
| StorageTableLogs | |
| SucceededIngestion | |
| SynapseBigDataPoolApplicationsEnded | |
| SynapseBuiltinSqlPoolRequestsEnded | |
| SynapseDXFailedIngestion | |
| SynapseDXSucceededIngestion | |
| SynapseGatewayApiRequests | |
| SynapseIntegrationActivityRuns | |
| SynapseIntegrationPipelineRuns | |
| SynapseIntegrationTriggerRuns | |
| SynapseLinkEvent | |
| SynapseRbacOperations | |
| SynapseScopePoolScopeJobsEnded | |
| SynapseScopePoolScopeJobsStateChange | |
| SynapseSqlPoolDmsWorkers | |
| SynapseSqlPoolExecRequests | |
| SynapseSqlPoolRequestSteps | |
| SynapseSqlPoolSqlRequests | |
| SynapseSqlPoolWaits | |
| Syslog | Partial support. Data arriving from the Log Analytics agent or Azure Monitor Agent is fully supported in export. Data arriving via the Diagnostics extension agent is collected through storage. This path isn't supported in export. |
| ThreatIntelligenceIndicator | |
| TSIIngress | |
| UCClient | |
| UCClientReadinessStatus | |
| UCClientUpdateStatus | |
| UCDeviceAlert | |
| UCDOAggregatedStatus | |
| UCDOStatus | |
| UCServiceUpdateStatus | |
| UCUpdateAlert | |
| Update | Partial support. Some of the data is ingested through internal services that aren't supported in export. Currently, this portion is missing in export. |
| UpdateRunProgress | |
| UpdateSummary | |
| UrlClickEvents | |
| Usage | |
| UserAccessAnalytics | |
| UserPeerAnalytics | |
| VCoreMongoRequests | |
| VIAudit | |
| VIIndexing | |
| VMConnection | Partial support. Some of the data is ingested through internal services that aren't supported in export. Currently, this portion is missing in export. |
| W3CIISLog | Partial support. Data arriving from the Log Analytics agent or Azure Monitor Agent is fully supported in export. Data arriving via the Diagnostics extension agent is collected through storage. This path isn't supported in export. |
| WaaSDeploymentStatus | |
| WaaSInsiderStatus | |
| WaaSUpdateStatus | |
| Watchlist | |
| WebPubSubConnectivity | |
| WebPubSubHttpRequest | |
| WebPubSubMessaging | |
| Windows365AuditLogs | |
| WindowsClientAssessmentRecommendation | |
| WindowsEvent | |
| WindowsFirewall | |
| WindowsServerAssessmentRecommendation | |
| WireData | Partial support. Some of the data is ingested through internal services that aren't supported in export. Currently, this portion is missing in export. |
| WorkloadDiagnosticLogs | |
| WUDOAggregatedStatus | |
| WUDOStatus | |
| WVDAgentHealthStatus | |
| WVDCheckpoints | |
| WVDConnectionNetworkData | |
| WVDConnections | |
| WVDErrors | |
| WVDFeeds | |
| WVDHostRegistrations | |
| WVDManagement |
Next steps
Feedback
Coming soon: Throughout 2024 we will be phasing out GitHub Issues as the feedback mechanism for content and replacing it with a new feedback system. For more information see: https://aka.ms/ContentUserFeedback.
Submit and view feedback for