Log storage and monitoring options in Azure Container Apps
Azure Container Apps gives you options for storing and viewing your application logs. Logging options are configured in your Container Apps environment where you select the log destination.
Container Apps application logs consist of two different categories:
- Container console output (
stdout/stderr) messages. - System logs generated by Azure Container Apps.
- Spring App console logs.
You can choose between these logs destinations:
- Log Analytics: Azure Monitor Log Analytics is the default storage and viewing option. Your logs are stored in a Log Analytics workspace where they can be viewed and analyzed using Log Analytics queries. To learn more about Log Analytics, see Azure Monitor Log Analytics.
- Azure Monitor: Azure Monitor routes logs to one or more destinations:
- Log Analytics workspace for viewing and analysis.
- Azure storage account to archive.
- Azure event hub for data ingestion and analytic services. For more information, see Azure Event Hubs.
- An Azure partner monitoring solution such as, Datadog, Elastic, Logz.io and others. For more information, see Partner solutions.
- None: You can disable the storage of log data. When disabled, you can still view real-time container logs via the Logs stream feature in your container app. For more information, see Log streaming.
When None or the Azure Monitor destination is selected, the Logs menu item providing the Log Analytics query editor in the Azure portal is disabled.
Configure options via the Azure portal
Use these steps to configure the logging options for your Container Apps environment in the Azure portal:
- Go to the Logging Options on your Container Apps environment window in the portal.
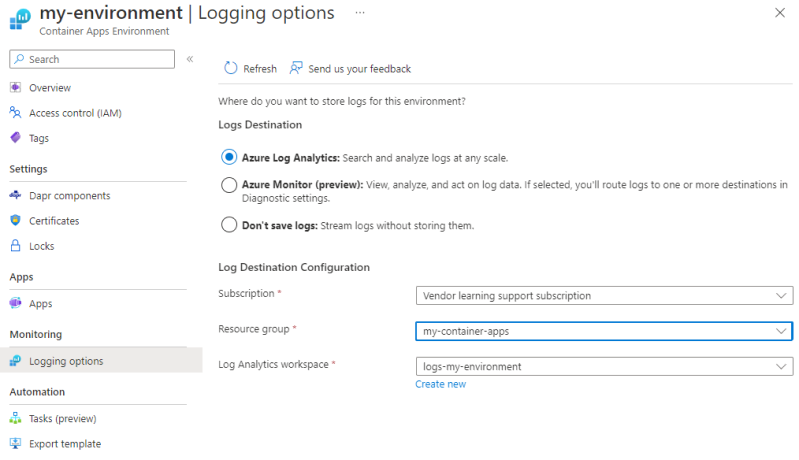
- You can choose from the following Logs Destination options:
- Log Analytics: With this option, you select a Log Analytics workspace to store your log data. Your logs can be viewed through Log Analytics queries. To learn more about Log Analytics, see Azure Monitor Log Analytics.
- Azure Monitor: Azure Monitor routes your logs to a destination. When you select this option, you must select Diagnostic settings to complete the configuration after you select Save on this page.
- None: This option disables the storage of log data.
- Select Save.
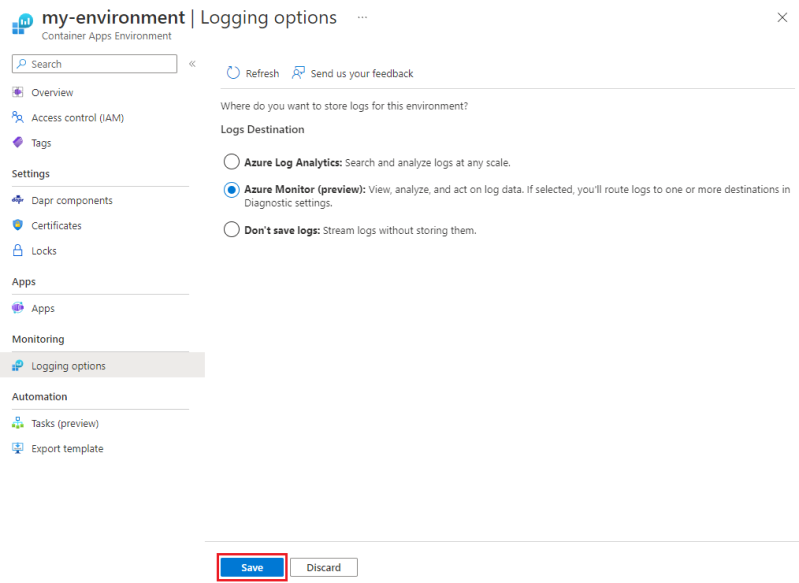
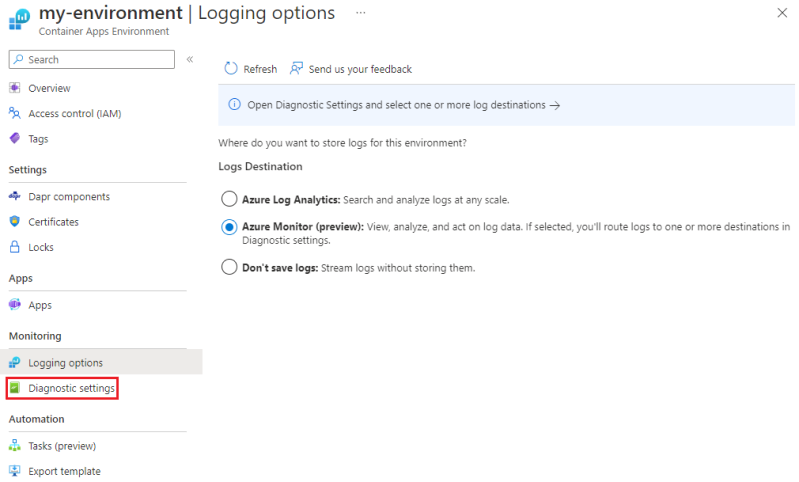
- If you have selected Azure Monitor as your logs destination, you must configure Diagnostic settings. The Diagnostic settings item appears below the Logging options menu item.
Diagnostic settings
When you select Azure Monitor as your logs destination, you must configure the destination details. Select Diagnostic settings from the left side menu of the Container Apps Environment window in the portal.
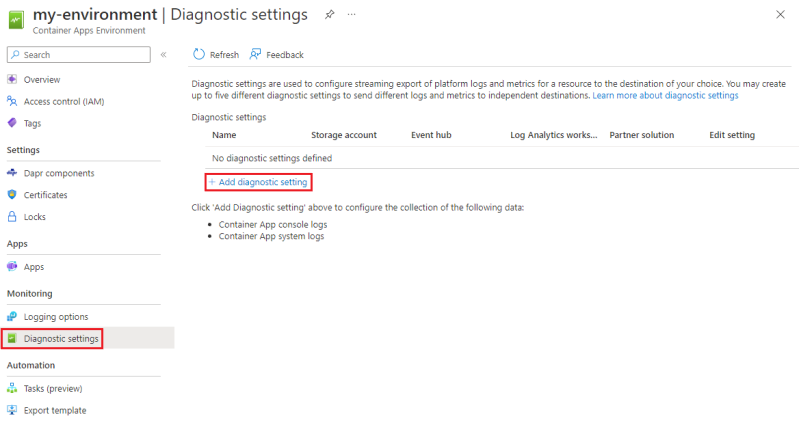
Destination details are saved as diagnostic settings. You can create up to five diagnostic settings for your container app environment. You can configure different log categories for each diagnostic setting. For example, create one diagnostic setting to send the system logs category to one destination, and another to send the container console logs category to another destination.
To create a new diagnostic setting:
Select Add diagnostic setting.
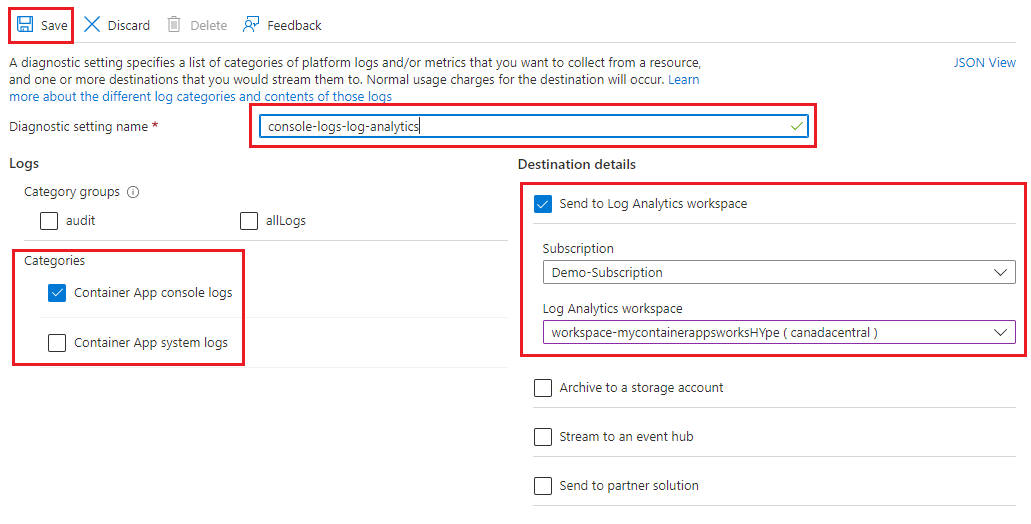
Enter a name for your diagnostic setting.
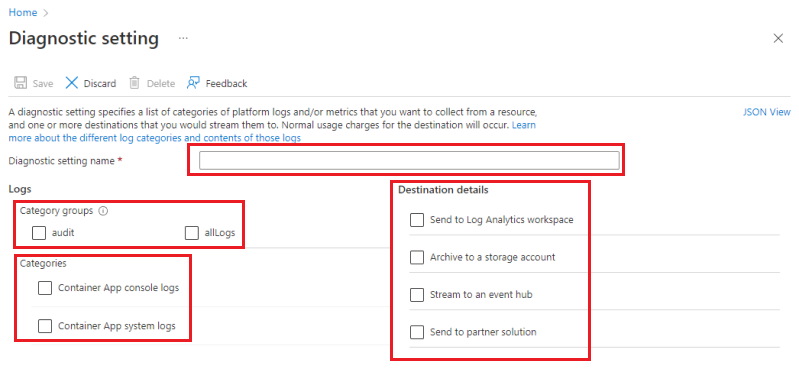
Select the log Category groups or Categories you want to send to this destination. You can select one or more categories.
Select one or more Destination details:
- Send to Log Analytics workspace: Select from existing Log Analytics workspaces.
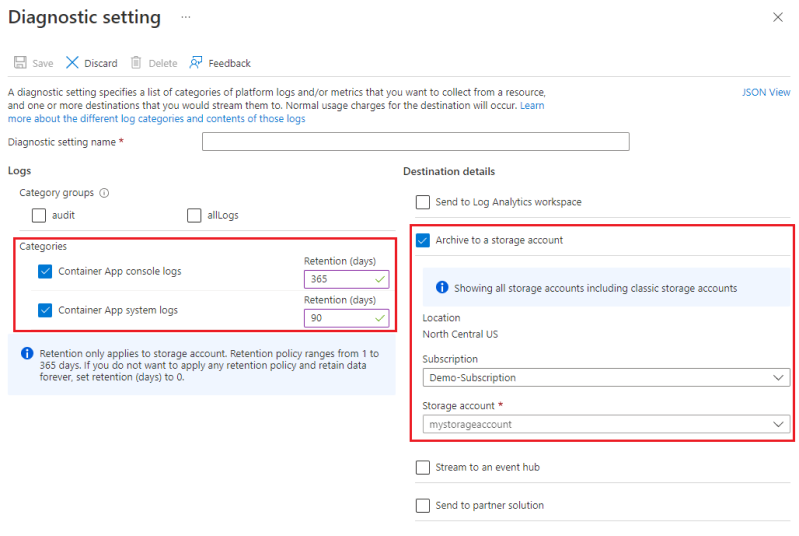
- Archive to a storage account: You can choose from existing storage accounts. When the individual log categories are selected, you can set the Retention (days) for each category.
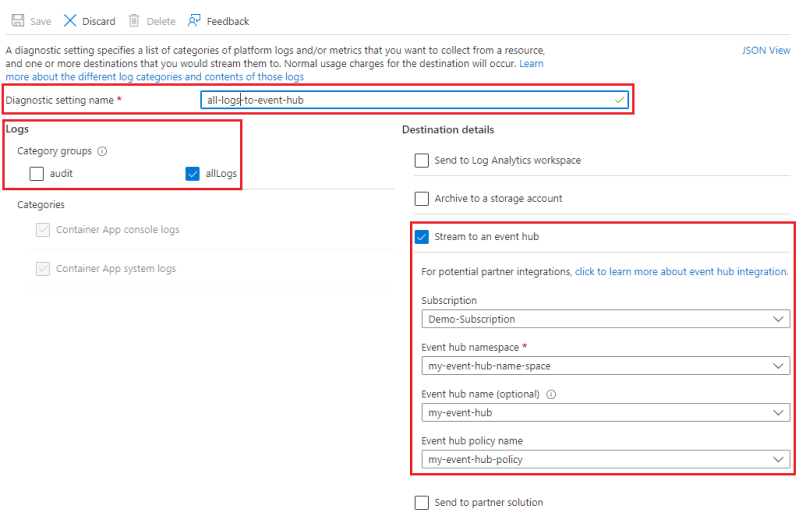
- Stream to an event hub: Select from Azure event hubs.
- Send to a partner solution: Select from Azure partner solutions.
- Send to Log Analytics workspace: Select from existing Log Analytics workspaces.
Select Save.
For more information about Diagnostic settings, see Diagnostic settings in Azure Monitor.
Configure options using the Azure CLI
Configure logs destination for your Container Apps environment using the Azure CLI az containerapp create and az containerapp update commands with the --logs-destination argument.
The destination values are: log-analytics, azure-monitor, and none.
For example, to create a Container Apps environment using an existing Log Analytics workspace as the logs destination, you must provide the --logs-destination argument with the value log-analytics and the --logs-destination-id argument with the value of the Log Analytics workspace resource ID. You can get the resource ID from the Log Analytics workspace page in the Azure portal or from the az monitor log-analytics workspace show command.
Replace <PLACEHOLDERS> with your values:
az containerapp env create \
  --name <ENVIRONMENT_NAME> \
  --resource-group <RESOURCE_GROUP> \
  --logs-destination log-analytics \
  --logs-workspace-id <WORKSPACE_ID>
To update an existing Container Apps environment to use Azure Monitor as the logs destination:
Replace <PLACEHOLDERS> with your values:
az containerapp env update \
  --name <ENVIRONMENT_NAME> \
  --resource-group <RESOURCE_GROUP> \
  --logs-destination azure-monitor
When --logs-destination is set to azure-monitor, create diagnostic settings to configure the destination details for the log categories with the az monitor diagnostics-settings command.
For more information about Azure Monitor diagnostic settings commands, see az monitor diagnostic-settings. Container Apps log categories are ContainerAppConsoleLogs and ContainerAppSystemLogs.
Next steps
Feedback
Coming soon: Throughout 2024 we will be phasing out GitHub Issues as the feedback mechanism for content and replacing it with a new feedback system. For more information see: https://aka.ms/ContentUserFeedback.
Submit and view feedback for