Configure diagnostic log delivery
This article describes how to enable diagnostic log delivery for your Azure Databricks workspaces.
Note
Diagnostic logs require the Premium plan.
Log in to the Azure portal as an Owner or Contributor for the Azure Databricks workspace and click your Azure Databricks Service resource.
In the Monitoring section of the sidebar, click the Diagnostic settings tab.
Click Turn on diagnostics.
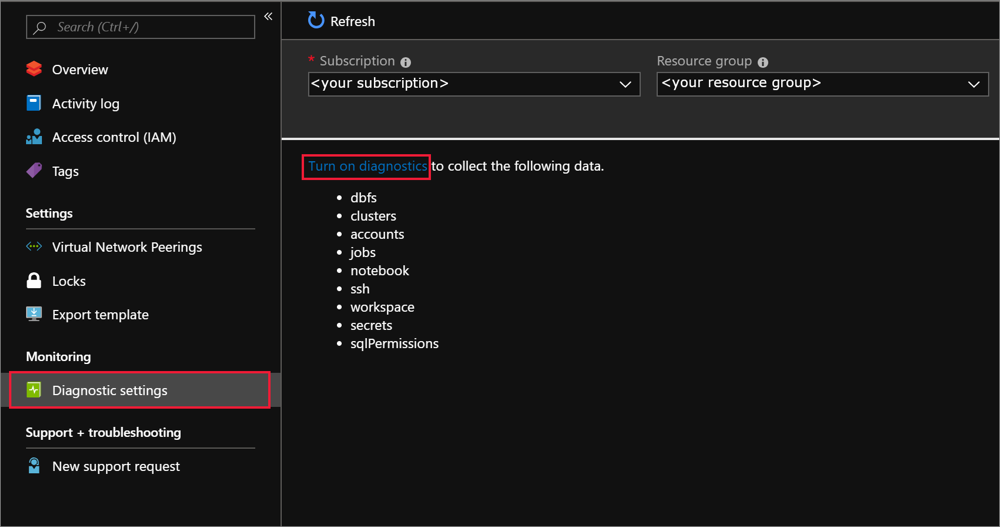
On the Diagnostic settings page, provide the following configuration:
Name
Enter a name for the logs to create.
Archive to a storage account
To use this option, you need an existing storage account to connect to. To create a new storage account in the portal, see Create a storage account and follow the instructions to create an Azure Resource Manager, general-purpose account. Then return to this page in the portal to select your storage account. It might take a few minutes for newly created storage accounts to appear in the drop-down menu. For information about additional costs incurred by writing to a storage account, see Azure Storage pricing.
Stream to an event hub
To use this option, you need an existing Azure Event Hubs namespace and event hub to connect to. To create an Event Hubs namespace, see Create an Event Hubs namespace and an event hub by using the Azure portal. Then return to this page in the portal to select the Event Hubs namespace and policy name. For information about additional costs incurred by writing to an event hub, see Azure Event Hubs pricing.
Send to Log Analytics
To use this option, either use an existing Log Analytics workspace or create a new one by following the steps to Create a new workspace in the portal. For information about additional costs incurred by sending logs to Log Analytics, see Azure Monitor pricing.
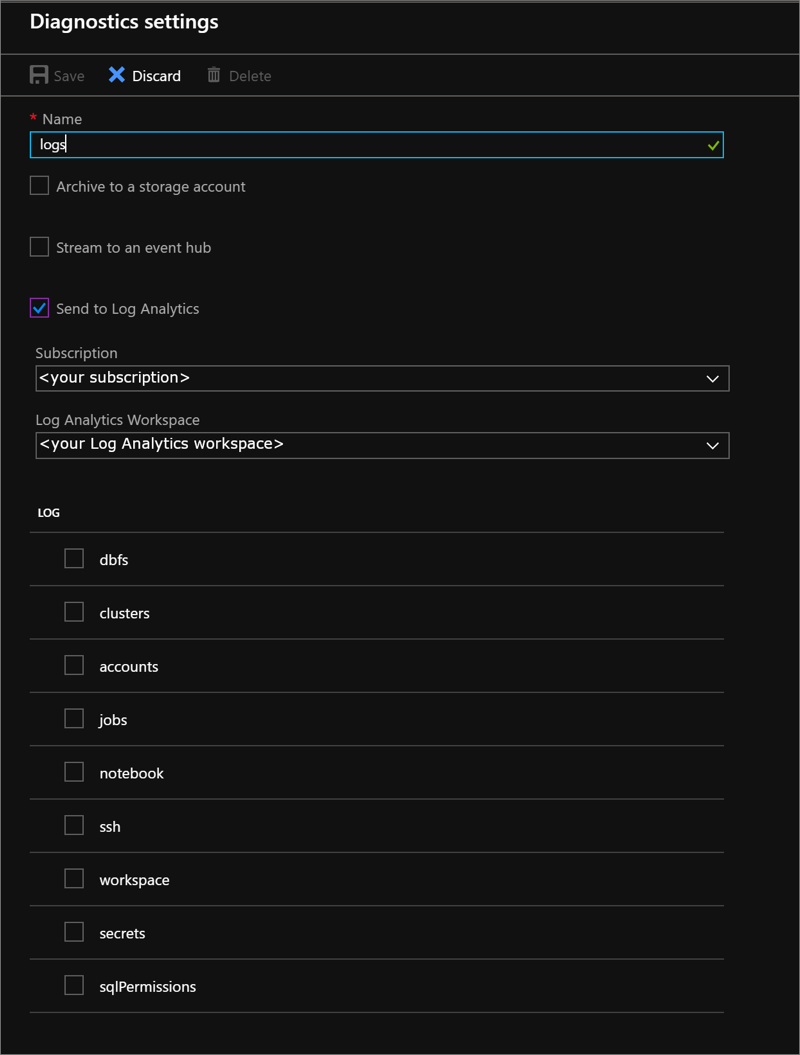
Choose the services you want diagnostic logs for.
Select Save.
If you receive an error that says “Failed to update diagnostics for
<workspace name>. The subscription<subscription id>is not registered to use microsoft.insights,” follow the Troubleshoot Azure Diagnostics instructions to register the account and then retry this procedure.If you want to change how your diagnostic logs are saved at any point in the future, return to this page to modify the diagnostic log settings for your account.
Note
If you want to set storage retention policies, configure an Azure lifecycle management policy.
Enable logging using PowerShell
Start an Azure PowerShell session and sign in to your Azure account with the following command:
Connect-AzAccountTo sign in to your Azure account as a user, see PowerShell login with an Azure Databricks user account. To sign in to your Azure account as a service principal, see PowerShell login with a Microsoft Entra ID service principal.
If you do not have Azure Powershell installed already, use the following commands to install Azure PowerShell.
Install-Module -Name Az -AllowClobberIn the pop-up browser window, enter your Azure account user name and password. Azure PowerShell gets all of the subscriptions that are associated with this account, and by default, uses the first one.
If you have more than one subscription, you might have to specify the specific subscription that was used to create your Azure Key Vault. To see the subscriptions for your account, type the following command:
Get-AzSubscriptionTo specify the subscription that’s associated with the Azure Databricks account that you’re logging, type the following command:
Set-AzContext -SubscriptionId <subscription ID>Set your Log Analytics resource name to a variable named
logAnalytics, whereResourceNameis the name of the Log Analytics workspace.$logAnalytics = Get-AzResource -ResourceGroupName <resource group name> -ResourceName <resource name> -ResourceType "Microsoft.OperationalInsights/workspaces"Set the Azure Databricks service resource name to a variable named
databricks, whereResourceNameis the name of the Azure Databricks service.$databricks = Get-AzResource -ResourceGroupName <your resource group name> -ResourceName <your Azure Databricks service name> -ResourceType "Microsoft.Databricks/workspaces"To enable logging for Azure Databricks, use the New-AzDiagnosticSetting cmdlet with variables for the new storage account, Azure Databricks service, and the category to enable for logging. Run the following command and set the
-Enabledflag to$true:New-AzDiagnosticSetting -ResourceId $databricks.ResourceId -WorkspaceId $logAnalytics.ResourceId -Enabled $true -name "<diagnostic setting name>" -Category <comma separated list>
Enable logging by using Azure CLI
Open PowerShell.
Use the following command to connect to your Azure account:
az loginTo connect by using a Microsoft Entra ID service principal, see Azure CLI login with a Microsoft Entra ID service principal.
To connect by using an Azure Databricks user account, see Azure CLI login with an Azure Databricks user account.
Run the following diagnostic setting command:
az monitor diagnostic-settings create --name <diagnostic name>
--resource-group <log analytics workspace resource group>
--workspace <log analytics name or object ID>
--resource <target resource object ID>
--logs '[
{
 \"category\": <category name>,
  \"enabled\": true
}
]'
REST API
Use the LogSettings API.
Request
PUT https://management.azure.com/{resourceUri}/providers/microsoft.insights/diagnosticSettings/{name}?api-version=2017-05-01-preview
Request body
{
    "properties": {
    "workspaceId": "<log analytics resourceId>",
    "logs": [
      {
        "category": "<category name>",
        "enabled": true,
        "retentionPolicy": {
          "enabled": false,
          "days": 0
        }
      }
    ]
  }
}
Diagnostic log latency
After logging is enabled for your account, Azure Databricks automatically sends diagnostic logs to your delivery location. Logs are typically available within 15 minutes of activation. Azure Databricks auditable events typically appear in diagnostic logs within 15 minutes in Azure Commercial regions.
SSH login logs are delivered with high latency.
Note
While most logs are expected to be delivered within 15 minutes, Azure Databricks does not guarantee a time frame for log delivery.
Feedback
Coming soon: Throughout 2024 we will be phasing out GitHub Issues as the feedback mechanism for content and replacing it with a new feedback system. For more information see: https://aka.ms/ContentUserFeedback.
Submit and view feedback for