Get started with the preconfigured solutions
Azure IoT Suite preconfigured solutions combine multiple Azure IoT services to deliver end-to-end solutions that implement common IoT business scenarios. The remote monitoring preconfigured solution connects to and monitors your devices. You can use the solution to analyze the stream of data from your devices and to improve business outcomes by making processes respond automatically to that stream of data.
This tutorial shows you how to provision the remote monitoring preconfigured solution. It also walks you through the basic features of the preconfigured solution. You can access many of these features from the solution dashboard that deploys as part of the preconfigured solution:
To complete this tutorial, you need an active Azure subscription.
Note
If you don’t have an account, you can create a free trial account in just a couple of minutes. For details, see Azure Free Trial.
Provision the solution
If you haven't already provisioned the remote monitoring preconfigured solution in your account:
- Sign in to azureiotsuite.com using your Azure account credentials, and click + to create a solution.
- Click Select on the Remote monitoring tile.
- Enter a Solution name for your remote monitoring preconfigured solution.
- Select the Region and Subscription you want to use to provision the solution.
- Click Create Solution to begin the provisioning process. This process typically takes several minutes to run.
Wait for the provisioning process to complete
- Click the tile for your solution with Provisioning status.
- Notice the Provisioning states as Azure services are deployed in your Azure subscription.
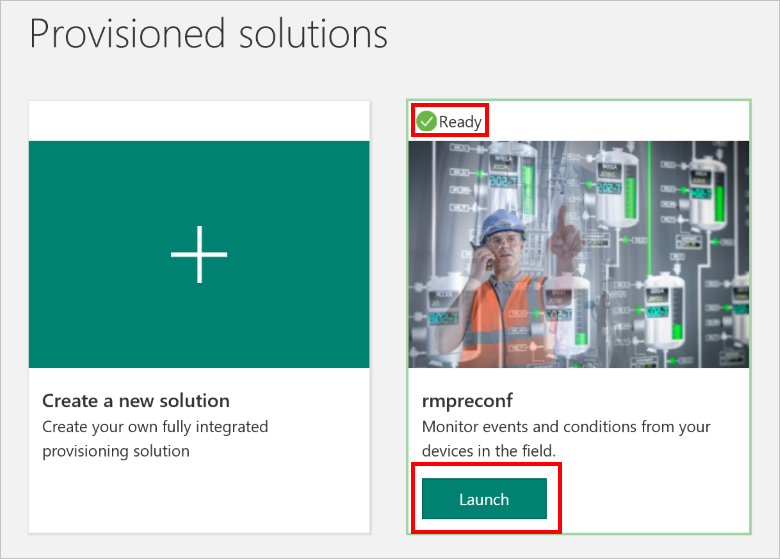
- Once provisioning completes, the status changes to Ready.
- Click the tile to see the details of your solution in the right-hand pane.
Note
If you are encountering issues deploying the pre-configured solution, review Permissions on the azureiotsuite.com site and the FAQ. If the issues persist, create a service ticket on the portal.
Are there details you'd expect to see that aren't listed for your solution? Give us feature suggestions on User Voice.
Scenario overview
When you deploy the remote monitoring preconfigured solution, it is prepopulated with resources that enable you to step through a common remote monitoring scenario. In this scenario, several devices connected to the solution are reporting unexpected temperature values. The following sections show you how to:
- Identify the devices sending unexpected temperature values.
- Configure these devices to send more detailed telemetry.
- Fix the problem by updating the firmware on these devices.
- Verify that your action has resolved the issue.
A key feature of this scenario is that you can perform all these actions remotely from the solution dashboard. You do not need physical access to the devices.
View the solution dashboard
The solution dashboard enables you to manage the deployed solution. For example, you can view telemetry, add devices, and configure rules.
When the provisioning is complete and the tile for your preconfigured solution indicates Ready, choose Launch to open your remote monitoring solution portal in a new tab.
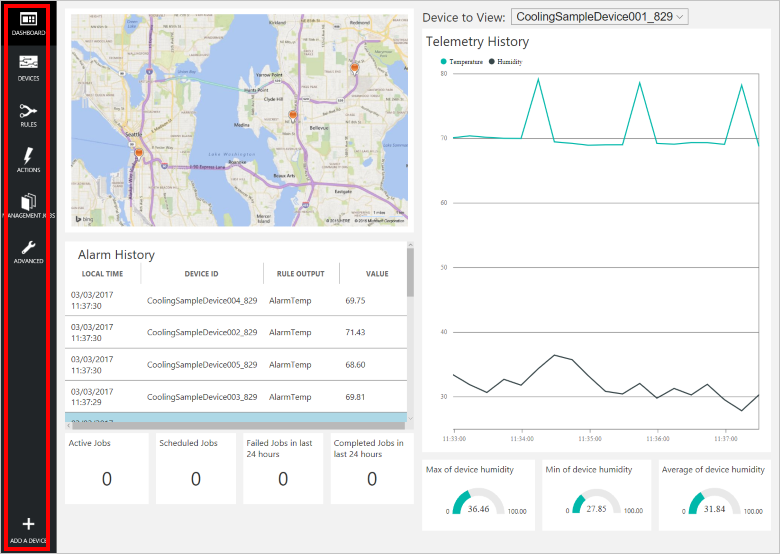
By default, the solution portal shows the dashboard. You can navigate to other areas of the solution portal using the menu on the left-hand side of the page.
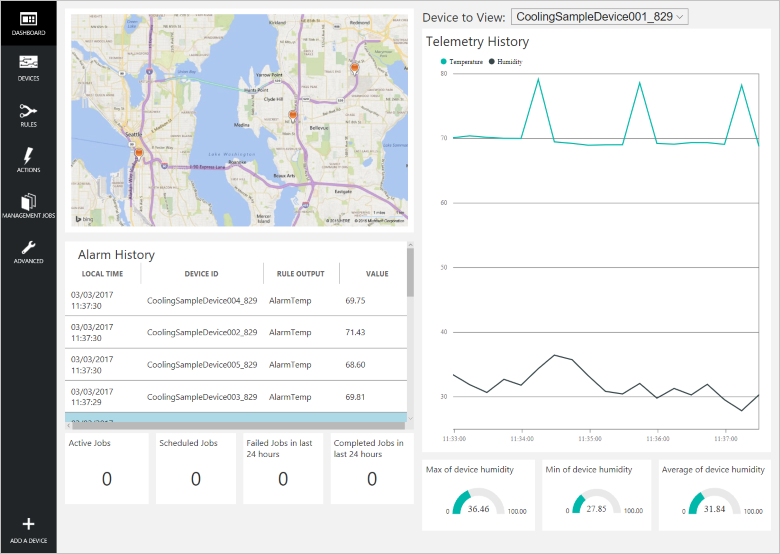
The dashboard displays the following information:
- A map that displays the location of each device connected to the solution. When you first run the solution, there are 25 simulated devices. The simulated devices are implemented as Azure WebJobs, and the solution uses the Bing Maps API to plot information on the map. See the FAQ to learn how to make the map dynamic.
- A Telemetry History panel that plots humidity and temperature telemetry from a selected device in near real time and displays aggregate data such as maximum, minimum, and average humidity.
- An Alarm History panel that shows recent alarm events when a telemetry value has exceeded a threshold. You can define your own alarms in addition to the examples created by the preconfigured solution.
- A Jobs panel that displays information about scheduled jobs. You can schedule your own jobs on Management jobs page.
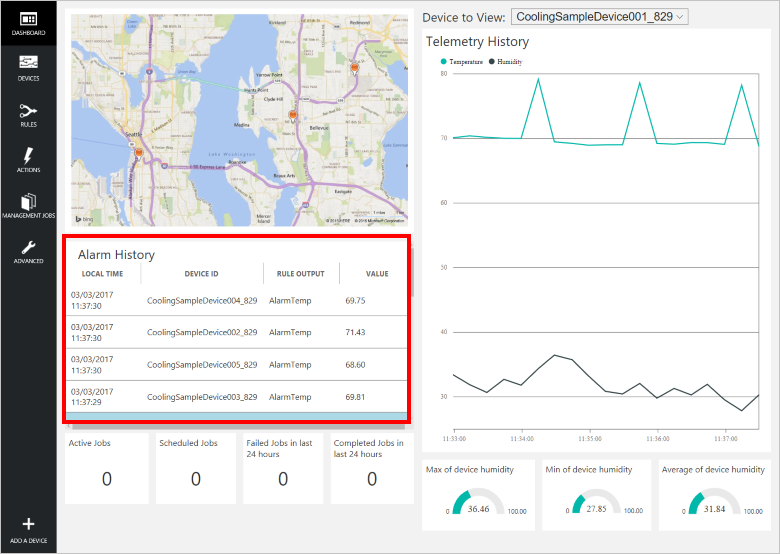
View alarms
The alarm history panel shows you that five devices are reporting higher than expected telemetry values.
Note
These alarms are generated by a rule that is included in the preconfigured solution. This rule generates an alert when the temperature value sent by a device exceeds 60. You can define your own rules and actions by choosing Rules and Actions in the left-hand menu.
View devices
The devices list shows all the registered devices in the solution. From the device list you can view and edit device metadata, add or remove devices, and invoke methods on devices. You can filter and sort the list of devices in the device list. You can also customize the columns shown in the device list.
Choose Devices to show the device list for this solution.
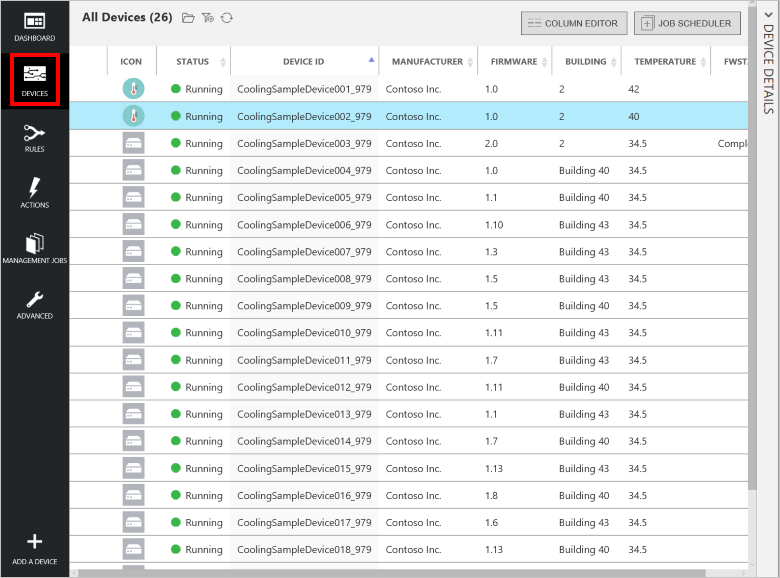
The device list initially shows 25 simulated devices created by the provisioning process. You can add additional simulated and physical devices to the solution.
To view the details of a device, choose a device in the device list.
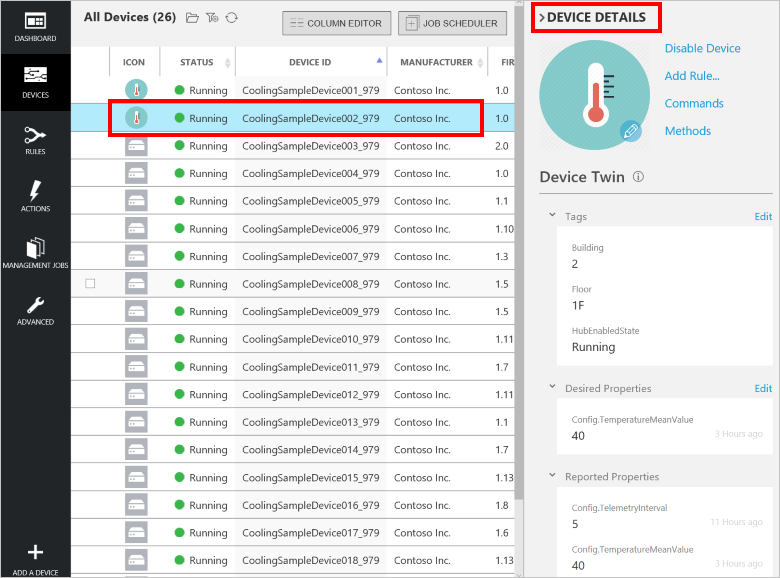
The Device Details panel contains six sections:
- A collection of links that enable you to customize the device icon, disable the device, add a rule, invoke a method, or send a command. For a comparison of commands (device-to-cloud messages) and methods (direct methods), see Cloud-to-device communications guidance.
- The Device Twin - Tags section enables you to edit tag values for the device. You can display tag values in the device list and use tag values to filter the device list.
- The Device Twin - Desired Properties section enables you to set property values to be sent to the device.
- The Device Twin - Reported Properties section shows property values sent from the device.
- The Device Properties section shows information from the identity registry such as the device id and authentication keys.
- The Recent Jobs section shows information about any jobs that have recently targeted this device.
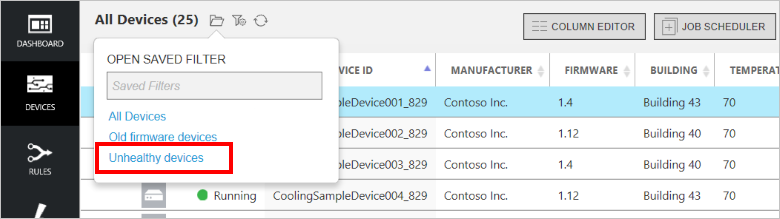
Filter the device list
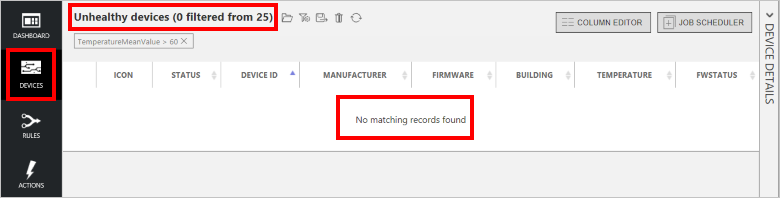
You can use a filter to display only those devices that are sending unexpected temperature values. The remote monitoring preconfigured solution includes the Unhealthy devices filter to show devices with a mean temperature value greater than 60. You can also create your own filters.
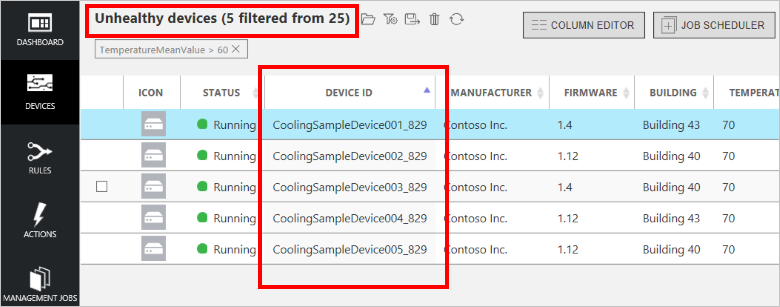
Choose Open saved filter to display a list of available filters. Then choose Unhealthy devices to apply the filter:
The device list now shows only devices with a mean temperature value greater than 60.
Update desired properties
You have now identified a set of devices that may need remediation. However, you decide that the data frequency of 15 seconds is not sufficient for a clear diagnosis of the issue. Changing the telemetry frequency to five seconds to provide you with more data points to better diagnose the issue. You can push this configuration change to your remote devices from the solution portal. You can make the change once, evaluate the impact, and then act on the results.
Follow these steps to run a job that changes the TelemetryInterval desired property for the affected devices. When the devices receive the new TelemetryInterval property value, they change their configuration to send telemetry every five seconds instead of every 15 seconds:
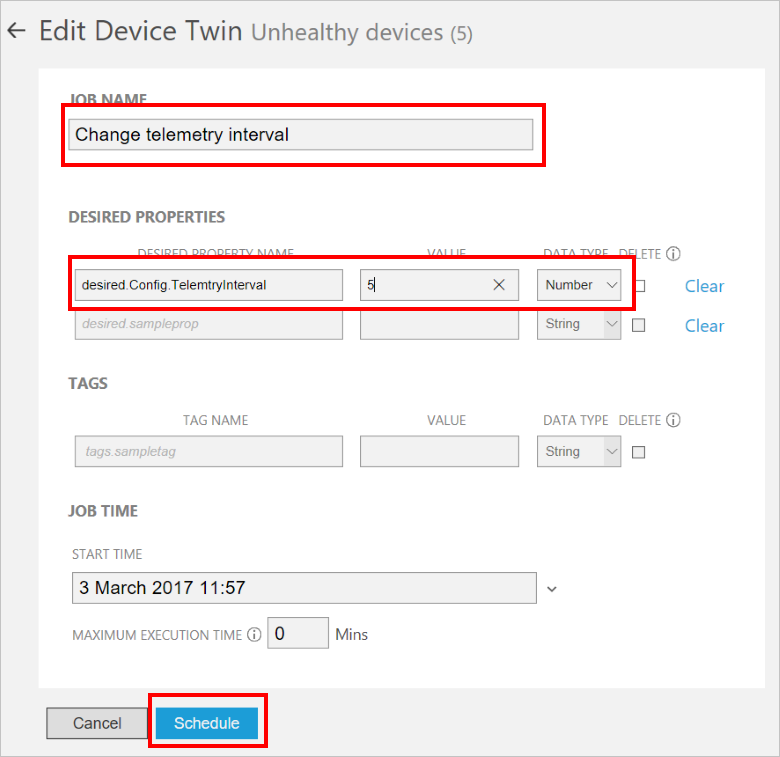
While you are showing the list of unhealthy devices in the device list, choose Job Scheduler, then Edit Device Twin.
Call the job Change telemetry interval.
Change the value of the Desired Property name desired.Config.TelemetryInterval to five seconds.
Choose Schedule.
You can monitor the progress of the job on the Management Jobs page in the portal.
Note
If you want to change a desired property value for an individual device, use the Desired Properties section in the Device Details panel instead of running a job.
This job sets the value of the TelemetryInterval desired property in the device twin for all the devices selected by the filter. The devices retrieve this value from the device twin and update their behavior. When a device retrieves and processes a desired property from a device twin, it sets the corresponding reported value property.
Invoke methods
While the job runs, you notice in the list of unhealthy devices that all these devices have old (less than version 1.6) firmware versions.
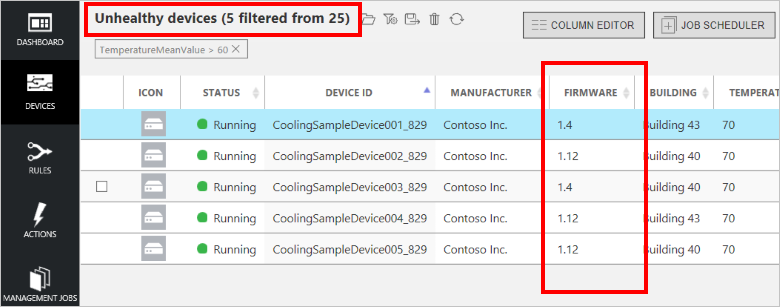
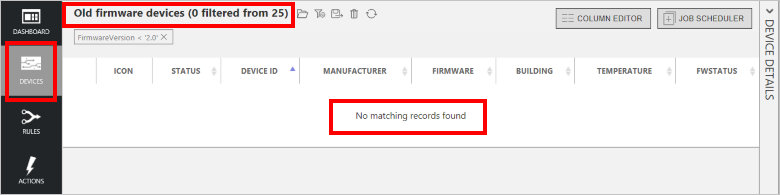
This firmware version may be the root cause of the unexpected temperature values because you know that other healthy devices were recently updated to version 2.0. You can use the built-in Old firmware devices filter to identify any devices with old firmware versions. From the portal, you can then remotely update all the devices still running old firmware versions:
Choose Open saved filter to display a list of available filters. Then choose Old firmware devices to apply the filter:
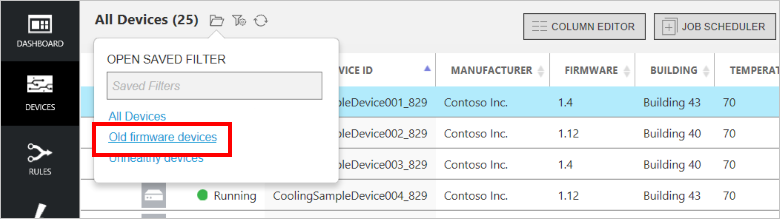
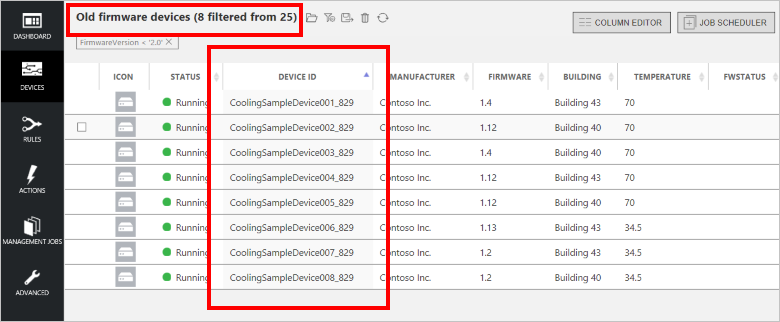
The device list now shows only devices with old firmware versions. This list includes the five devices identified by the Unhealthy devices filter and three additional devices:
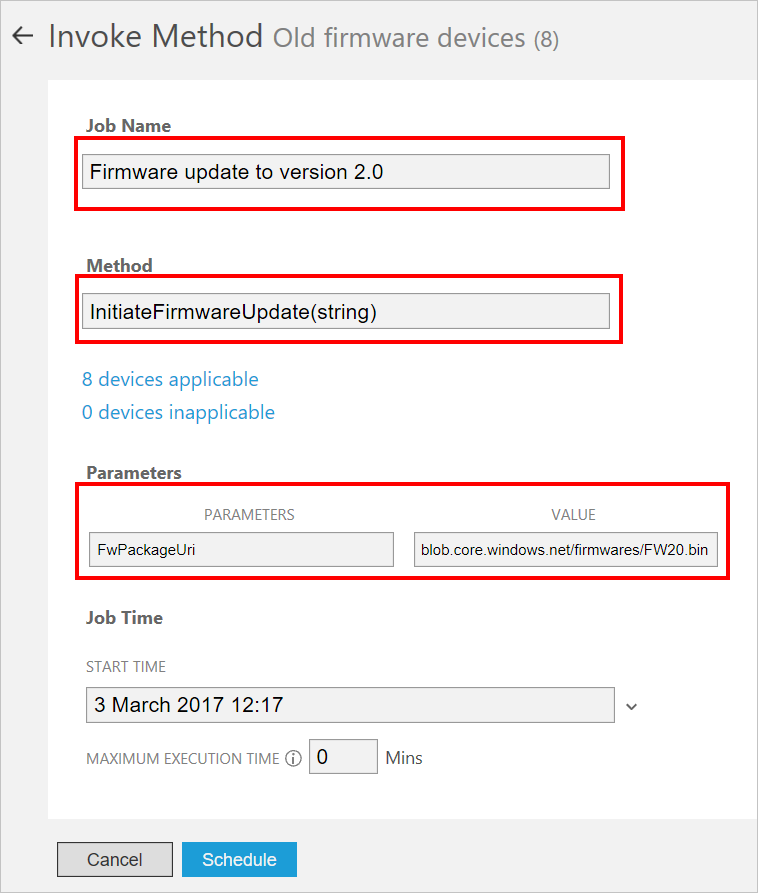
Choose Job Scheduler, then Invoke Method.
Set Job Name to Firmware update to version 2.0.
Choose InitiateFirmwareUpdate as the Method.
Set the FwPackageUri parameter to https://iotrmassets.blob.core.windows.net/firmwares/FW20.bin.
Choose Schedule. The default is for the job to run now.
Note
If you want to invoke a method on an individual device, choose Methods in the Device Details panel instead of running a job.
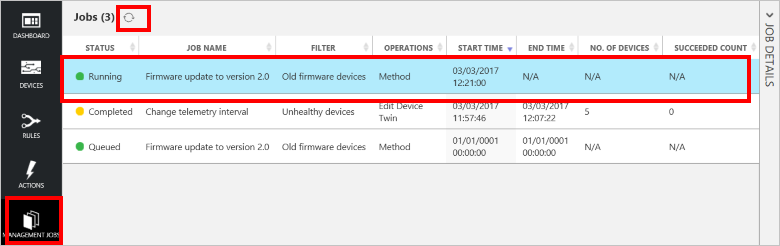
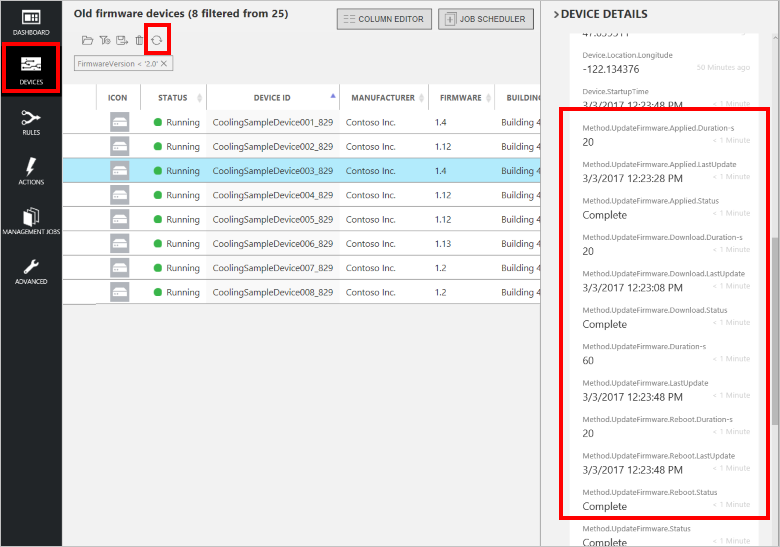
This job invokes the InitiateFirmwareUpdate direct method on all the devices selected by the filter. Devices respond immediately to IoT Hub and then initiate the firmware update process asynchronously. The devices provide status information about the firmware update process through reported property values, as shown in the following screenshots. Choose the Refresh icon to update the information in the device and job lists:
Note
In a production environment, you can schedule jobs to run during a designated maintenance window.
Scenario review
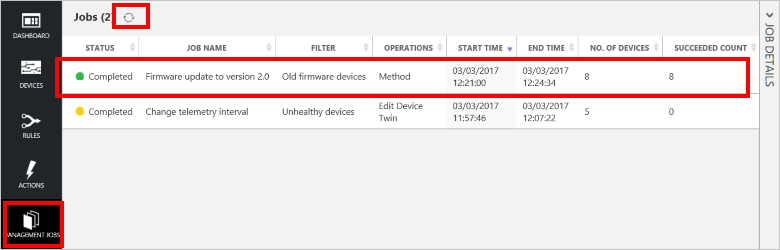
In this scenario, you identified a potential issue with some of your remote devices using the alarm history on the dashboard and a filter. You then used the filter and a job to remotely configure the devices to provide more information to help diagnose the issue. Finally, you used a filter and a job to schedule maintenance on the affected devices. If you return to the dashboard, you can check that there are no longer any alarms coming from devices in your solution. You can use a filter to verify that the firmware is up-to-date on all the devices in your solution and that there are no more unhealthy devices:
Other features
The following sections describe some additional features of the remote monitoring preconfigured solution that are not described as part of the previous scenario.
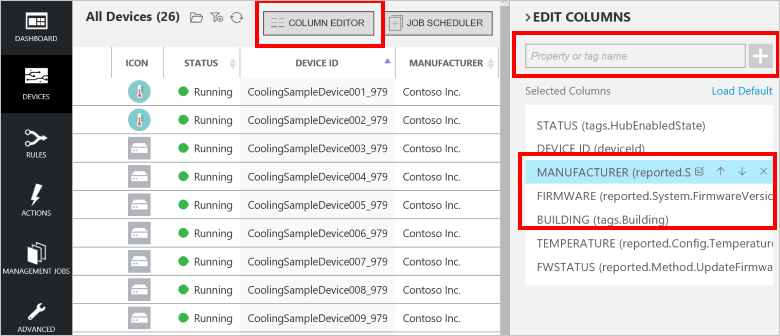
Customize columns
You can customize the information shown in the device list by choosing Column editor. You can add and remove columns that display reported property and tag values. You can also reorder and rename columns:
Customize the device icon
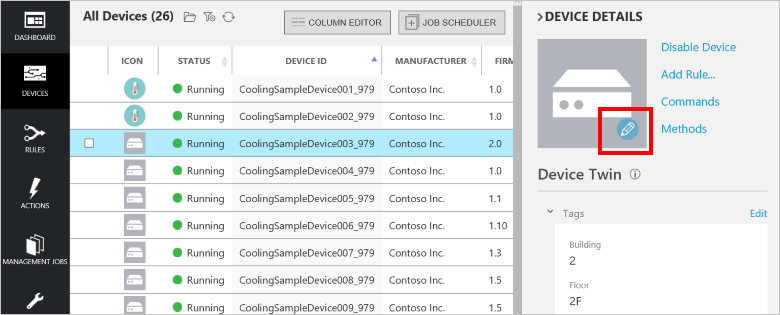
You can customize the device icon displayed in the device list from the Device Details panel as follows:
Choose the pencil icon to open the Edit image panel for a device:
Either upload a new image or use one of the existing images and then choose Save:
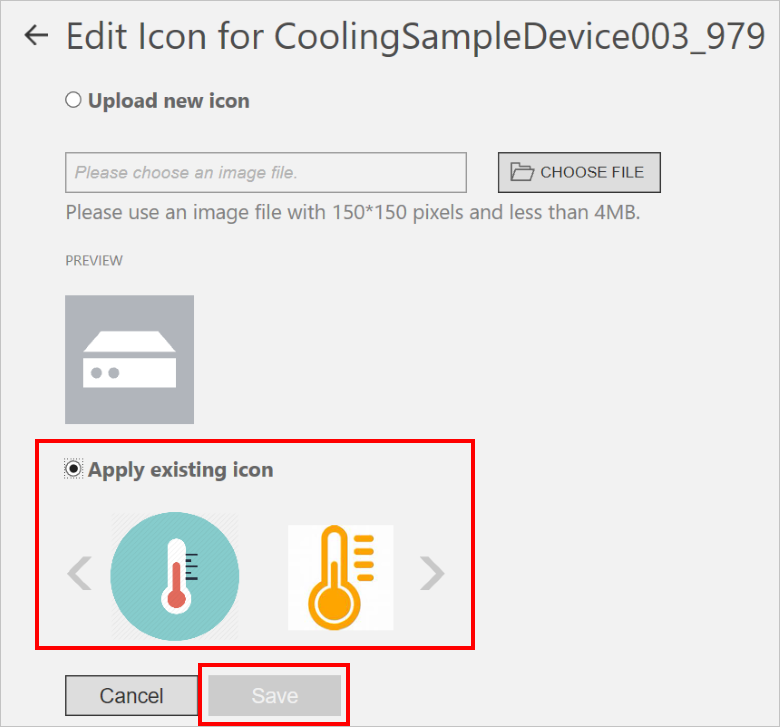
The image you selected now displays in the Icon column for the device.
Note
The image is stored in blob storage. A tag in the device twin contains a link to the image in blob storage.
Add a device
When you deploy the preconfigured solution, you automatically provision 25 sample devices that you can see in the device list. These devices are simulated devices running in an Azure WebJob. Simulated devices make it easy for you to experiment with the preconfigured solution without the need to deploy real, physical devices. If you do want to connect a real device to the solution, see the Connect your device to the remote monitoring preconfigured solution tutorial.
The following steps show you how to add a simulated device to the solution:
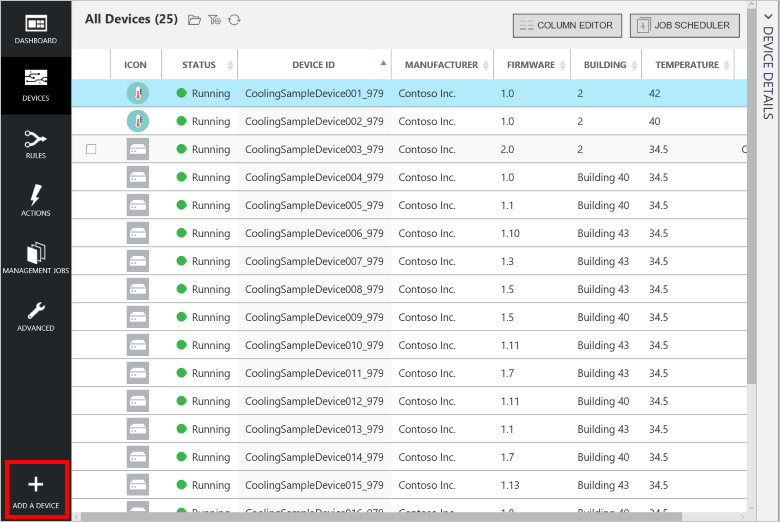
Navigate back to the device list.
To add a device, choose + Add A Device in the bottom left corner.
Choose Add New on the Simulated Device tile.
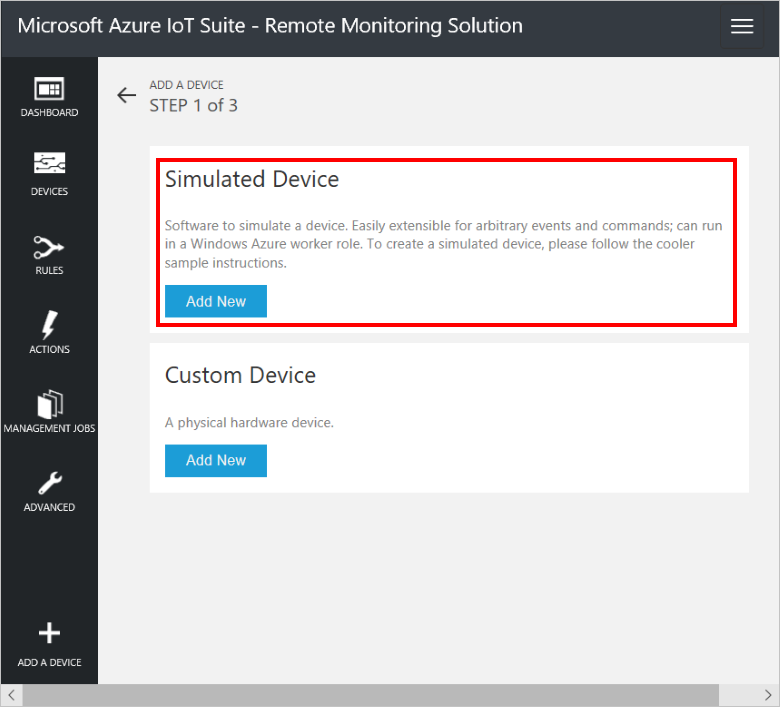
In addition to creating a new simulated device, you can also add a physical device if you choose to create a Custom Device. To learn more about connecting physical devices to the solution, see Connect your device to the IoT Suite remote monitoring preconfigured solution.
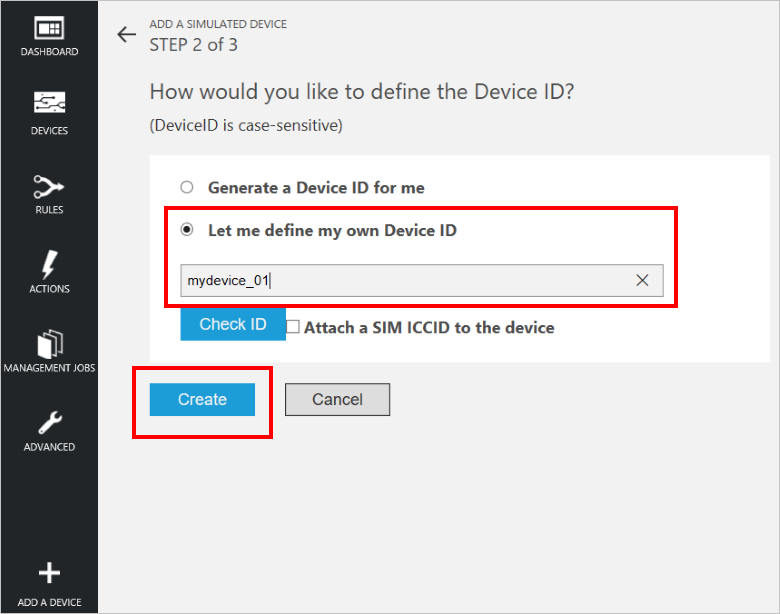
Select Let me define my own Device ID, and enter a unique device ID name such as mydevice_01.
Choose Create.
In step 3 of Add a simulated device, choose Done to return to the device list.
You can view your device Running in the device list.
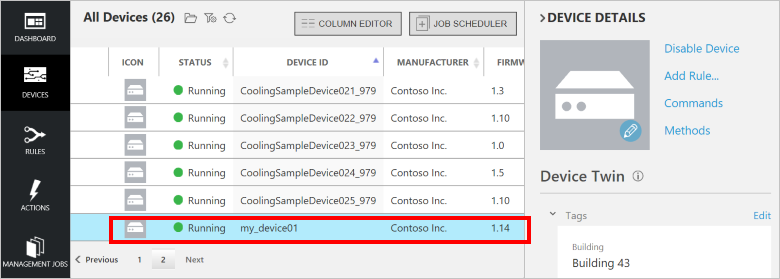
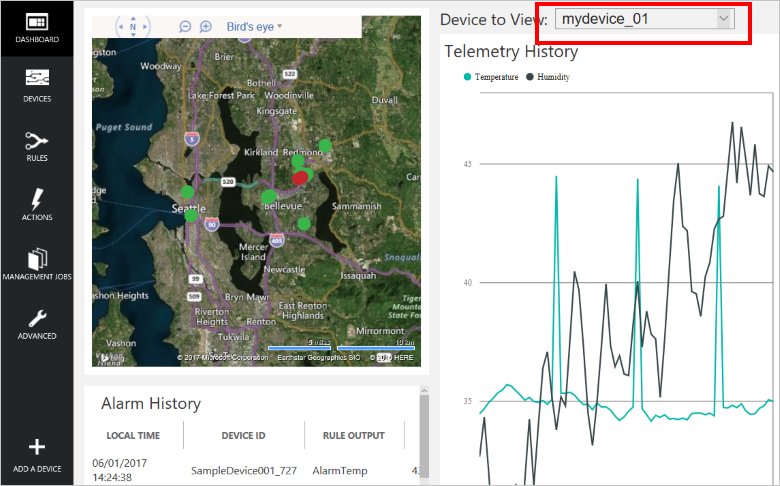
You can also view the simulated telemetry from your new device on the dashboard:
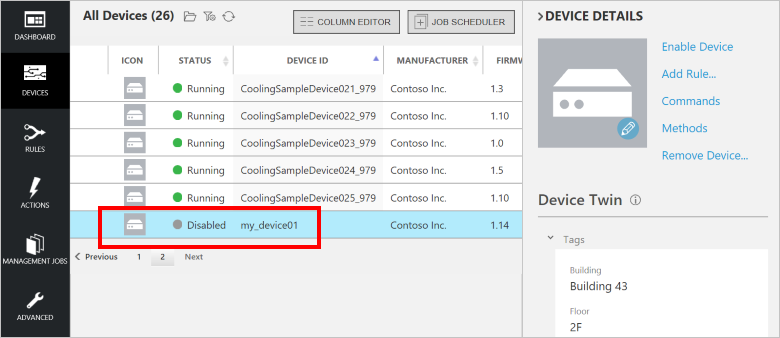
Disable and delete a device
You can disable a device, and after it is disabled you can remove it:
Add a rule
There are no rules for the new device you just added. In this section, you add a rule that triggers an alarm when the temperature reported by the new device exceeds 47 degrees. Before you start, notice that the telemetry history for the new device on the dashboard shows the device temperature never exceeds 45 degrees.
Navigate back to the device list.
To add a rule for the device, select your new device in the Devices List, and then choose Add rule.
Create a rule that uses Temperature as the data field and uses AlarmTemp as the output when the temperature exceeds 47 degrees:
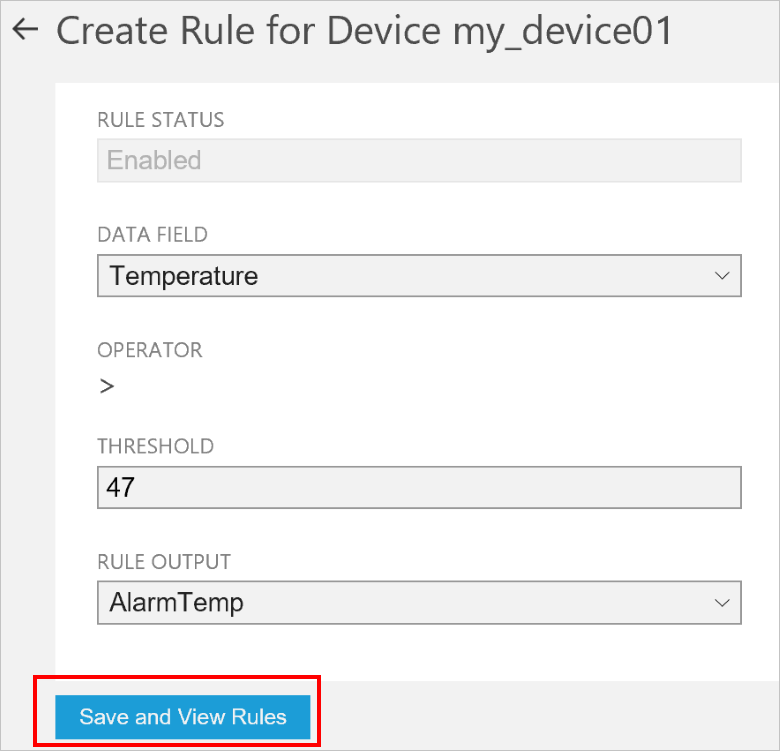
To save your changes, choose Save and View Rules.
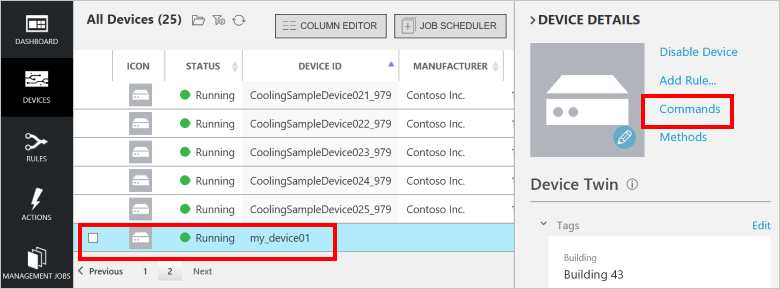
Choose Commands in the device details pane for the new device.
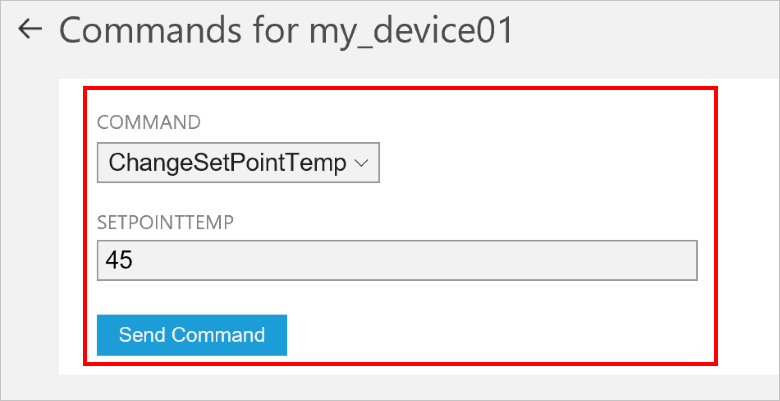
Select ChangeSetPointTemp from the command list and set SetPointTemp to 45. Then choose Send Command:
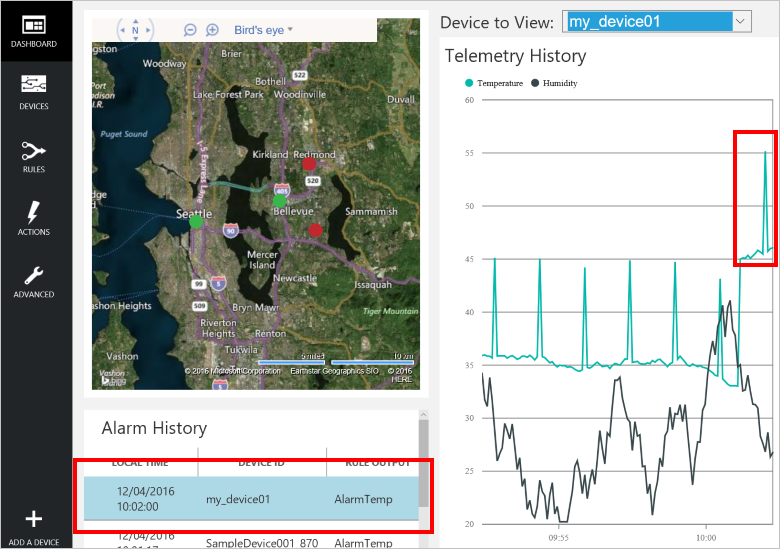
Navigate back to the dashboard. After a short time, you will see a new entry in the Alarm History pane when the temperature reported by your new device exceeds the 47-degree threshold:
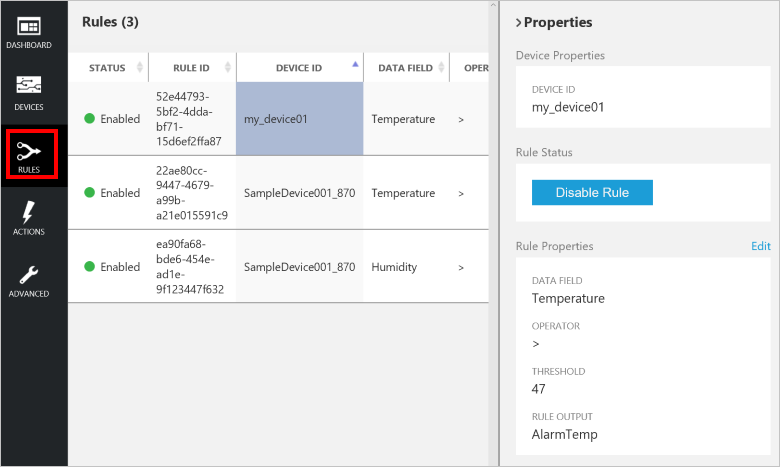
You can review and edit all your rules on the Rules page of the dashboard:
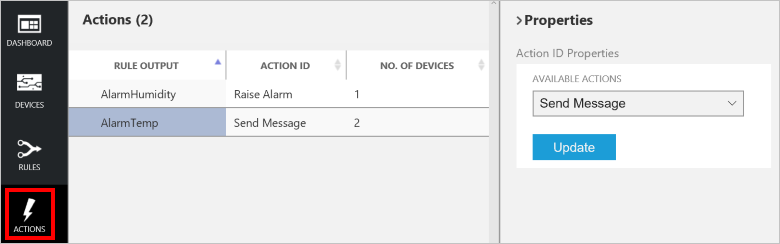
You can review and edit all the actions that can be taken in response to a rule on the Actions page of the dashboard:
Note
It is possible to define actions that can send an email message or SMS in response to a rule or integrate with a line-of-business system through a Logic App. For more information, see the Connect Logic App to your Azure IoT Suite Remote Monitoring preconfigured solution.
Manage filters
In the device list, you can create, save, and reload filters to display a customized list of devices connected to your hub. To create a filter:
Choose the edit filter icon above the list of devices:
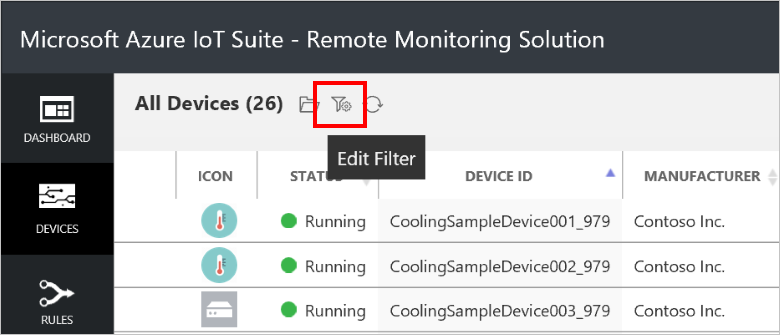
In the Filter editor, add the fields, operators, and values to filter the device list. You can add multiple clauses to refine your filter. Choose Filter to apply the filter:
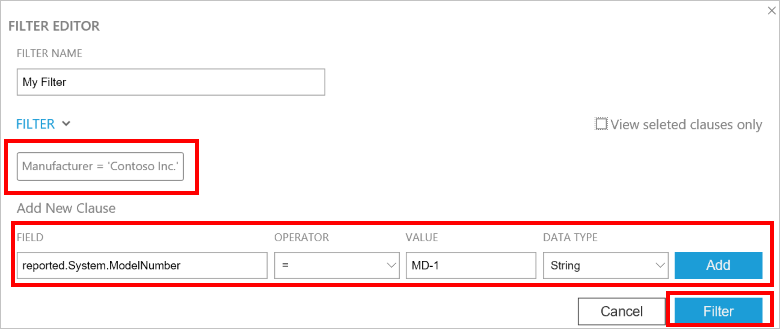
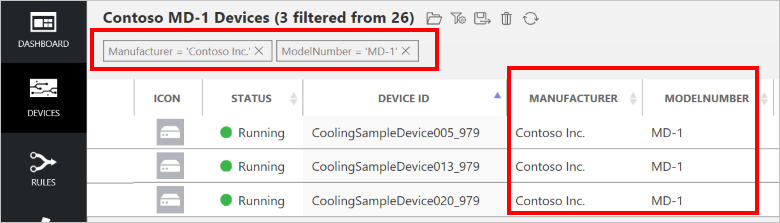
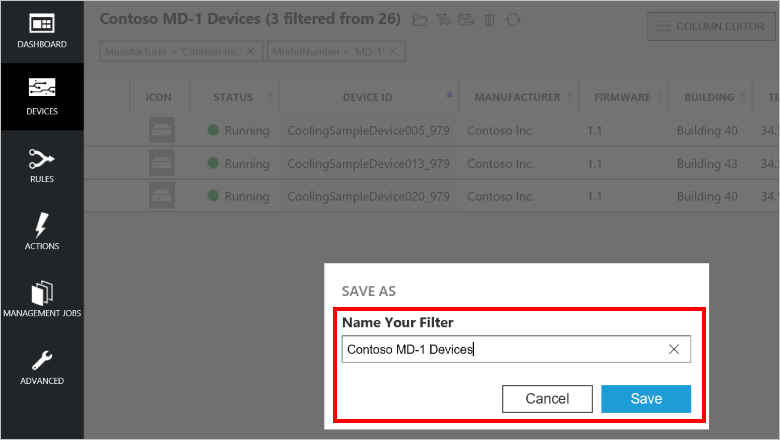
In this example, the list is filtered by manufacturer and model number:
To save your filter with a custom name, choose the Save as icon:
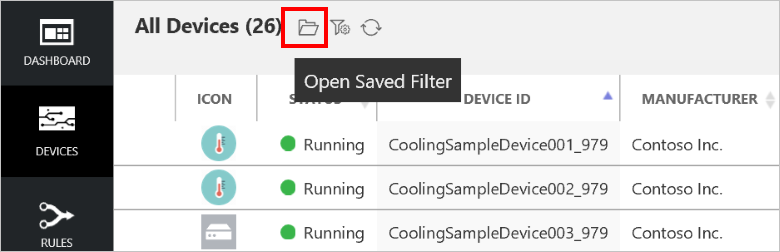
To reapply a filter you saved previously, choose the Open saved filter icon:
You can create filters based on device id, device state, desired properties, reported properties, and tags. You add your own custom tags to a device in the Tags section of the Device Details panel, or run a job to update tags on multiple devices.
Note
In the Filter editor, you can use the Advanced view to edit the query text directly.
Commands
From the Device Details panel, you can send commands to the device. When a device first starts, it sends information about the commands it supports to the solution. For a discussion of the differences between commands and methods, see Azure IoT Hub cloud-to-device options.
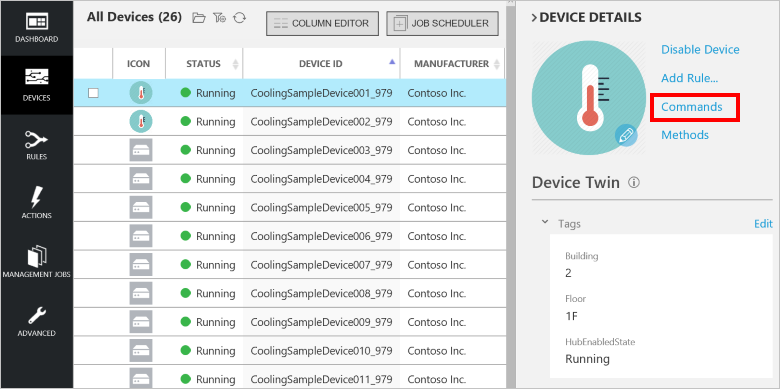
Choose Commands in the Device Details panel for the selected device:
Select PingDevice from the command list.
Choose Send Command.
You can see the status of the command in the command history.
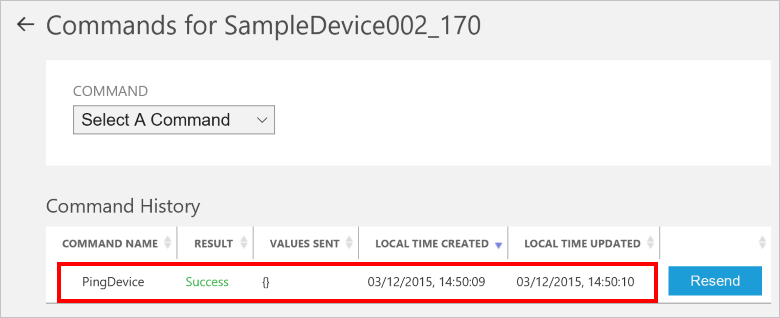
The solution tracks the status of each command it sends. Initially the result is Pending. When the device reports that it has executed the command, the result is set to Success.
Behind the scenes
When you deploy a preconfigured solution, the deployment process creates multiple resources in the Azure subscription you selected. You can view these resources in the Azure portal. The deployment process creates a resource group with a name based on the name you choose for your preconfigured solution:
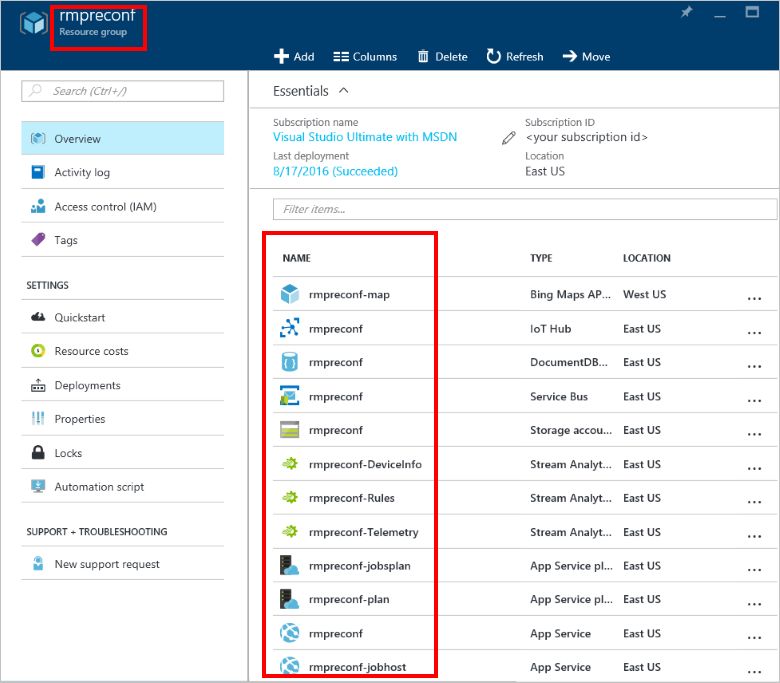
You can view the settings of each resource by selecting it in the list of resources in the resource group.
You can also view the source code for the preconfigured solution. The remote monitoring preconfigured solution source code is in the azure-iot-remote-monitoring GitHub repository:
- The DeviceAdministration folder contains the source code for the dashboard.
- The Simulator folder contains the source code for the simulated device.
- The EventProcessor folder contains the source code for the back-end process that handles the incoming telemetry.
When you are done, you can delete the preconfigured solution from your Azure subscription on the azureiotsuite.com site. This site enables you to easily delete all the resources that were provisioned when you created the preconfigured solution.
Note
To ensure that you delete everything related to the preconfigured solution, delete it on the azureiotsuite.com site and do not delete the resource group in the portal.
Next Steps
Now that you’ve deployed a working preconfigured solution, you can continue getting started with IoT Suite by reading the following articles: