Audit logs, diagnostics, and activity history
This tutorial lists the step-by-step configuration required to enable and capture audit and diagnostics logs for applications in the Microsoft Purview governance portal via Azure Event Hubs.
A Microsoft Purview administrator or Microsoft Purview data-source admin needs the ability to monitor audit and diagnostics logs captured from applications in the Microsoft Purview governance portal. Audit and diagnostics information consists of the timestamped history of actions taken and changes made to a Microsoft Purview account by every user. Captured activity history includes actions in the Microsoft Purview governance portal and outside the portal. Actions outside the portal include calling Microsoft Purview REST APIs to perform write operations.
This tutorial takes you through the steps to enable audit logging. It also shows you how to configure and capture streaming audit events from the Microsoft Purview governance portal via Azure Diagnostics event hubs.
Audit events categories
Some of the important categories of Microsoft Purview governance portal audit events that are currently available for capture and analysis are listed in the table.
More types and categories of activity audit events will be added.
| Category | Activity | Operation |
|---|---|---|
| Management | Collections | Create |
| Management | Collections | Update |
| Management | Collections | Delete |
| Management | Role assignments | Create |
| Management | Role assignments | Update |
| Management | Role assignments | Delete |
| Management | Scan rule set | Create |
| Management | Scan rule set | Update |
| Management | Scan rule set | Delete |
| Management | Classification rule | Create |
| Management | Classification rule | Update |
| Management | Classification rule | Delete |
| Management | Scan | Create |
| Management | Scan | Update |
| Management | Scan | Delete |
| Management | Scan | Run |
| Management | Scan | Cancel |
| Management | Scan | Create |
| Management | Scan | Schedule |
| Management | Data source | Register |
| Management | Data source | Update |
| Management | Data source | Delete |
Enable audit and diagnostics
The following sections walk you through the process of enabling audit and diagnostics.
Configure Event Hubs
Create an Azure Event Hubs namespace by using an Azure Resource Manager (ARM) template (GitHub). This automated Azure ARM template will deploy and finish creating your Event Hubs instance with the required configuration.
For step-by-step explanations and manual setup:
- Event Hubs: Use an ARM template to enable Event Hubs capture
- Event Hubs: Enable capturing of events streaming manually by using the Azure portal
Connect a Microsoft Purview account to Diagnostics event hubs
Now that Event Hubs is deployed and created, connect your Microsoft Purview account diagnostics audit logging to Event Hubs.
Go to your Microsoft Purview account home page. This page is where the overview information is displayed in the Azure portal. It's not the Microsoft Purview governance portal home page.
On the left menu, select Monitoring > Diagnostic settings.

Select Add diagnostic setting or Edit setting. Adding more than one diagnostic setting row in the context of Microsoft Purview isn't recommended. In other words, if you already have a diagnostic setting row, don't select Add diagnostic. Select Edit instead.

Select the audit and allLogs checkboxes to enable collection of audit logs. Optionally, select AllMetrics if you also want to capture Data Map capacity units and Data Map size metrics of the account.
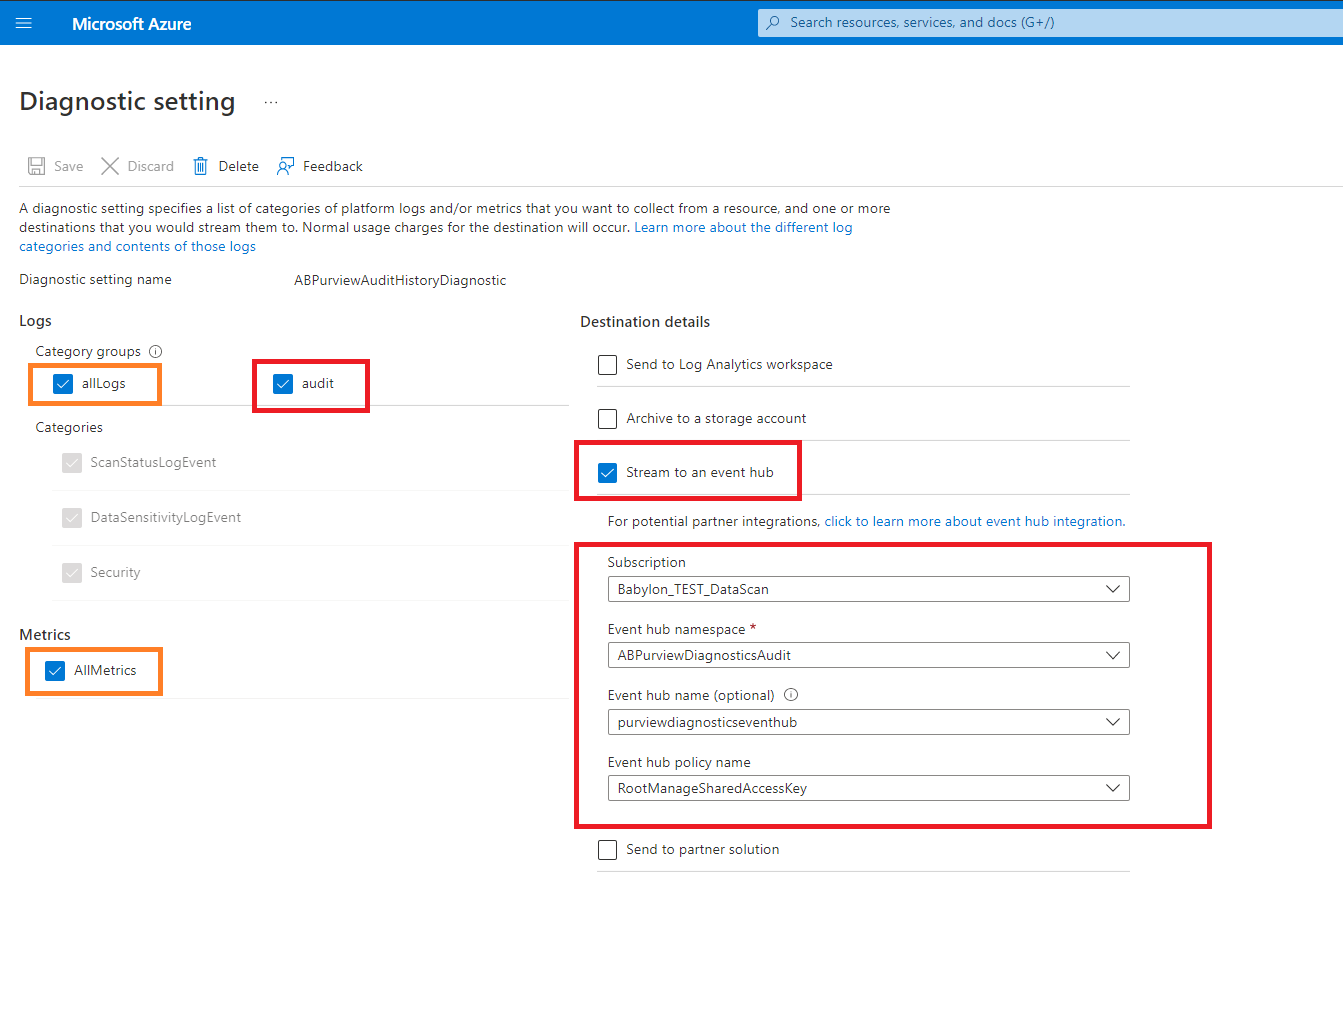


Diagnostics configuration on the Microsoft Purview account is complete.
Now that diagnostics audit logging configuration is complete, configure the data capture and data retention settings for Event Hubs.
Go to the Azure portal home page, and search for the name of the Event Hubs namespace you created earlier.
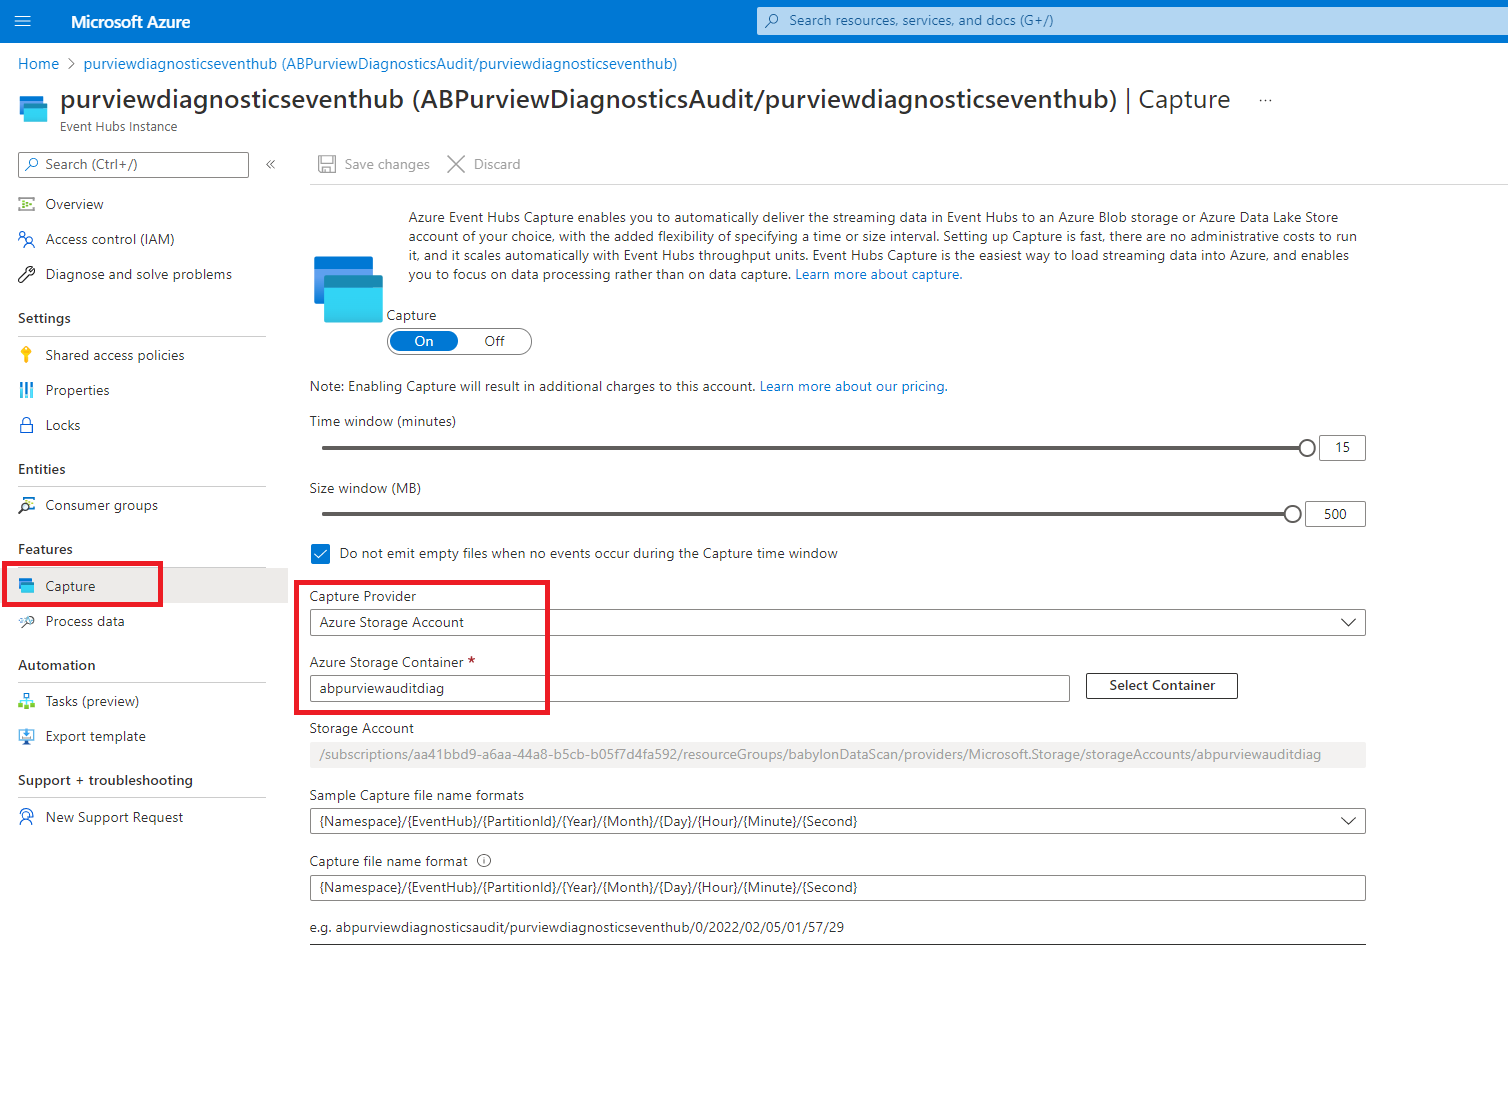
Go to the Event Hubs namespace. Select Event Hubs > Capture Data.
Supply the name of the Event Hubs namespace and the event hub where you want the audit and diagnostics to be captured and streamed. Modify the Time Window and Size Window values for the retention period of the streaming events. Select Save.
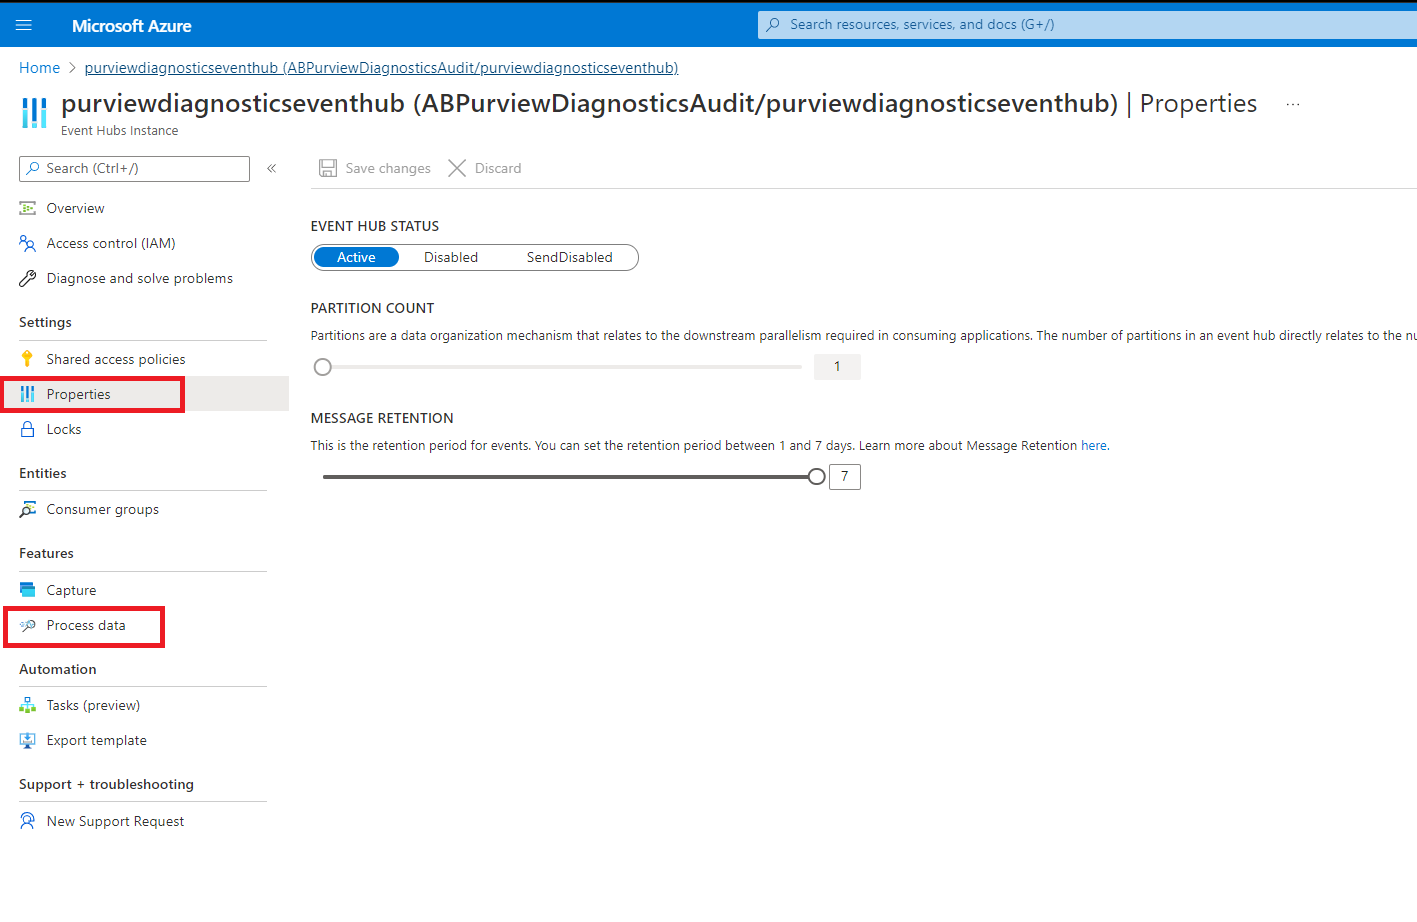
Optionally, on the left menu, go to Properties and change Message Retention to any value between one and seven days. The retention period value depends on the frequency of scheduled jobs or the scripts you've created to continuously listen and capture the streaming events. If you schedule a capture once every week, move the slider to seven days.
At this stage, the Event Hubs configuration is complete. The Microsoft Purview governance portal will start streaming all its audit history and diagnostics data to this event hub. You can now proceed to read, extract, and perform further analytics and operations on the captured diagnostics and audit events.


Read captured audit events
To analyze the captured audit and diagnostics log data:
Go to Process data on the Event Hubs page to see a preview of the captured audit logs and diagnostics.


Switch between the Table and Raw views of the JSON output.

Select Download sample data and analyze the results carefully.


Now that you know how to gather this information, you can use automatic, scheduled scripts to extract, read, and perform further analytics on the Event Hubs audit and diagnostics data. You can even build your own utilities and custom code to extract business value from captured audit events.
These audit logs can also be transformed to Excel, any database, Dataverse, or Synapse Analytics database for analytics and reporting by using Power BI.
While you're free to use any programming or scripting language of your choice to read the event hubs, here's a ready-made Python-based script. See this Python tutorial on how to capture Event Hubs data in Azure Storage and read it by using Python (azure-eventhub).
Next steps
Enable diagnostic audit logging and kickstart your Microsoft Purview journey.
Feedback
Coming soon: Throughout 2024 we will be phasing out GitHub Issues as the feedback mechanism for content and replacing it with a new feedback system. For more information see: https://aka.ms/ContentUserFeedback.
Submit and view feedback for