Configure Microsoft Entra diagnostic settings for activity logs
Using diagnostic settings in Microsoft Entra ID, you can integrate logs with Azure Monitor, stream logs to an event hub, or archive logs to a storage account. You can create multiple diagnostic settings to send activity logs to different destinations.
This article provides the steps to configure Microsoft Entra diagnostic settings for activity logs.
Prerequisites
To configure diagnostic settings, you need:
- An Azure subscription. If you don't have an Azure subscription, you can sign up for a free trial.
- A Microsoft Entra ID P1 or P2 tenant.
- Security Administrator access to create general diagnostic settings for the Microsoft Entra tenant.
- Attribute Log Administrator access to create diagnostic settings for custom security attribute logs.
- A destination that is already set up. For example, if you want to stream logs to an event hub, you need to create the event hub before you can configure the diagnostic settings.
How to access diagnostic settings
This article provides the steps to access diagnostic settings for the Microsoft Entra logs. If you need to configure diagnostic settings for Azure Monitor or Azure resources outside of Microsoft Entra ID, see Diagnostic settings in Azure Monitor.
Sign in to the Microsoft Entra admin center as at least a Security Administrator.
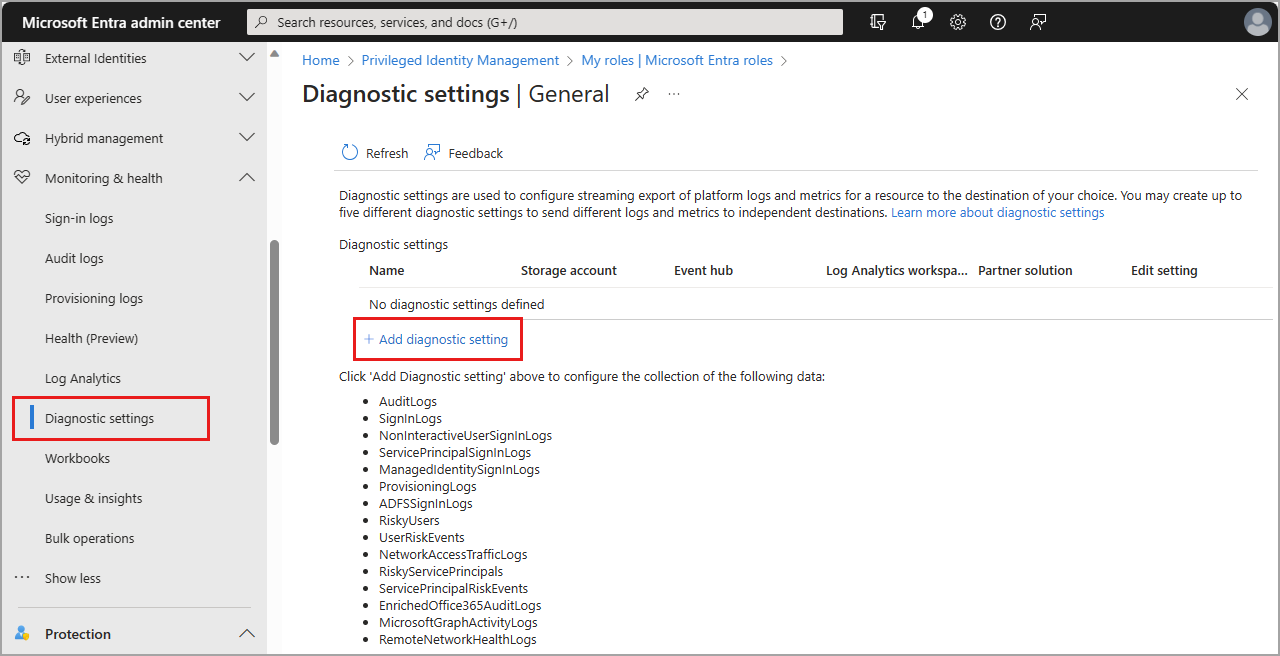
Browse to Identity > Monitoring & health > Diagnostic settings. The General settings appear by default.
Any existing diagnostic settings appear in the table. Select edit settings to change an existing setting, or select Add diagnostic setting to create a new setting.
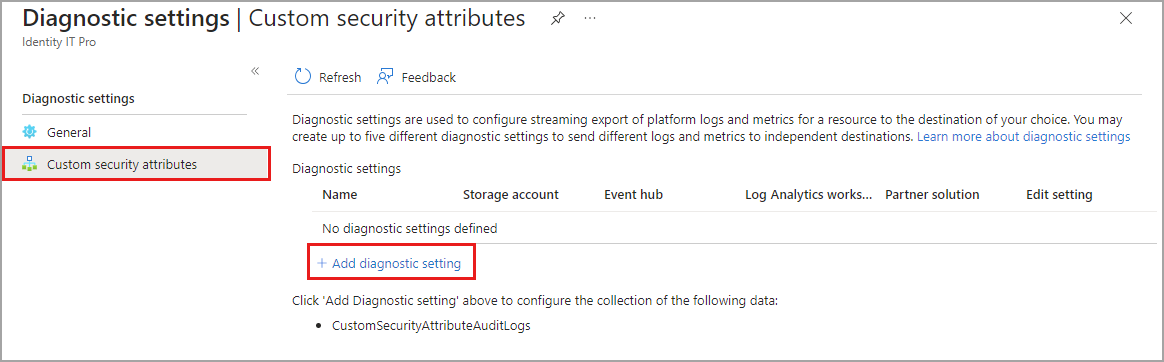
Custom security attributes
The custom security attributes logs are a subset of the standard audit logs. You must have the Attribute Log Administrator role active to configure diagnostic settings for the custom security attributes. For more information, see Custom security attributes overview.
To configure diagnostic settings for the custom security attribute audit logs, select Custom security attributes. The process to configure diagnostic settings is the same for both categories of logs.
Tip
Microsoft recommends that you keep your custom security attribute audit logs separate from your directory audit logs so that attribute assignments are not revealed inadvertently.
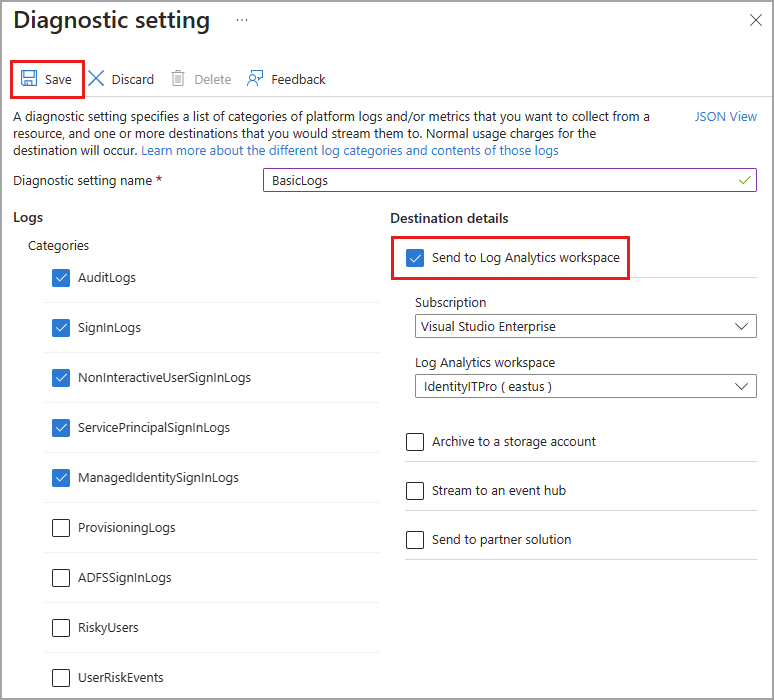
Select the logs and destination
When you create or edit a diagnostic setting, you can choose which logs to include and where to send them.
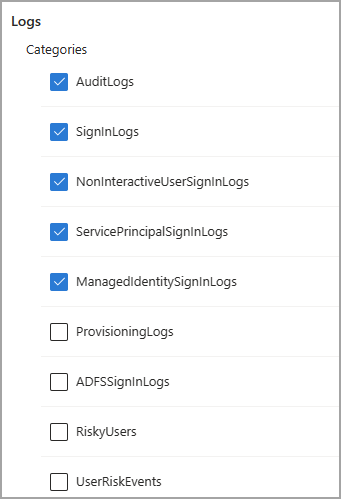
Log categories
You can select one, some, or all of the available logs. Some logs might be part of a preview feature. Even if you select a log category, you might not see any data until the feature is generally available. For a description of the available logs, see Log options for streaming to endpoints.
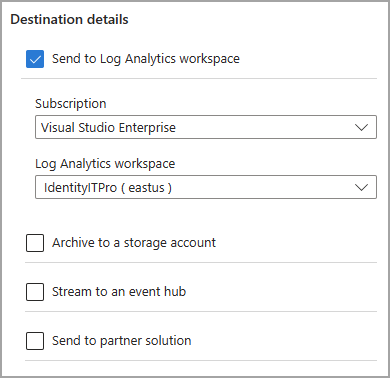
Destination details
You can send logs to a Log Analytics workspace, stream logs to an event hub, or archive logs to a storage account. At this time, the only supported partner solution is Azure Native ISV services. For more information, see Azure Native ISV services overview.
To send your logs to one of the destinations, you must have configured that destination.
When you select a destination, more fields appear. Select the appropriate subscription and destination from the fields that appear.
For details on configuring diagnostic settings for a specific destination, see the following articles:
- Integrate logs with Azure monitor logs
- Stream logs to an event hub
- Archive logs to an Azure storage account
Basic process
The basic steps for configuring diagnostics settings are as follows:
To create a new diagnostic setting, select Add diagnostic setting.
Provide a name.
Select the logs you want to include.
Select the destinations you want to send the logs to.
Select the subscription and the destination from the dropdown menus that appear.
Select the Save button.
Note
It might take up to three days for the logs to start appearing in the destination.
Feedback
Coming soon: Throughout 2024 we will be phasing out GitHub Issues as the feedback mechanism for content and replacing it with a new feedback system. For more information see: https://aka.ms/ContentUserFeedback.
Submit and view feedback for