Add an Excel layout to a report
When you create a new report, there are two main tasks to consider. First, you define the report dataset of data items and columns. Then, you design the report layout.
With the Excel report layout, you can create a basic report that prints a dataset and leave it up to the end-user to modify it further. They can use the full palette of capabilities in Excel such as sliders, diagrams, charts, pivot tables, and PowerQuery to design the report.
This offers flexibility and freedom for the end-user, being able to change the look and feel of a report, adding more views, filtering, and sorting on data. Such a layout designed by the end-user, can be imported and used as a new layout. The following information will help show you how to create a basic report based on an Excel layout.
Let's look at the following report:
report 50101 ExampleEXCELLayout
{
    Caption = 'ExampleEXCELLayout';
    UsageCategory = ReportsAndAnalysis;
    ApplicationArea = All;
    DefaultRenderingLayout = ExampleEXCELLayout;

    dataset
    {
        dataitem(Customer; Customer)
        {
            column(CustomerNo; "No.") { }
            column(CustomerName; Name) { }
            column(City; City) { }
            column(BalanceLCY; "Balance (LCY)") { }
        }
    }

    rendering
    {
        layout(ExampleEXCELLayout)
        {
            Type = Excel;
            LayoutFile = './src/Reports/EXCEL/ExampleEXCELLayout.xlsx';
            Caption = 'ExampleEXCELLayout';
            Summary = 'An example of an EXCEL Layout.';
        }
    }
}
To enable multiple layouts, you must use the rendering section of a report object. Inside the rendering section, you define one or more layout sections. In each of the layout sections, you specify details about the layout file path and name, you provide a Caption property and a Summary property that will be displayed to the user in the Report Layouts page in Business Central.
If you don't specify a caption, the layout name will be displayed to the user.
The default layout can be specified with the DefaultRenderingLayout property report property. This property can't be set on report extension objects, only on report objects.
Reports using the previous property-based layout specification can be converted to use the rendering section by using a code action. To use it, ensure code that actions are switched on in your AL extension settings and place the cursor on any of the old layout properties to use the action. Layouts of type RDLC, Word, Excel, and Custom can be specified with the new rendering syntax.
To generate the layout, build the extension (Ctrl+Shift+B). The ExampleEXCELLayout.xlsx file will be created in the root of the current project.
To open the generated report layout file, right-click the ExampleEXCELLayout.xlsx file and select Open Externally, as shown in the screenshot.

Now, you can edit the layout in Microsoft Excel.
In Excel, you see the layout in this format:

It's important that you don't change the dataset in Excel, only the layout.
In Excel, go to the Insert tab, choose PivotTable, and then choose From Table/Range with the default options of Data and New worksheet. Select the OK button.


From the PivotTable Fields pane to the right, choose a suitable number of fields to add to the report.
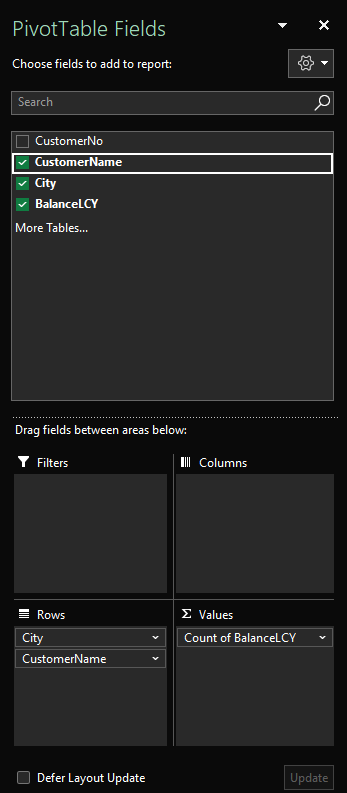
If the Balance LCY field is added as a Count in the Values section of the PivotTable Fields pane, you can change it to a Sum, which makes more sense in this report:

Now close and save the Excel file.
Back in Visual Studio Code, press Ctrl+F5 to compile and launch Business Central.
Now, to choose the changed report layout, search for the Report Layout Selection page, and then search for the report.
In the Layout Type column, choose Excel, and then choose the Run Report from the action bar.
On the request page, choose the Download button, and once the report is downloaded, open it.
Another way of generating the data set to build a layout on, is to run a report in Business Central and on the request page, then select the Microsoft Excel Document (data only) option, and you'll get the same starting point. Then you can design the layout, save as a new layout, and include it in your AL project.
Excel layout data contract in 2023 release wave 1 and earlier versions
Every Excel layout file must have a worksheet called Data. This worksheet has one purpose: defining which metadata fields from the the dataset definition of the report object the layout uses, which is sometimes also called the data contract between the layout file and the report dataset definition. The data contract consists of the following rules:
Metadata fields must be written in the first row of the Data worksheet, one in each cell.
All metadata fields in the Data worksheet must exist as metadata fields in the dataset definition of the report object.
You can't rename fields in the Data worksheet. They must match metadata fields in the dataset definition.
You don't have to use all metadata fields in the dataset definition in the Data worksheet.
When developing Excel layouts, you can add demo data to the Data worksheet to make it easier to see the end result when the report is rendered with the layout. The data is removed when importing it to Business Central but if you include Excel layouts in an app/extension, you might want to keep the demo data there for easier troubleshooting later.
Excel layout data contract in 2023 release wave 2 and later versions
The ExcelLayoutMultipleDataSheets property allows you to work with reports that render multiple worksheets for the report data when the dataset has multiple data items. By setting the property to true, the AL runtime generates an Excel worksheet for each data item and places its data there. Otherwise, if the property is false, which is the default, a single sheet is used for all data (as described in the previous section).
Each of the multiple sheets is named #DataItemName, where DataItemName is the name given to the data item in the report design. When new empty Excel layouts are added to the report, the property is used to determine the sheet structure.

With data in multiple worksheets, the report layout can now easily include data models defined with the PowerPivot feature in Excel.
Validate an Excel layout
When importing an Excel layout as part of an app or when a user uploads an Excel layout file, Business Central Server does the following operations:
Loads the Excel layout file and validates whether the file is indeed an Excel file (.xlsx) and that it isn't password protected. If the file isn't a valid Excel file, Business Central Server rejects the layout.
Reads the metadata fields present in the Data worksheet (the content of the data contract). If no Data worksheet exists, Business Central Server rejects the layout.
Removes any other data present in the Data worksheet.
Validates whether the metadata fields present in the Data worksheet are all present as metadata fields in the dataset definition of the report object. In other words, Business Central Server checks that the data contract is valid. If it isn't, Business Central Server rejects the layout.
Run a report with an Excel layout
When a report with an Excel layout is run, Business Central Server does the following operations:
Generates the dataset as specified in the dataset definition in the report object and modified by the filters and options from the request page.
Loads the Excel layout file.
Inserts the data into the Data table in the Data worksheet in the Excel layout file.
Provides the merged Excel workbook to the user for download or view in Excel online if enabled by the tenant administrator. For more information about viewing Excel outputs in Excel online, visit Save Excel workbooks and report files in OneDrive.
Change the data contract after adding new columns to the report dataset
If you add new columns to the report dataset after you've created Excel layouts, the data contracts in the layouts don't get updated automatically. But you don't need to recreate the layouts from scratch, you can add the new columns manually to the header line in the data contract worksheet.
For a report developer working with AL code, maybe the simplest way to get the new column names is from the AL code for the report object. For a report developer working just in Excel, the simplest way to get the new column names is to run the report in Business Central and on the request page, then choose the Microsoft Excel Document (data only) option. This will give you an Excel workbook with all the columns in the data contract.
Report labels in Excel layouts
Report labels are used by report layouts as, for example, the heading for a field in a table, the title for a chart, or the title for the report itself.
Starting in version 23.3, report labels defined in the Labels section of the report object and captions included on data item columns using the IncludeCaption property are available in the CaptionData worksheet in Excel.
Format data in Excel layouts
It's often desirable to format data in a report in a different way than how the same data appears in tables, queries, or pages. For example, if a decimal field in a table has precision of five digits, the same level of precision might not be needed in the report.
Specifically for Excel layouts, there are many ways to control formatting of data elements directly in Excel. For more examples on how to format data in Excel, see:
Drillthrough to Business Central from an Excel layout
With drillthrough in an Excel layout, you can create hyperlinks back into Business Central from Excel cells. When the report user selects the cell, they drillthrough to the target page to get details that are filtered to that context. To implement a drillthrough link, you need to know which page to open, and also construct which filters to apply to that page. You filter the data that is displayed in the page by using the filter URL parameter. The filter parameter lets you display specific records from the underlying table of the page.
Use fonts in Excel layouts
The online version of Business Central contains preinstalled fonts on the servers that can be used when generating reports. You can use any of these fonts in your layout.
For more information, see Available fonts in Business Central online.
Use Office document themes in Excel layouts
Office document themes make it easy to coordinate colors, fonts, and graphic formatting effects across your Word and Excel layouts and quickly update them.
For more information, see Change a theme and make it the default in Word or Excel.