Apply filters to reports
Scenario
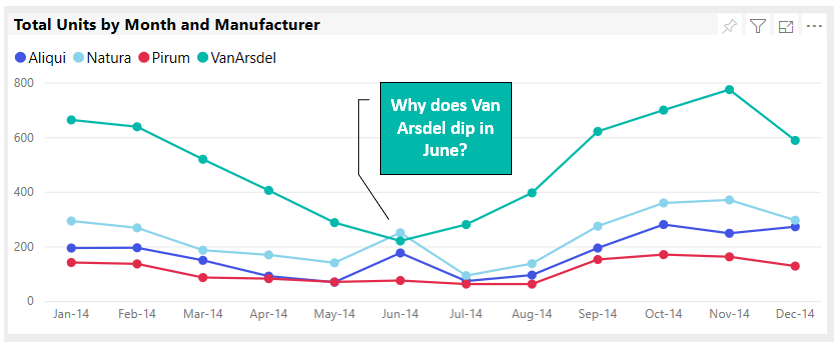
Congratulations. You are the new sales manager at a clothing manufacturing company named Van Arsdel. Your first assignment is to analyze your sales and marketing data to find why there is an unexpected dip in June sales.
Procedure
Add the Sales and Marketing Sample app
Note
If you already have the Sales and Marketing sample app installed, please skip to the next section.
Sign in to https://app.powerbi.com.
Select the Apps tab on the left.
Select the Get apps button.
Search for “Retail Analysis.”
Select the “Get it now” link and wait for the app to install.
From the Install this Power BI app? prompt, select the Install button.
From the Get started with your new app screen, select the Explore App button.
Select the Apps tab on the left and then select the Sales and Marketing sample app tile.
The first time you launch the app, you will see Get started with your new app
Select the Explore app button to explore the dashboard.
Apply a filter to a report page
In this section, you will explore two questions:
- Why did our company, VanArsdel, underperform in June?
- What are our best growth opportunities?
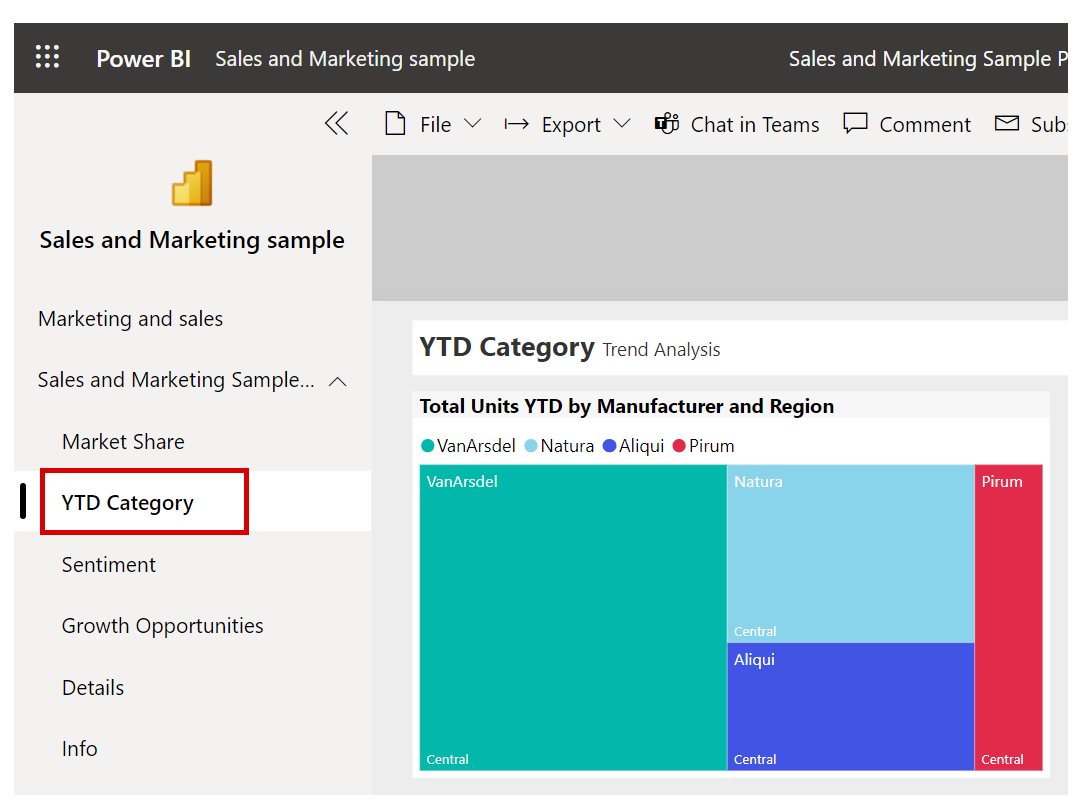
In the Sales and Marketing sample app, start on the YTD Category report page by selecting the YTD Category tab at the left of the screen.
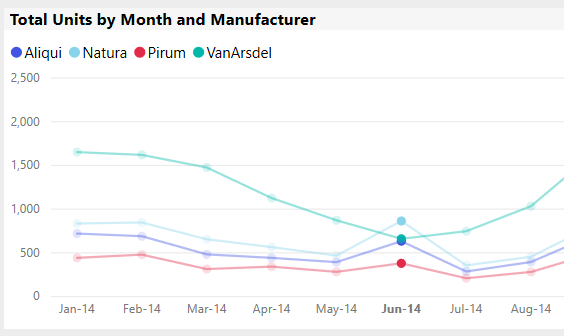
Notice the anomaly in the Total Units by Month and Manufacturer chart.
If it is not already open, open the Filters pane by selecting Filters from the right side of your report.
Power BI displays all filters that the report designer applied to that visual.
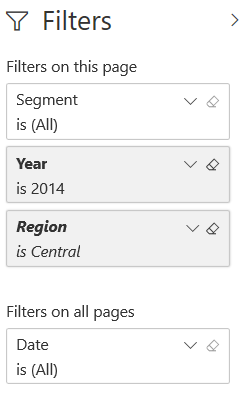
The report designer filtered for Van Arsdel and our top three competitors and for the year 2014. That is good but she also filtered for the Central region and you want to see all of the regions. Clear the Region filter by clicking the eraser icon on that filter.

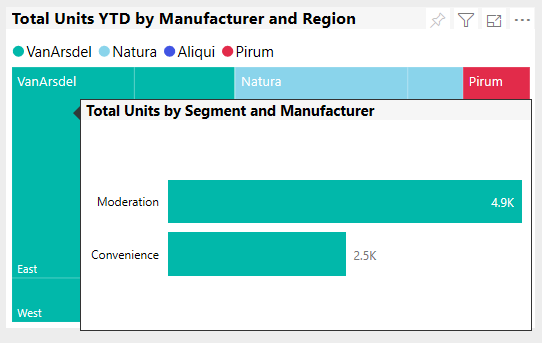
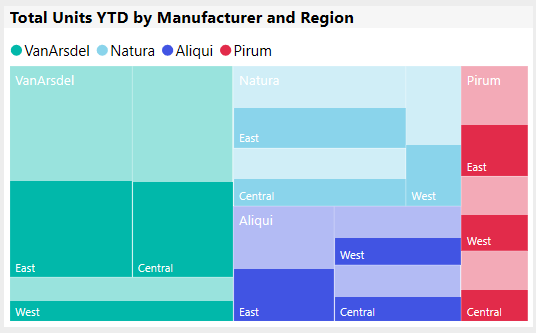
Mouse over the Total Units YTD by Manufacturer and Region and note which segments in which Van Arsdel competes. Note that we compete in Moderation and Convenience.
Hover over our competitors to see segments in which they compete. Do you see any patterns?
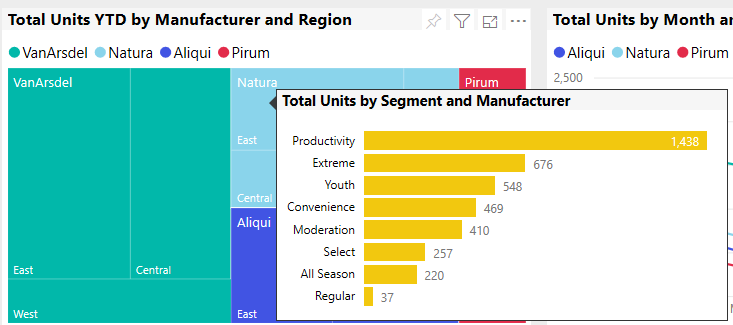
Explore the same question just for the month of June. To cross-filter this report page for June, in the Total Units by Month and Manufacturer visual, click on the label June-14. Notice that all of the visuals in this report page update for June.
Notice the cross-highlighting of the Total Units YTD by Manufacturer and Region visual.
Hover over each company to see the pattern of segments during June.
What can you conclude about the two most successful segments in June and why are our total sales dipping during that time?
To explore the same question in a different way: go to the Growth Opportunities report by selecting the Growth Opportunities tab.
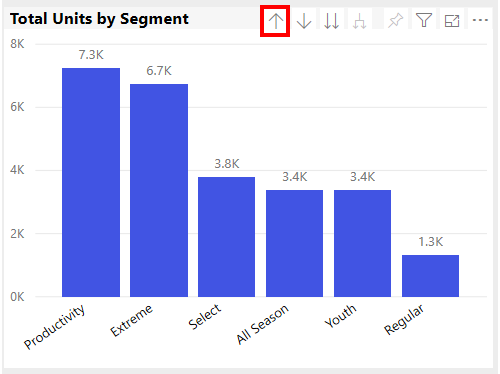
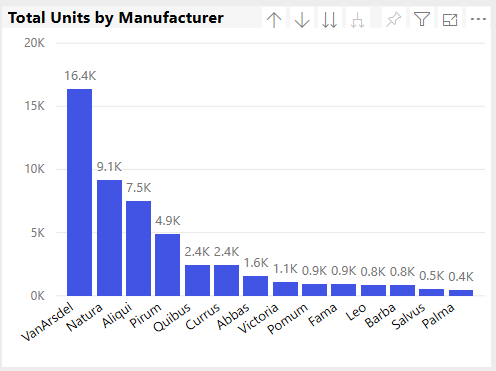
Hover over the Total Units by Segment bar chart visual and then select the "Drill Up" icon (the up arrow) to see "Total Units by Manufacturer".
Clear the isVanArsdel and the Segment filters by clicking the eraser icons. This will allow us to see all of the companies and segments. Notice that Van Arsdel is the leading manufacturer overall.
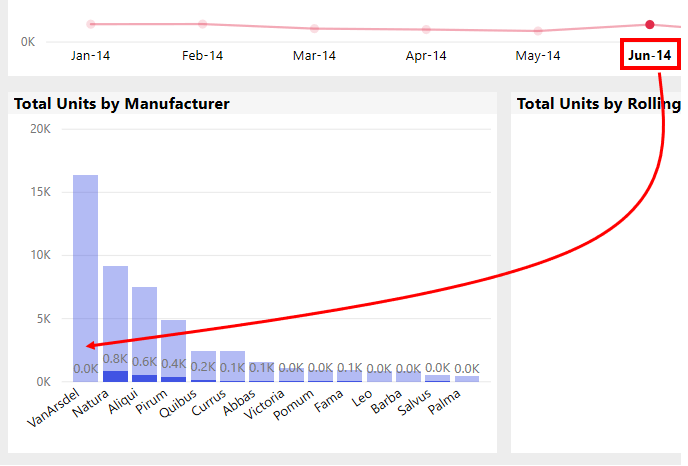
Cross-filter for June on the Total Units and Total Units by R12Ms by Month visual by selecting June-14. Notice once again how Van Arsdel did in June.
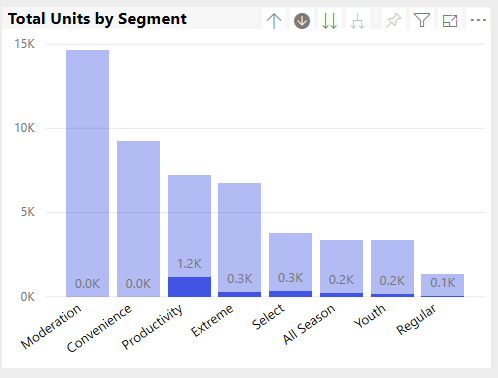
Drill down to view segments in June by clicking the "Click to turn on Drill Down" icon and then the "Go to the next level in the hierarchy" icon.

Once again, what segments are the most successful in June.
Why are Van Arsdel sales failing in June? What could we do to better compete?