Power BI
Microsoft Power BI is a suite of business analytics tools that deliver insights throughout your organization. Power BI helps connect to hundreds of data sources, simplifies data preparation, and drives ad-hoc analysis. By using the tools that Power BI provides, you can produce beautiful reports and then publish them so that your organization can consume them on the web and across mobile devices.
Everyone can create personalized dashboards that:
Give them a unique, 360-degree view of their business
Scale across the enterprise
Have governance and security built-in
These features and tools are all available through PowerBI.com. Not only can you create custom dashboards, but there are preconfigured Power BI dashboards that have been created specifically for Microsoft Dynamics 365 Sales and Microsoft Dynamics 365 for Customer Service.
There are several benefits to using Power BI to help analyze of Microsoft Dynamics 365 data. Because it's a complete enterprise analytics application, it has its own ecosystem. Content packs that are available for Power BI connect to hundreds of different data sources, including Dynamics 365. Therefore, it's easy to get connected and get meaningful data right away.
Additionally, Power BI reports and dashboards can be extended to accommodate various use cases.
Microsoft Dynamics 365 Online for Power BI lets you easily access and analyze your data. Power BI uses the Open Data Protocol (OData) feed to create a descriptive model that includes all the tables and measures that are needed, like:
Accounts
Activities
Opportunities
Products
Leads
Users
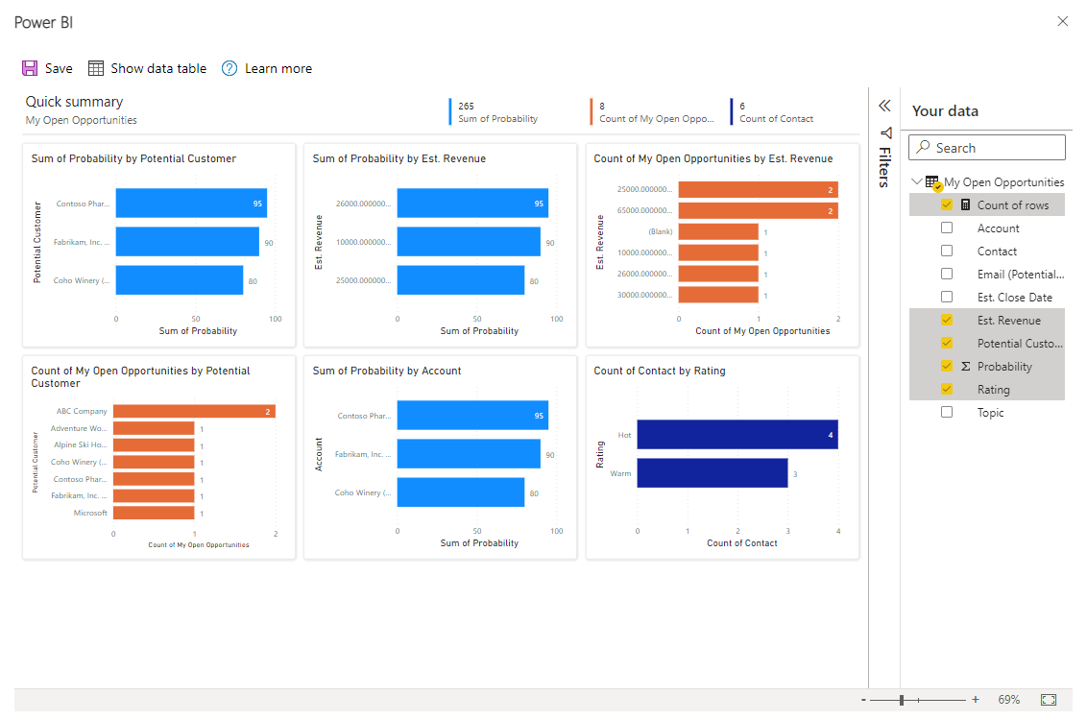
After you install the app, you can view the dashboard and reports in the Power BI service, and in Power BI Mobile. The dashboard and reports are meant to provide operational reporting about near-term data, where the focus is on a specific team or group. Each query can retrieve a maximum of 100,000 records from Dynamics 365 Online.
Visualize with Power BI
Sellers working want to be able to easily analyze data so they can make more targeted decisions. The Visualize with Power BI provides sellers with an easy way to take advantage of the data analysis options available with Power BI without needing to know how to build Power BI reports. For example, let’s say that you're working with your opportunities, and would like to dive a little deeper. By selecting the Visualize this view button, Power BI will be loaded inside your Dynamics 365 Sales application.
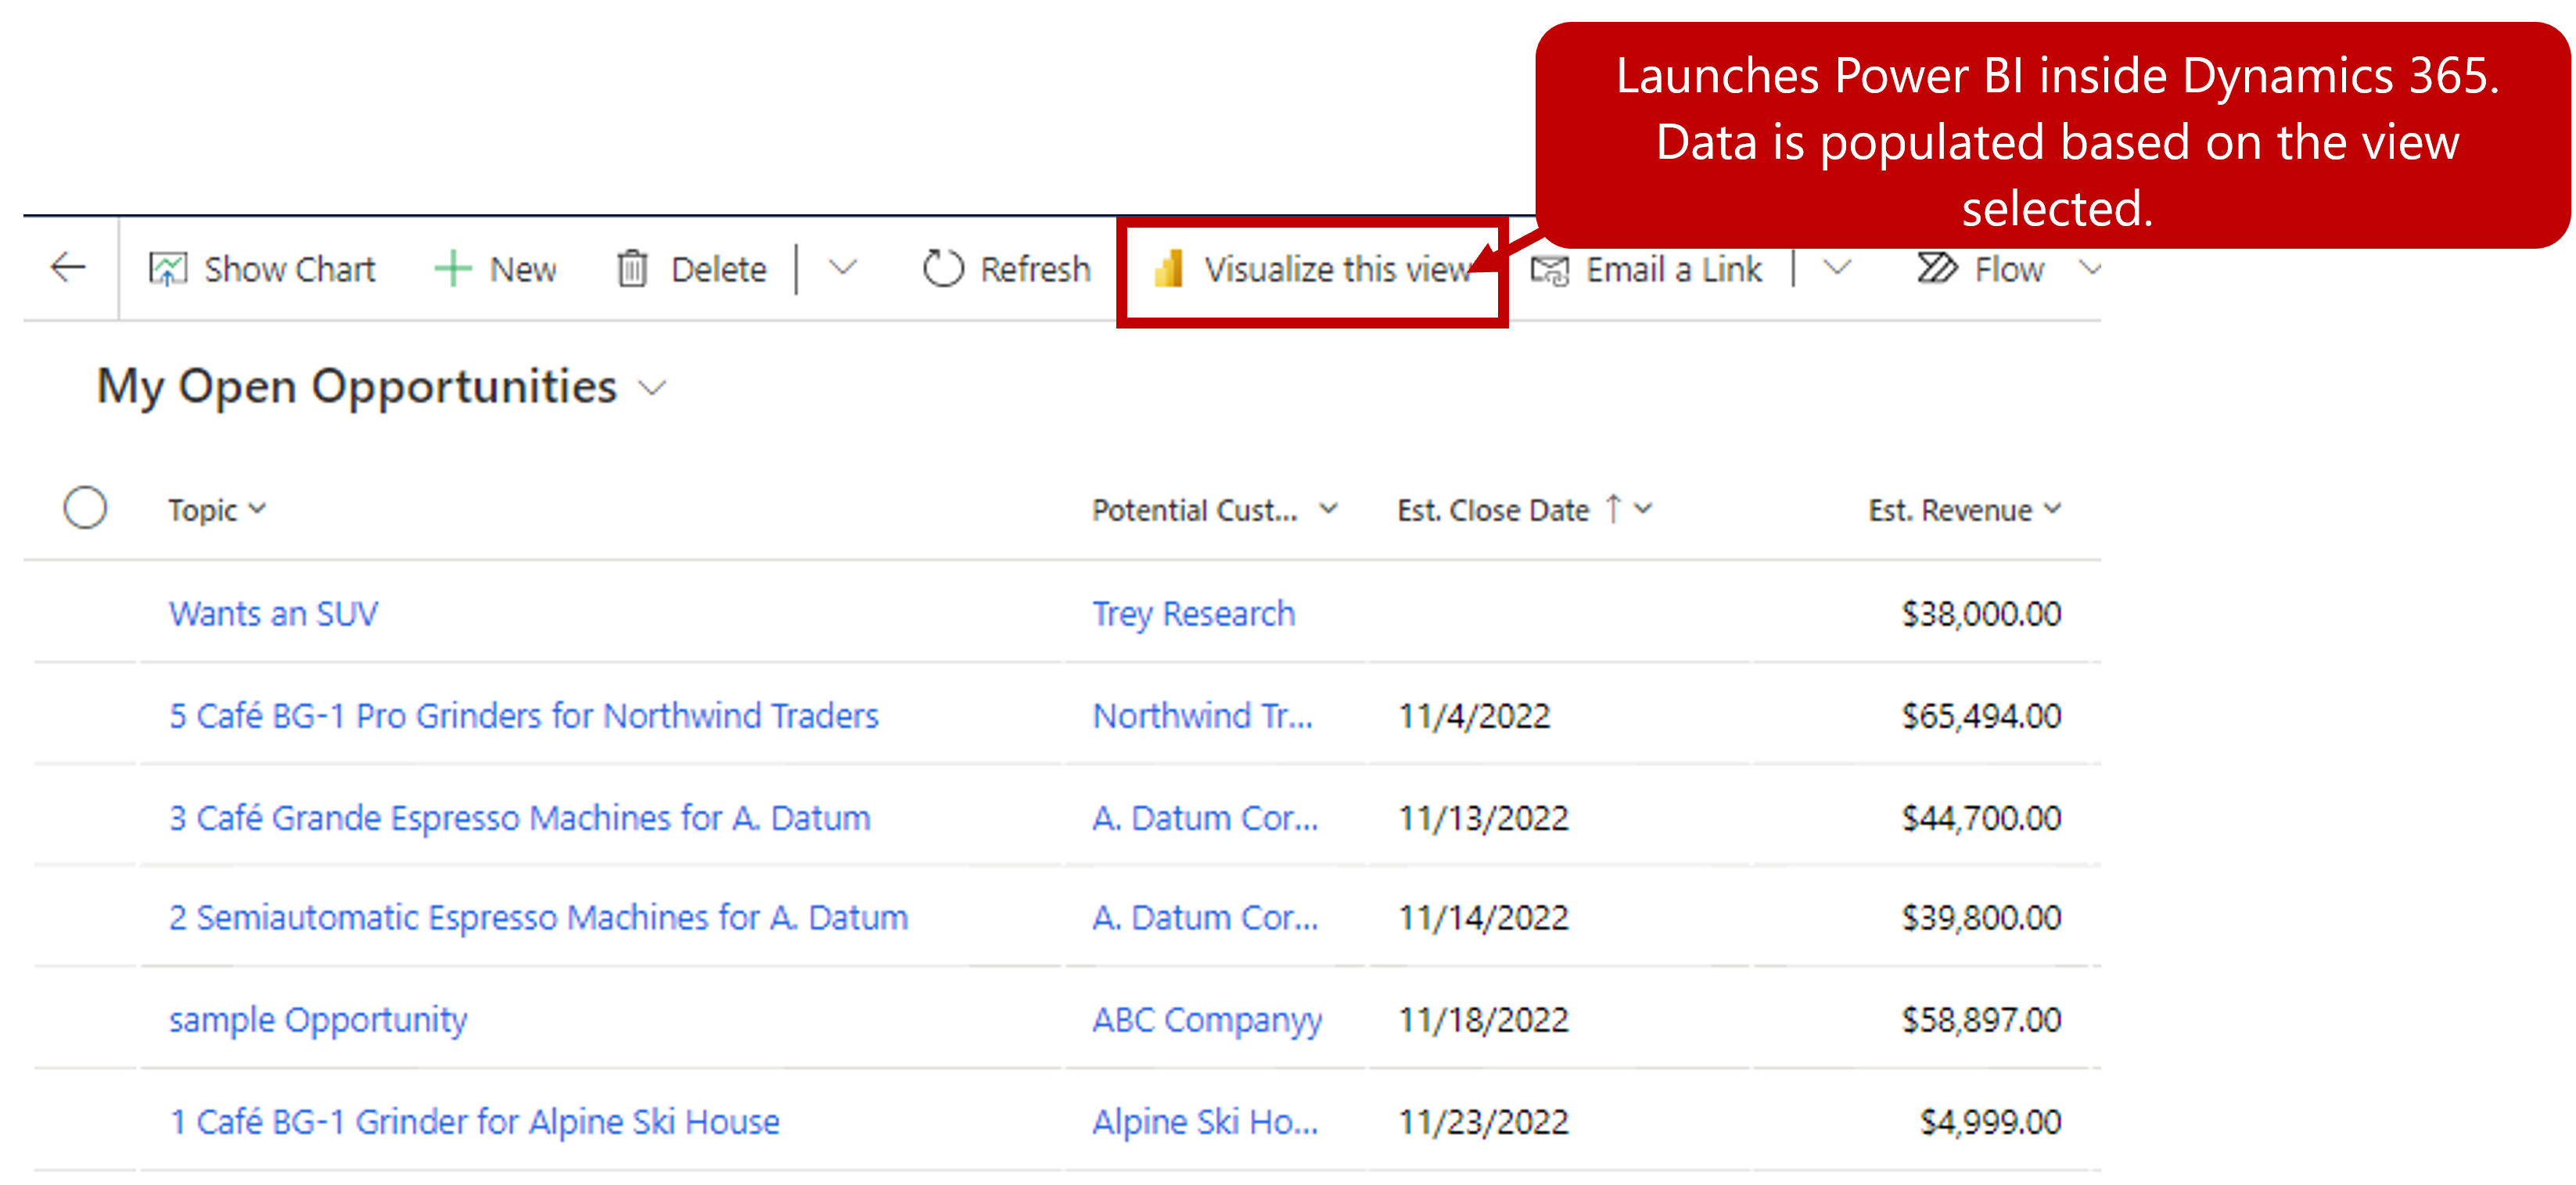
Power BI-generates visuals of the data in your view, based on the view definition. That is, the filters acting on the view are automatically applied to the Power BI visualization. A subset of columns that are part of the view are used to auto-generate the Power BI visuals.
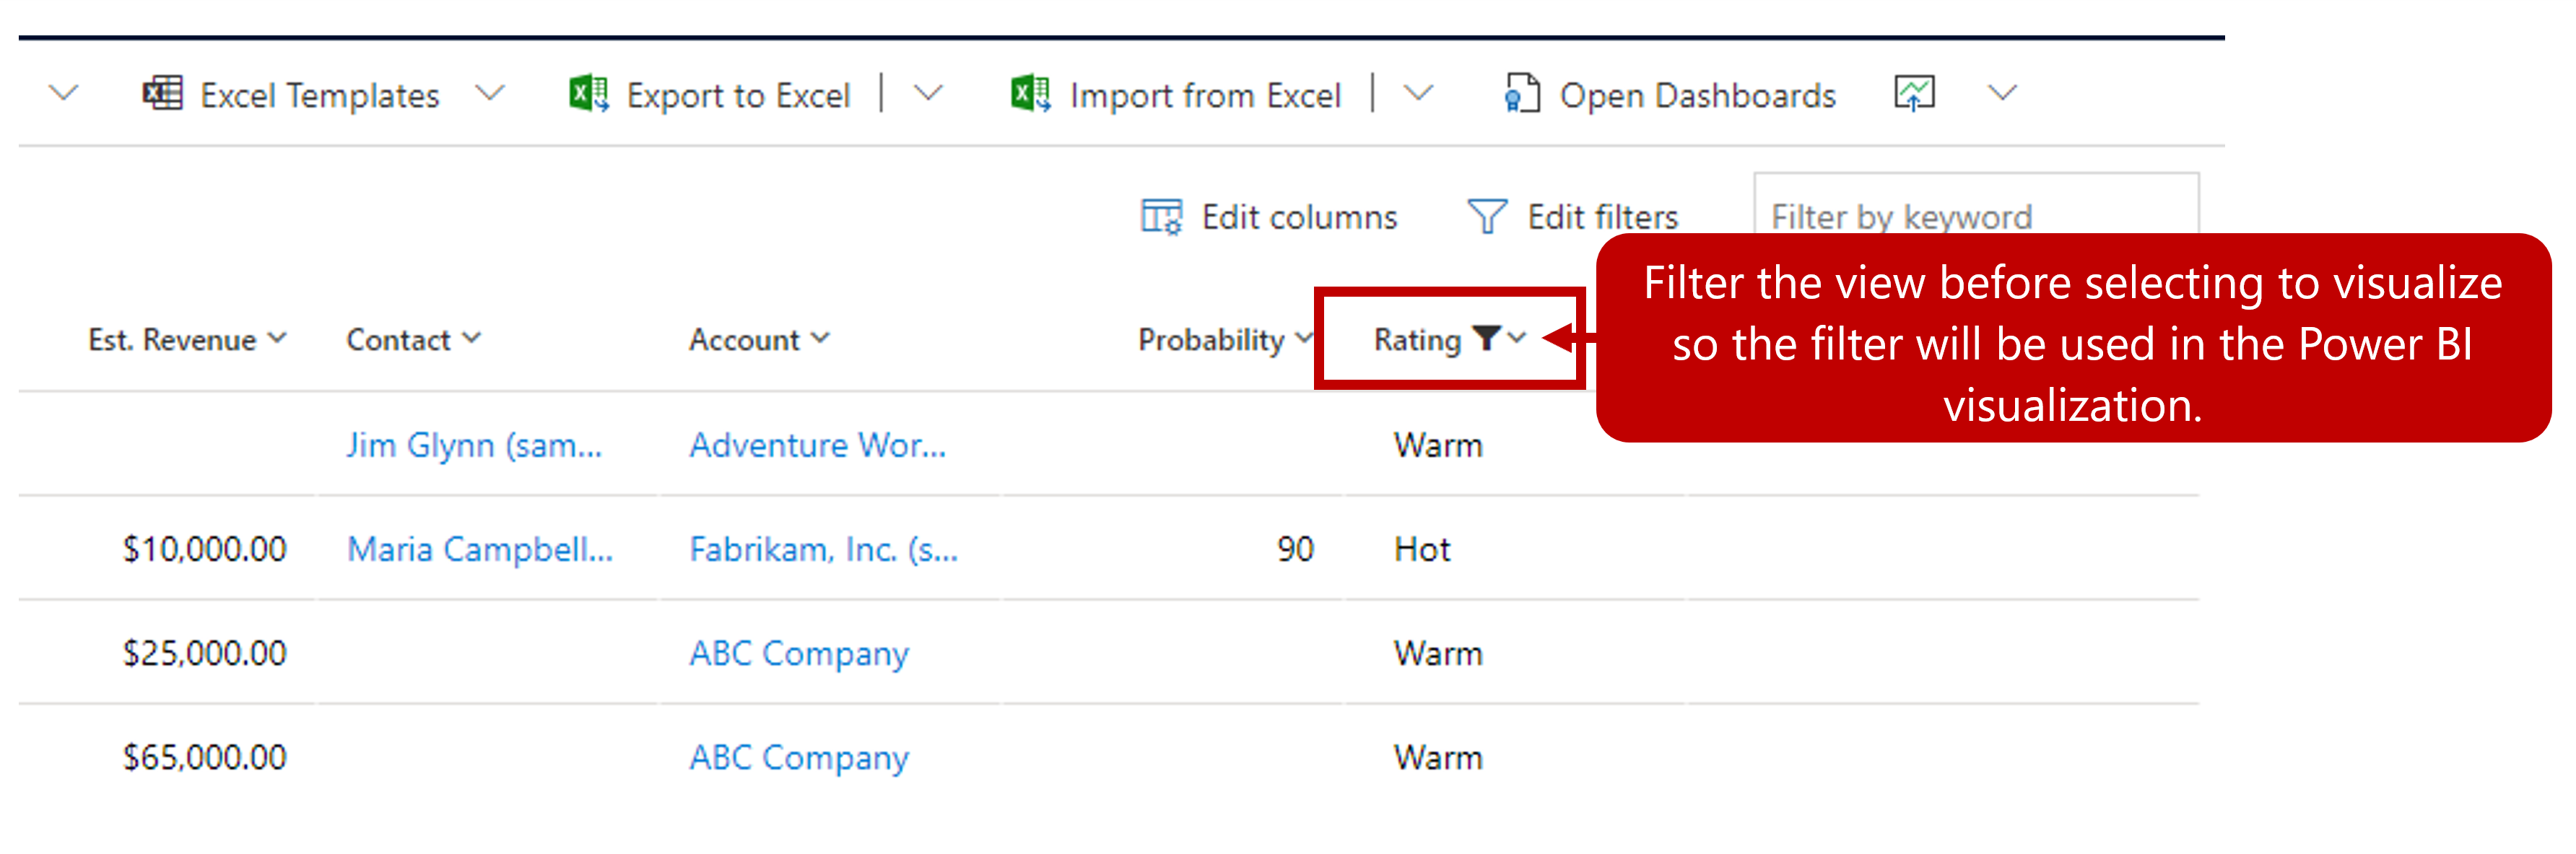
Filter the original view for in-depth exploration
The data being visualized within the report is always based on the data currently in the view’s grid. This means if you've applied any filters to the grid, that filtered data will be used in the Power BI visuals. For example, if the view is filtered down to just 15 rows of data, only 15 rows will be visualized through Power BI.
Important
Individuals who will use the Visualize view in Power BI Feature will need to have a Power BI Pro License.
Show Power BI dashboards in Dynamics 365
If you have Power BI dashboards and components that you want to appear in Dynamics 365, you can turn on the Power BI Integration. You'll then be able to view these powerful visualizations directly from within Dynamics 365.
Here are the requirements for integrating Power BI with Dynamics 365:
Only Dynamics 365 Online is supported.
You must have an associated Power BI account.
- The same Microsoft Microsoft Entra ID is used for single sign-on (SSO).
Creation of Dynamics 365 dashboards requires existing Power BI dashboards and tiles.
To turn on this functionality, you'll need to have administrative rights in the Dynamics 365 Sales environment that you're working in. Enable this functionality in the Power Platform admin portal. Once in the Portal, select the environment you want to work with and select Settings.
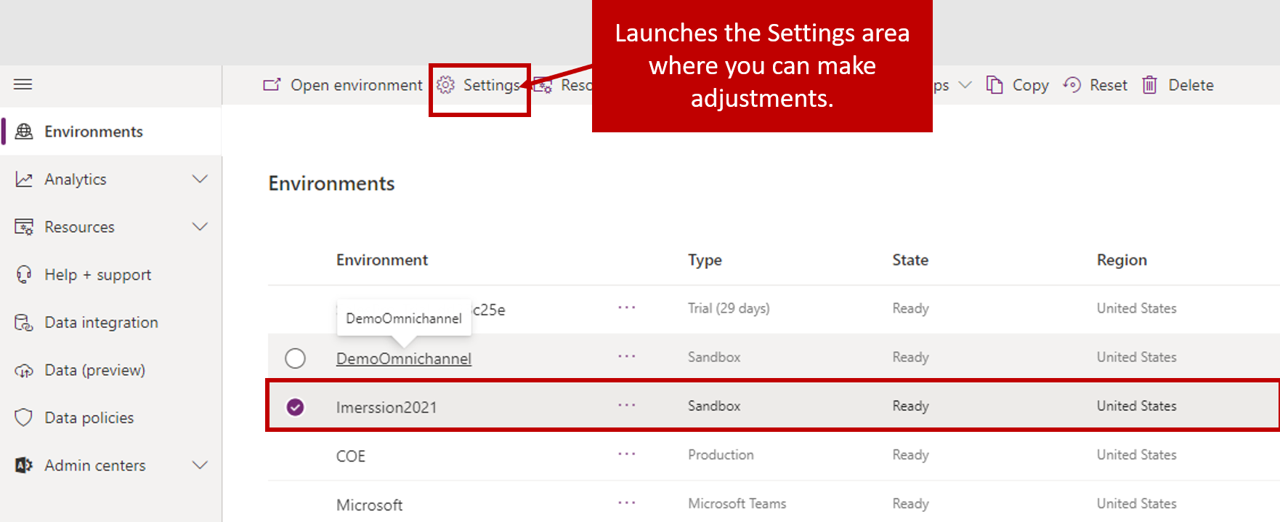
Power BI embedding is located under Product > Features. After you enable Power BI visualization embedding, select the Save button.

After the integration is turned on, users will be able to add Power BI elements as dashboard elements in Dynamics 365. From the Dashboards tab, select the New button.
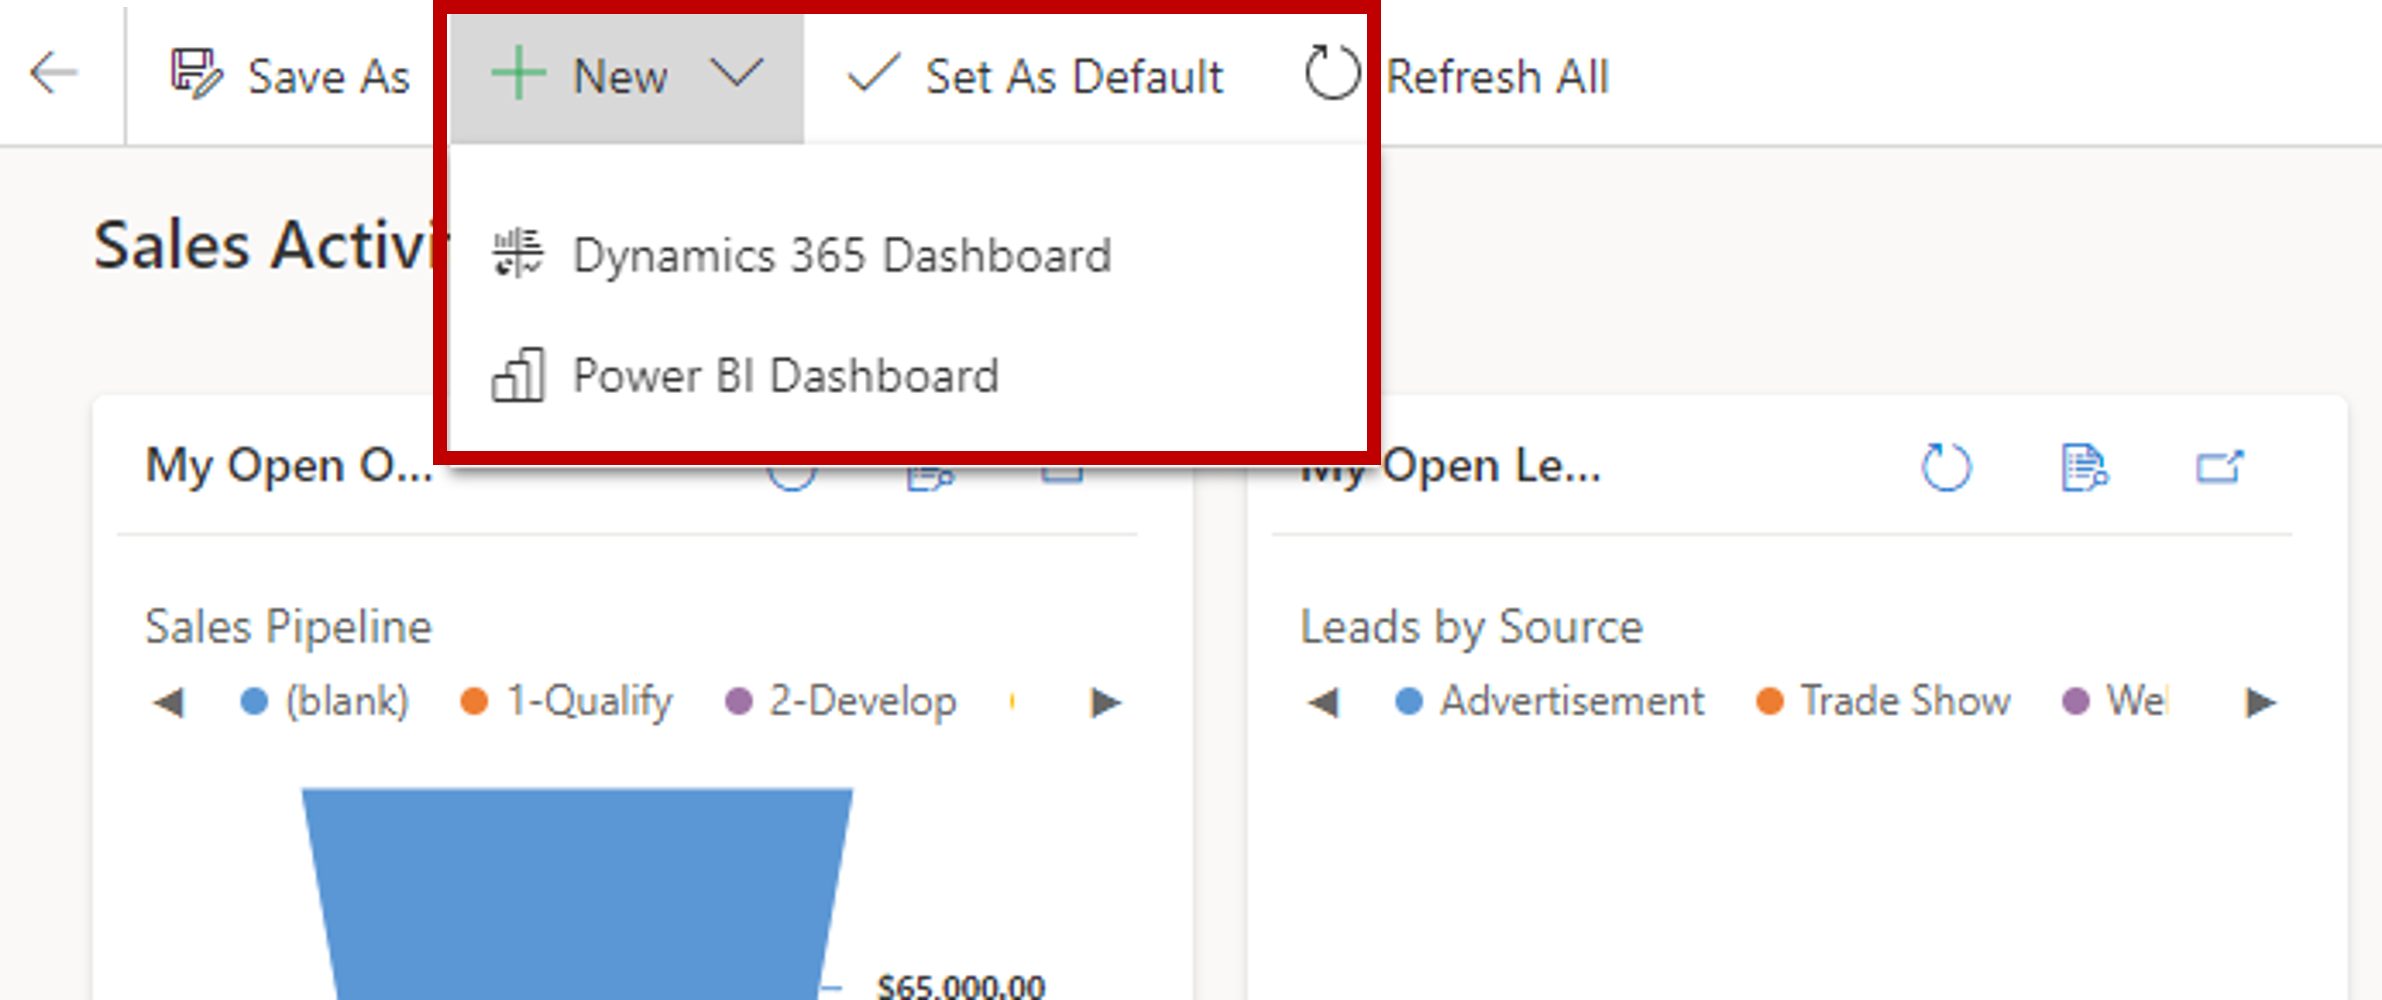
Besides being able to create a Dynamics 365 dashboard, you'll also be presented with a Power BI Dashboard item.
You'll be able to perform these tasks:
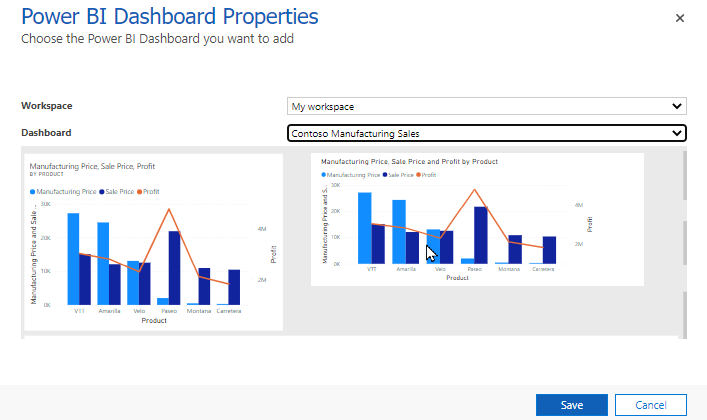
Add Power BI tiles to a dashboard.
Add a full Power BI dashboard.
Power BI dashboards can appear only on personal dashboards and embed Power BI visualizations can be embedded only on personal dashboards. Therefore, admins can't create system dashboards that include Power BI items and that are visible to the whole organization.
Because Power BI connects to Dynamics 365 and part of the application, there are some limitations that you should consider when you're deciding whether to use Power BI:
Power BI doesn't run in the context of records or users: Unlike charts and dashboards, Power BI doesn't run in the context of a record or user. Although the functionality can be extended so that it includes links to individual records, this capability isn't available natively.
Data updates occur hourly or daily: Power BI doesn't show a real-time view of Dynamics 365 data. The data is updated at specific intervals that depend on your pricing tier.