Visualize data with serverless SQL pools
In the Azure portal, navigate to your Synapse Workspace. In the Overview (1) tab, copy the Serverless SQL endpoint (2):

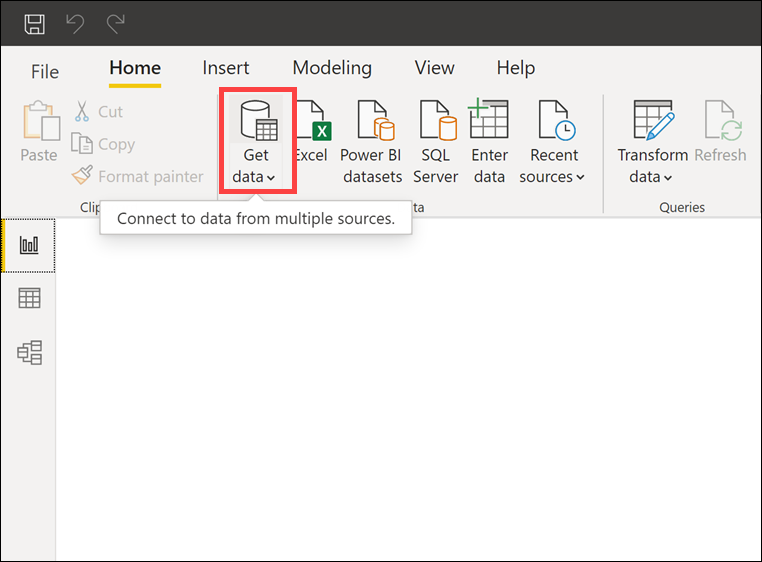
Switch back to Power BI Desktop. Create a new report, then click Get data.
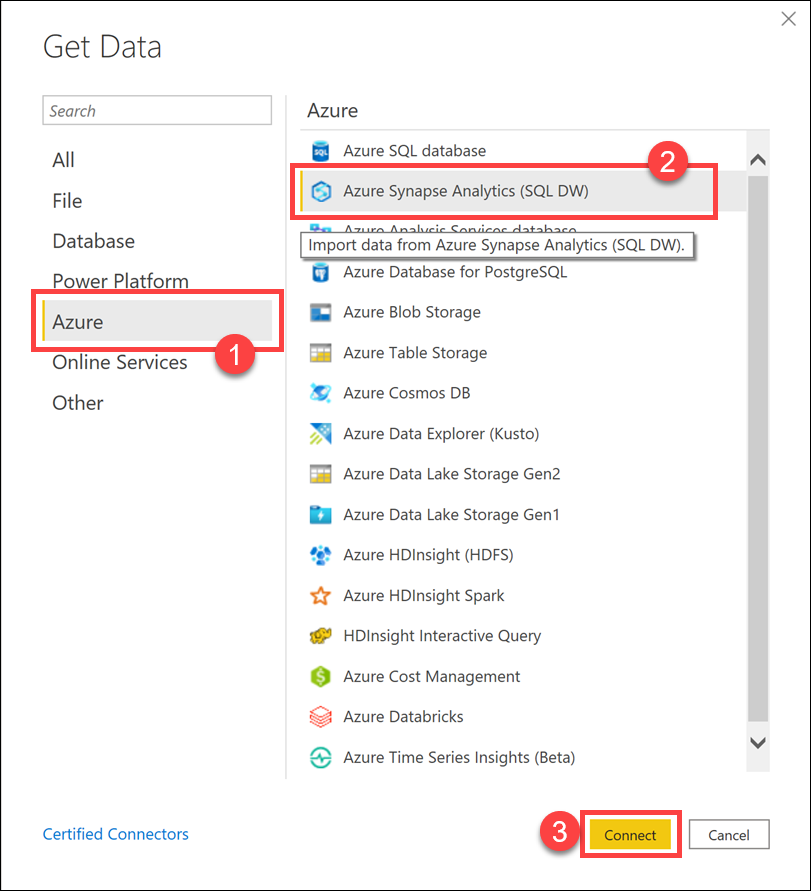
Select Azure (1) on the left-hand menu, then select Azure Synapse Analytics (SQL DW) (2). Finally, click Connect (3):
Paste the endpoint to the Serverless SQL endpoint identified on the first step into the Server field (1), enter
demofor the Database (2), select DirectQuery (3), then paste the query below (4) into the expanded Advanced options section of the SQL Server database dialog. Finally, click OK (5).SELECT TOP (100) [Year] ,[Month] ,[Day] ,[TotalAmount] ,[ProfitAmount] ,[TransactionsCount] FROM [dbo].[2019Q1Sales]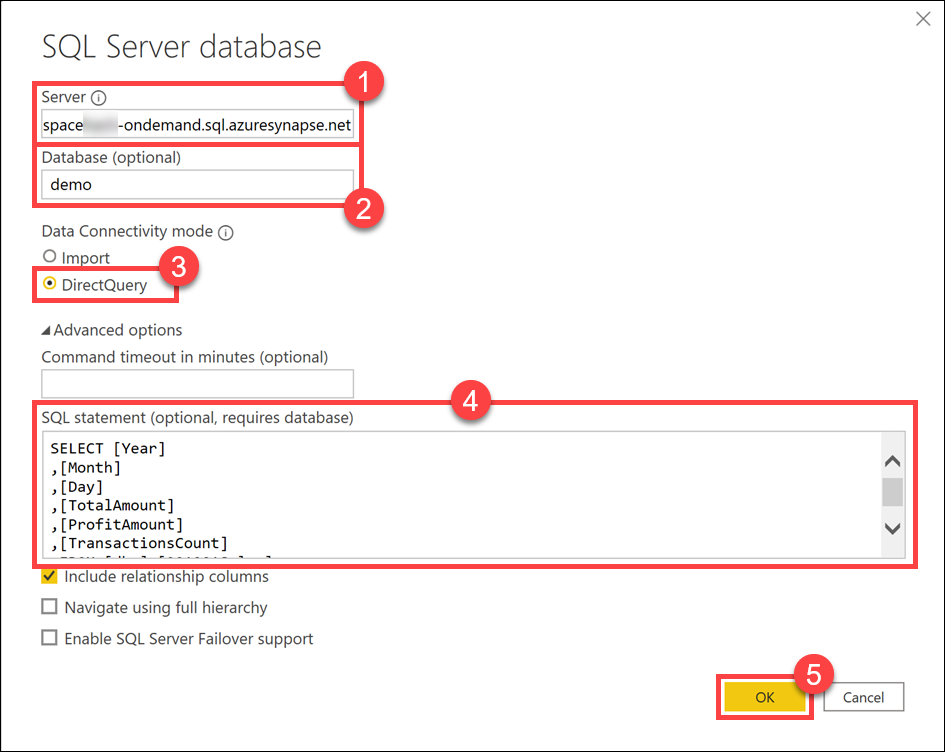
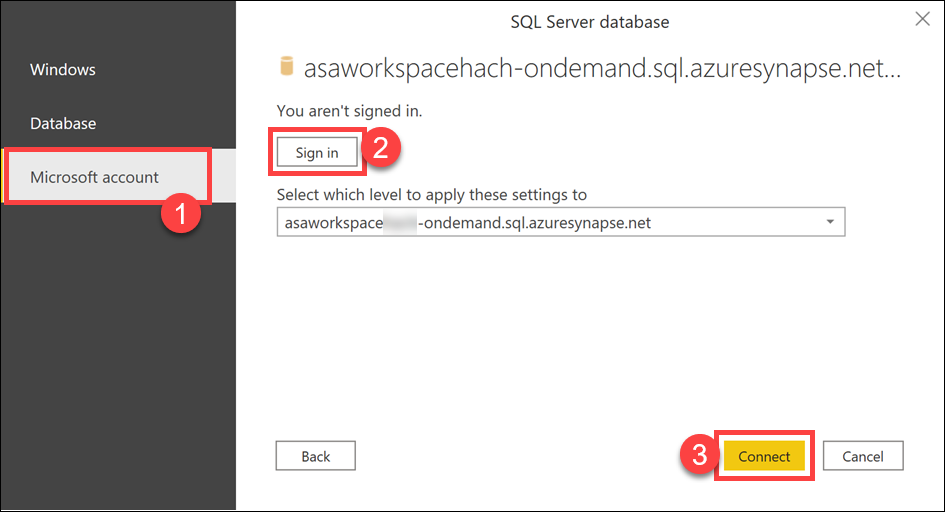
(If prompted) Select the Microsoft account (1) option on the left, Sign in (2) (with the same credentials you use for connecting to the Synapse workspace) and click Connect (3).
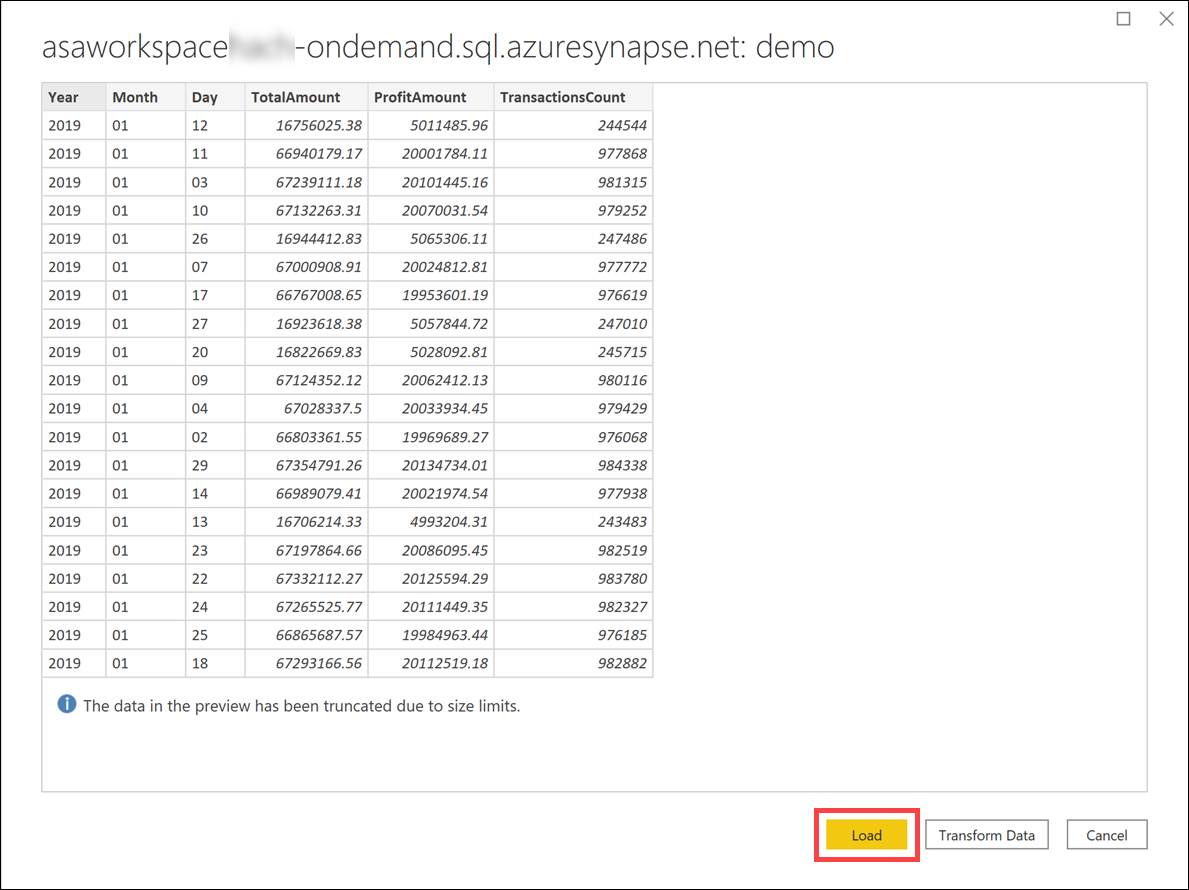
Select Load in the preview data window and wait for the connection to be configured.
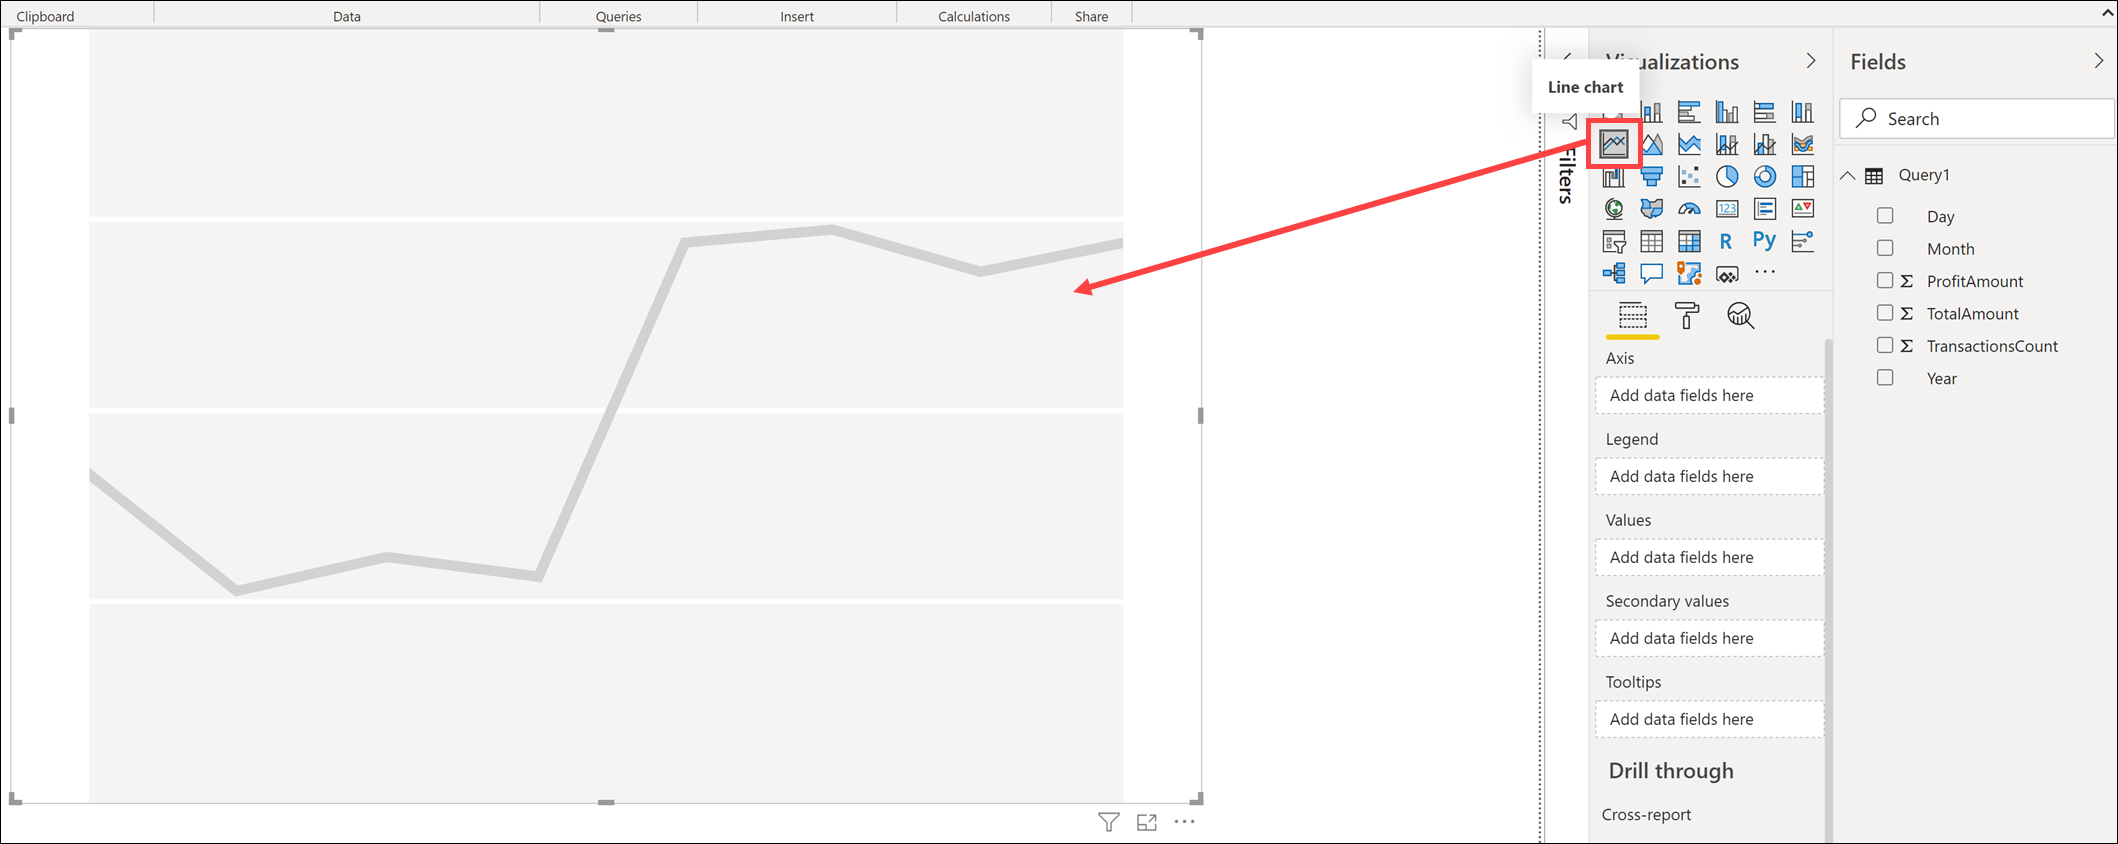
After the data loads, select Line chart from the Visualizations menu.
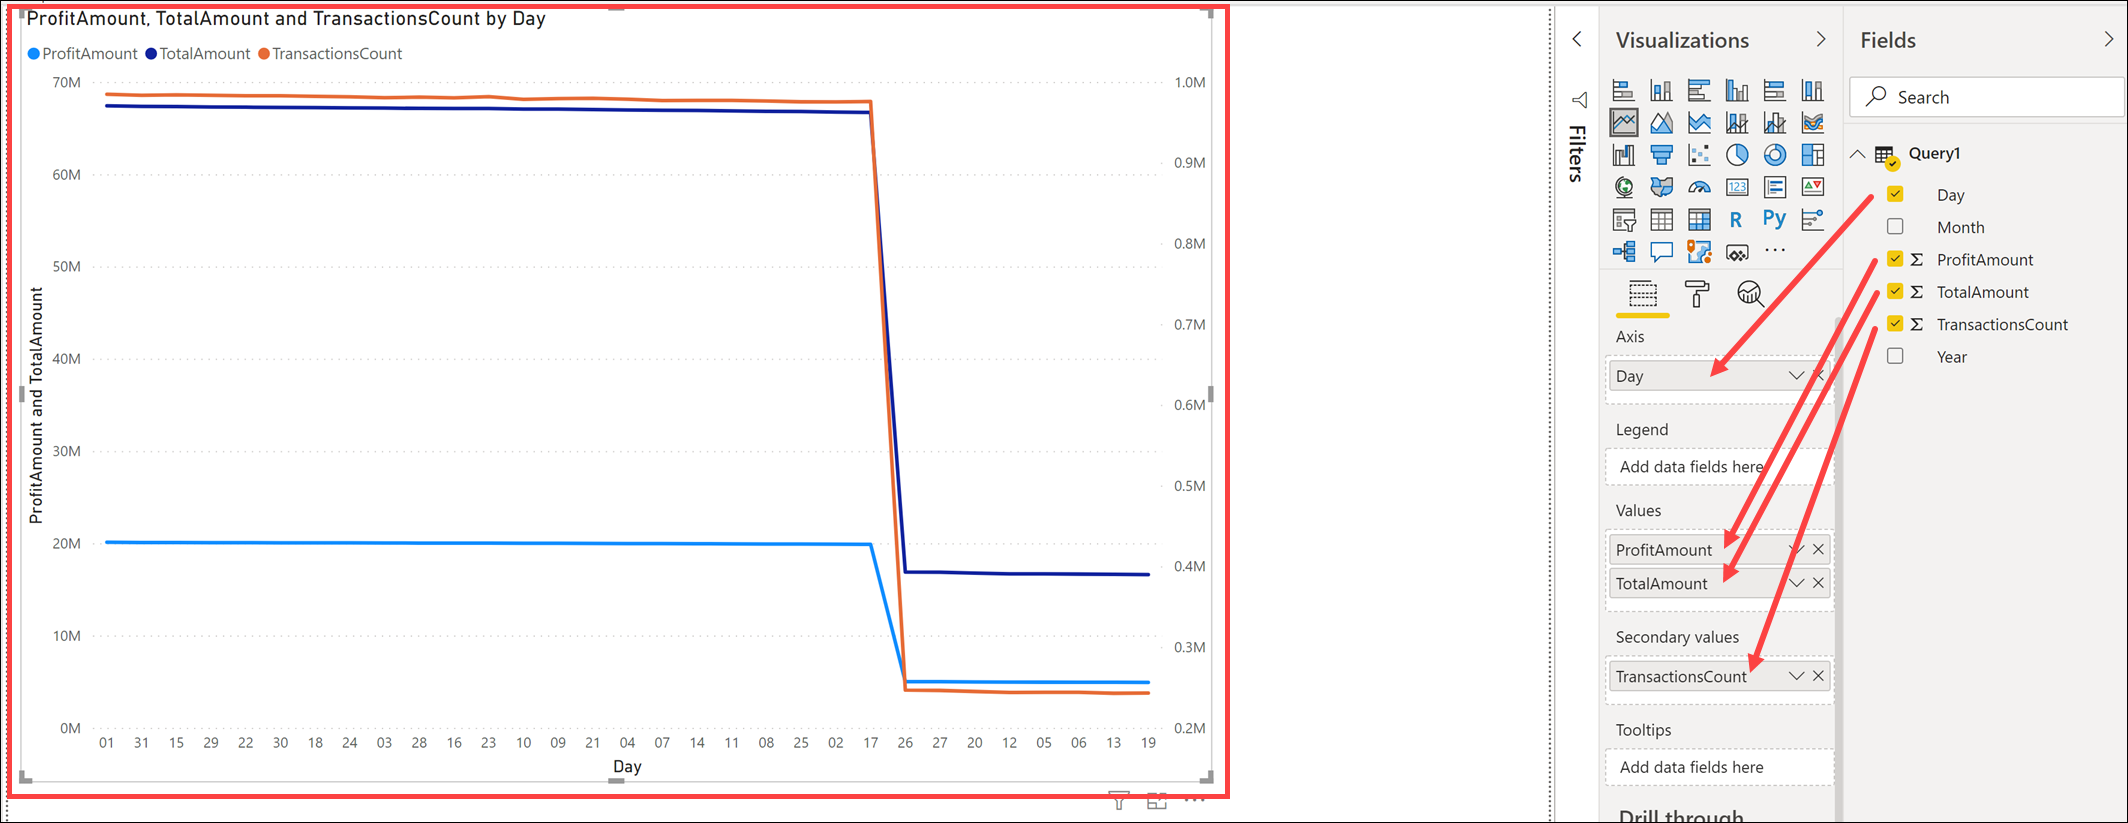
Select the line chart visualization and configure it as follows to show Profit, Amount, and Transactions count by day:
- Axis:
Day - Values:
ProfitAmount,TotalAmount - Secondary values:
TransactionsCount
- Axis:
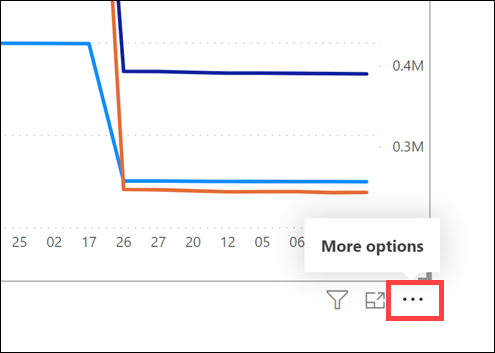
Select the line chart visualization and configure it to sort in ascending order by the day of transaction. To do this, select More options next to the chart visualization.
Select Sort ascending.
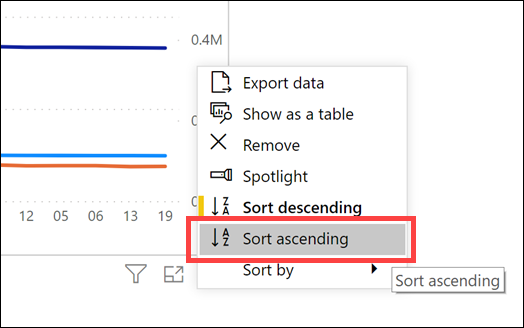
Select More options next to the chart visualization again.

Select Sort by, then Day.

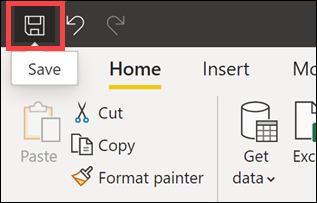
Click Save in the top-left corner.
Specify a file name (1), such as
synapse-sql-serverless, then click Save (2).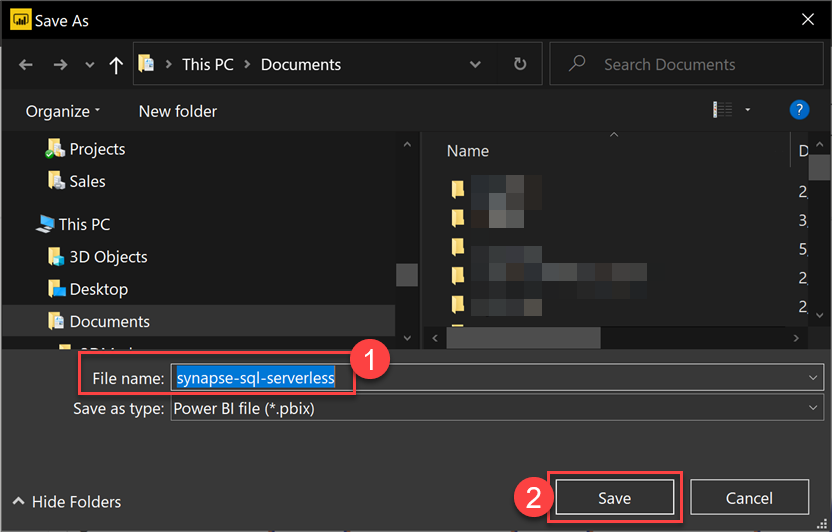
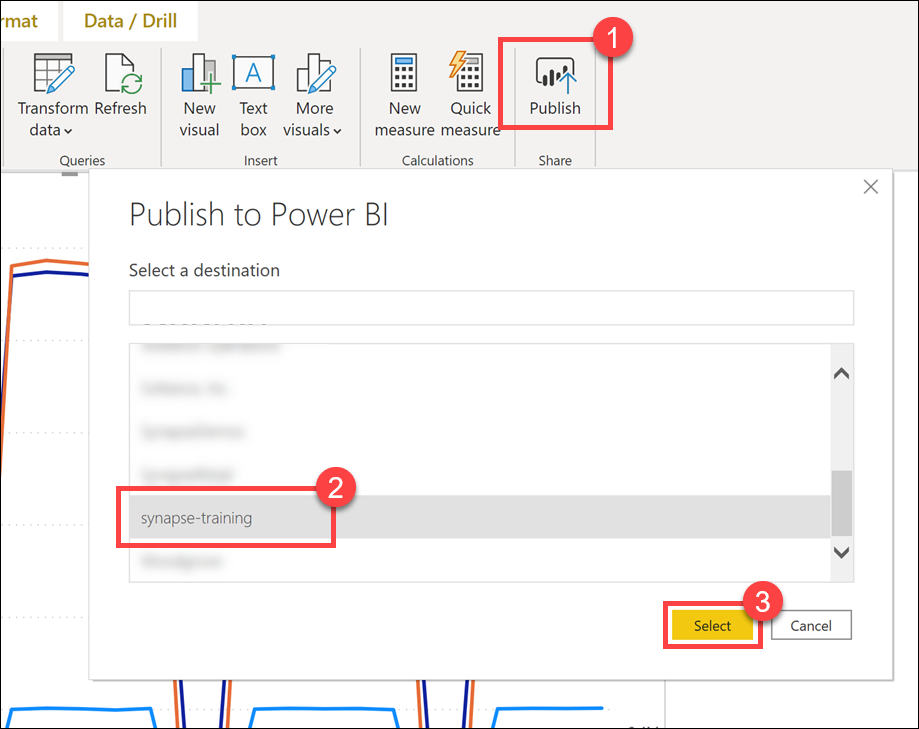
Click Publish above the saved report. Make sure that, in Power BI Desktop, you are signed in with the same account you use in the Power BI portal and in Synapse Studio. You can switch to the proper account from the right topmost corner of the window. In the Publish to Power BI dialog, select the workspace you linked to Synapse (for example, synapse-training), then click Select.
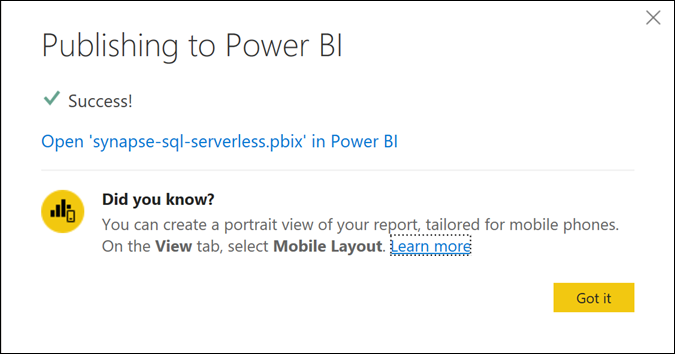
Wait until the publish operation successfully completes.
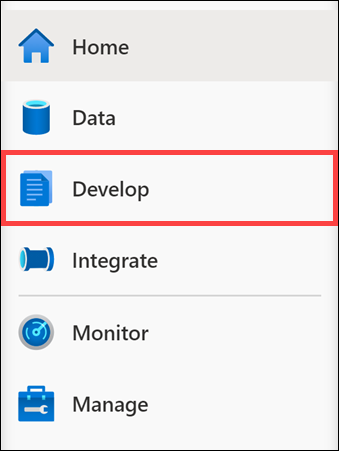
In Azure Synapse Studio, navigate to the Develop hub.
Expand the Power BI group, expand your Power BI linked service (for example,
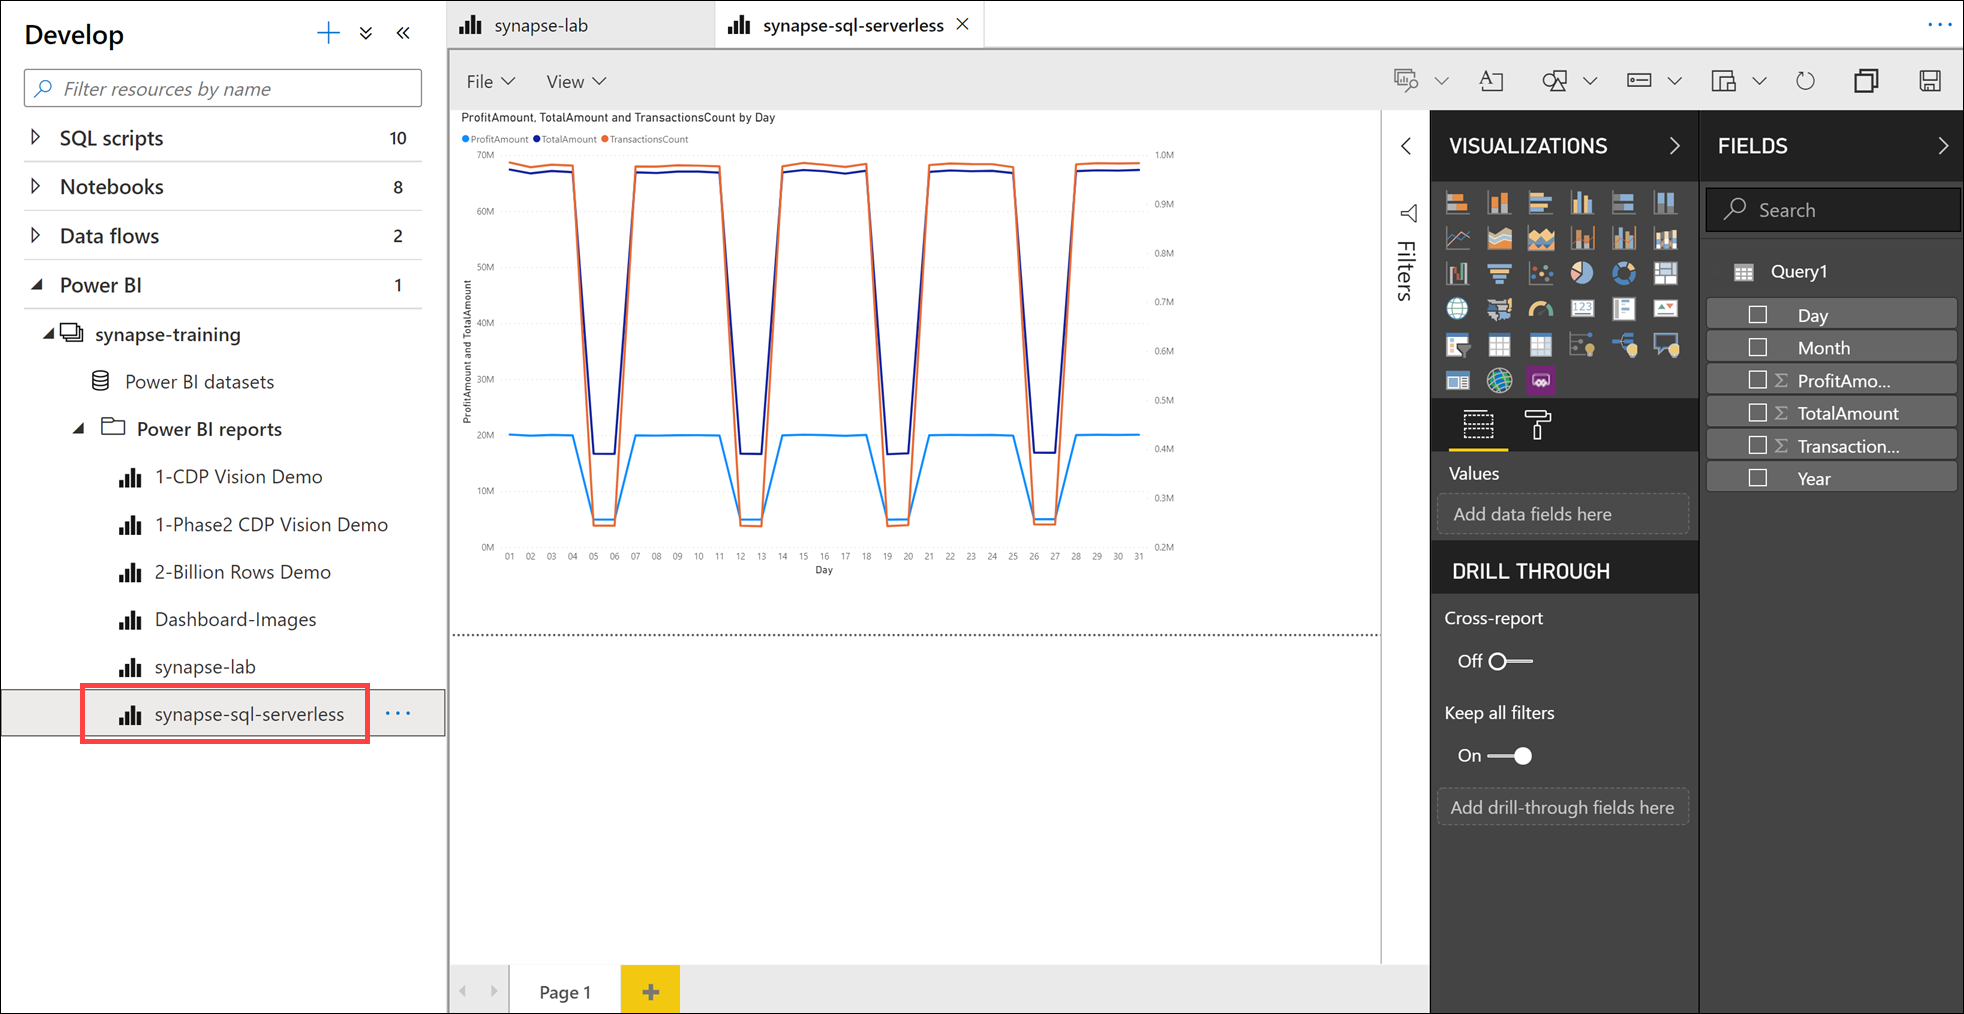
synapse-training), right-click on Power BI reports and select Refresh (1) to update the list of reports. You should see the two Power BI reports you created in this lab (synapse-labandsynapse-sql-serverless(2)).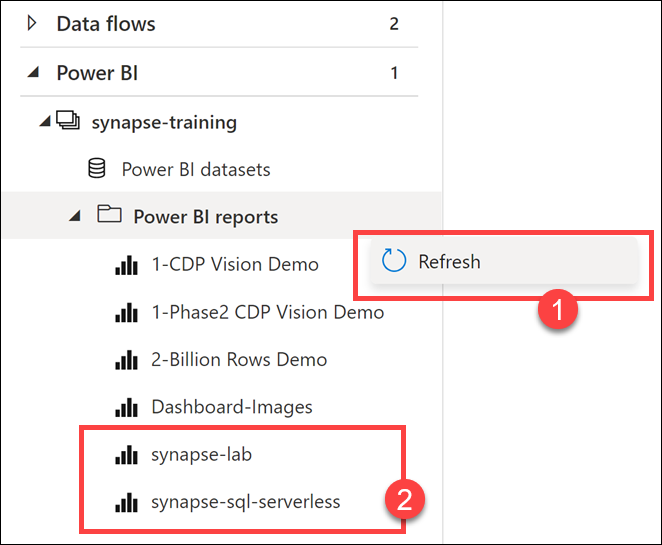
Select the
synapse-labreport. You can view and edit the report directly within Synapse Studio!
Select the
synapse-sql-serverlessreport. You should be able to view and edit this report as well.