Analyze telemetry data
With the IoT pipeline components clearly identified, you now want to focus on the ability to extract data that provides meaningful insights into the state of managed devices. You need to explore built-in Azure IoT Central analytics capabilities to determine whether they're sufficient to address your requirements. However, you also intend to evaluate other options, including Azure Time Series Insights and the export functionality that's available with Azure IoT Hub.
What are the primary IoT analytics options?
The primary IoT analytics options reflect the data processing principles of the Lambda architecture. The Lambda architecture represents a layered approach to implementing two types of data processing: batch and streaming. The batch layer, also referred to as the slow or cold path, stores all of the incoming data in its raw form and applies batch processing to it. A speed layer, also referred to as the fast or hot path, applies analytics in real or near-real time.
Your approach to analytics and the corresponding technology choices for implementing that approach depend on whether you process telemetry that's part of the fast or slow data path. In particular, the fast data flow is subject to the latency constraint, so there's a limit on the extent of its analysis. This constraint doesn't apply to data flowing through the slow path, which allows for highly accurate and complex analytics.
What are the analytics capabilities of Azure IoT Central?
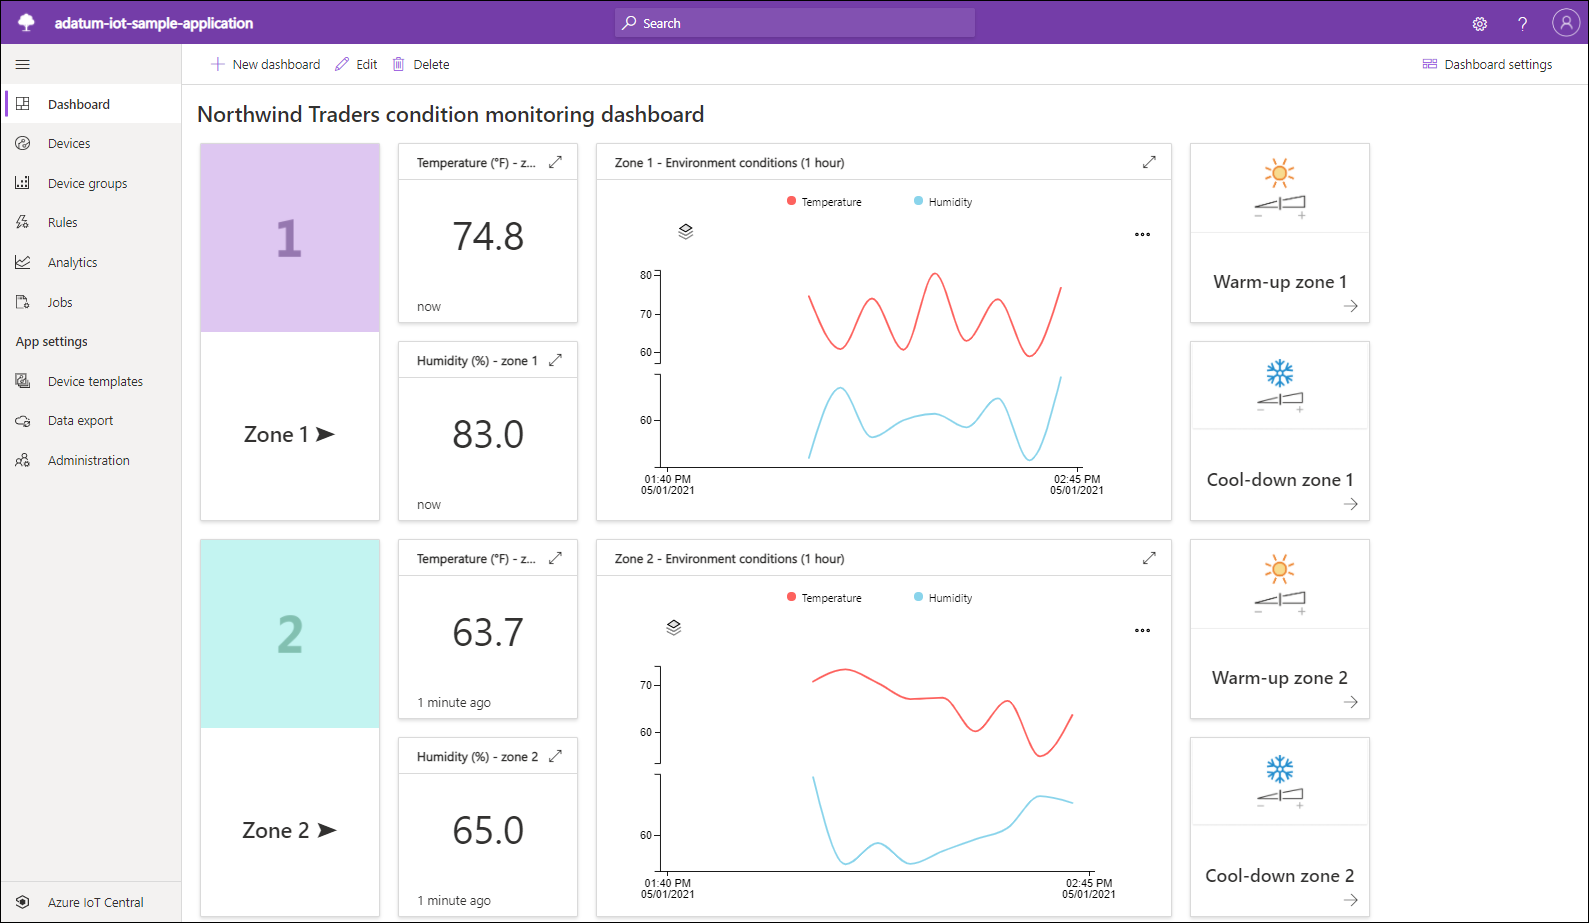
Azure IoT Central offers built-in analytics functionality based on the built-in analytics service, which combines the hot and cold path capabilities. It allows you to monitor near-real time data points. You can also visualize historical trends, correlate distinct types of telemetry, and detect anomalies in collected data based on built-in and custom interactive dashboards. This capability uses Azure Time Series Insights for telemetry processing.


As part of the hot path analytics, you have the option of configuring continuous data export from Azure IoT Central to Azure Event Hubs, which integrates with Azure Databricks. After you install the relevant libraries in the Azure Databricks workspace, you're able to use its processing resources to further analyze the telemetry stream and generate more complex visualizations, such as box plots. Besides Azure Databricks, you can also use Azure Stream Analytics or the Spark streaming functionality included in Azure HDInsight for this purpose. Alternatively, you can use Azure Time Series Insights. This service is optimized for simultaneous queries over large data sets with latency in the range of 30 and 60 seconds.
For the cold data path, you can export data in regular intervals to Azure Blob storage. Next, you can configure a data pipeline that combines the following components:
- An Azure function
- An Azure Data Factory pipeline
- An Azure SQL database
- A Power BI solution
Note
The Power BI solution enables you to process, transform, and visualize the data. Power BI enables the creation of models, Key Performance Indicators (KPIs), and their visualization through interactive dashboards.
What are the analytics capabilities of Azure Time Series Insights?
Though Azure Time Series Insights is built into Azure IoT Central, it's also available as a separate service, which closely integrates with cloud gateways such as Azure IoT Hub and Azure Event Hubs. It provides an analytics, storage, and visualization service for time series data, including support for SQL-like filtering and aggregation rules. Its visualization capabilities include support for overlays of different time series, dashboard comparisons, tabular views, heat maps, and a data explorer for interactive data queries. In addition, it exposes a JavaScript controls library that facilitates embedding time series charts into custom applications.
What are the analytics capabilities of Azure Stream Analytics?
Azure Stream Analytics is part of the hot data path. It provides real-time analytics and complex event-processing optimized for high volumes of streaming data that originates from IoT devices, social media feeds, and applications. Azure Stream Analytics supports operations such as windowing, stream aggregations, and external data source joins.