Exercise - Connect to Dynamics 365 Customer Voice data with Power BI
In this exercise, you'll use Microsoft Power BI to connect to Dynamics 365 Customer Voice data, which will give you the preparation needed to build your own reports.
Task 1: Install Power BI Desktop
In this task, you will install the Power BI Desktop client.
Go to the Power BI Downloads page.
From the Microsoft Power BI Desktop section, select Download.

A new window will open, with a dialogue stating that the site is trying to open Microsoft Store. Select Open to allow this action.
Note
Make sure that you turn off pop-up blockers on your browser so this dialogue is not blocked.

Microsoft Store should open and direct you to the Power BI Desktop app. Select Install.

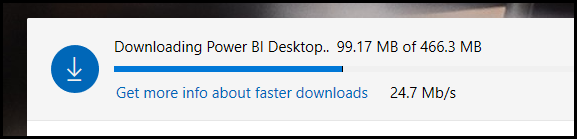
The Power BI Desktop app will now be downloaded to your workstation. Wait for this download to complete.
After the product has been installed, select the Launch button.


Task 2: Access Microsoft Power Platform admin center
In this task, you will access Microsoft Power Platform admin center to find the server URL for your Microsoft Dataverse environment.
Go to the Microsoft Power Platform admin center.
The Dataverse environment for your Dynamics 365 Customer Voice instance will be listed in the admin center. Select the Environment name that you want to use.

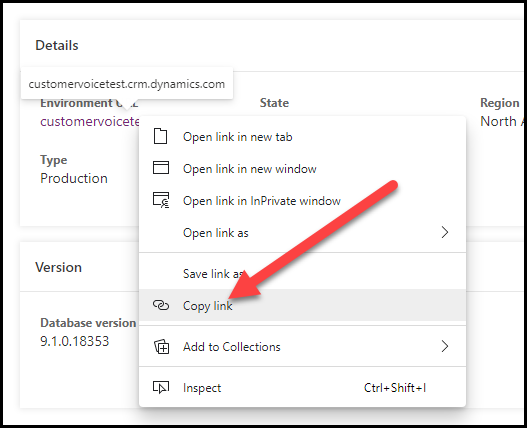
The Environment URL will be displayed. Right-click the Environment URL.

Select Copy link. Open Notepad or another editing tool and paste the link. You will use this link in the next task.


Task 3: Connect to Dynamics 365 Customer Voice data
In this task, you will connect to the Dynamics 365 Customer Voice data in your Dataverse environment and add table tables to a report.
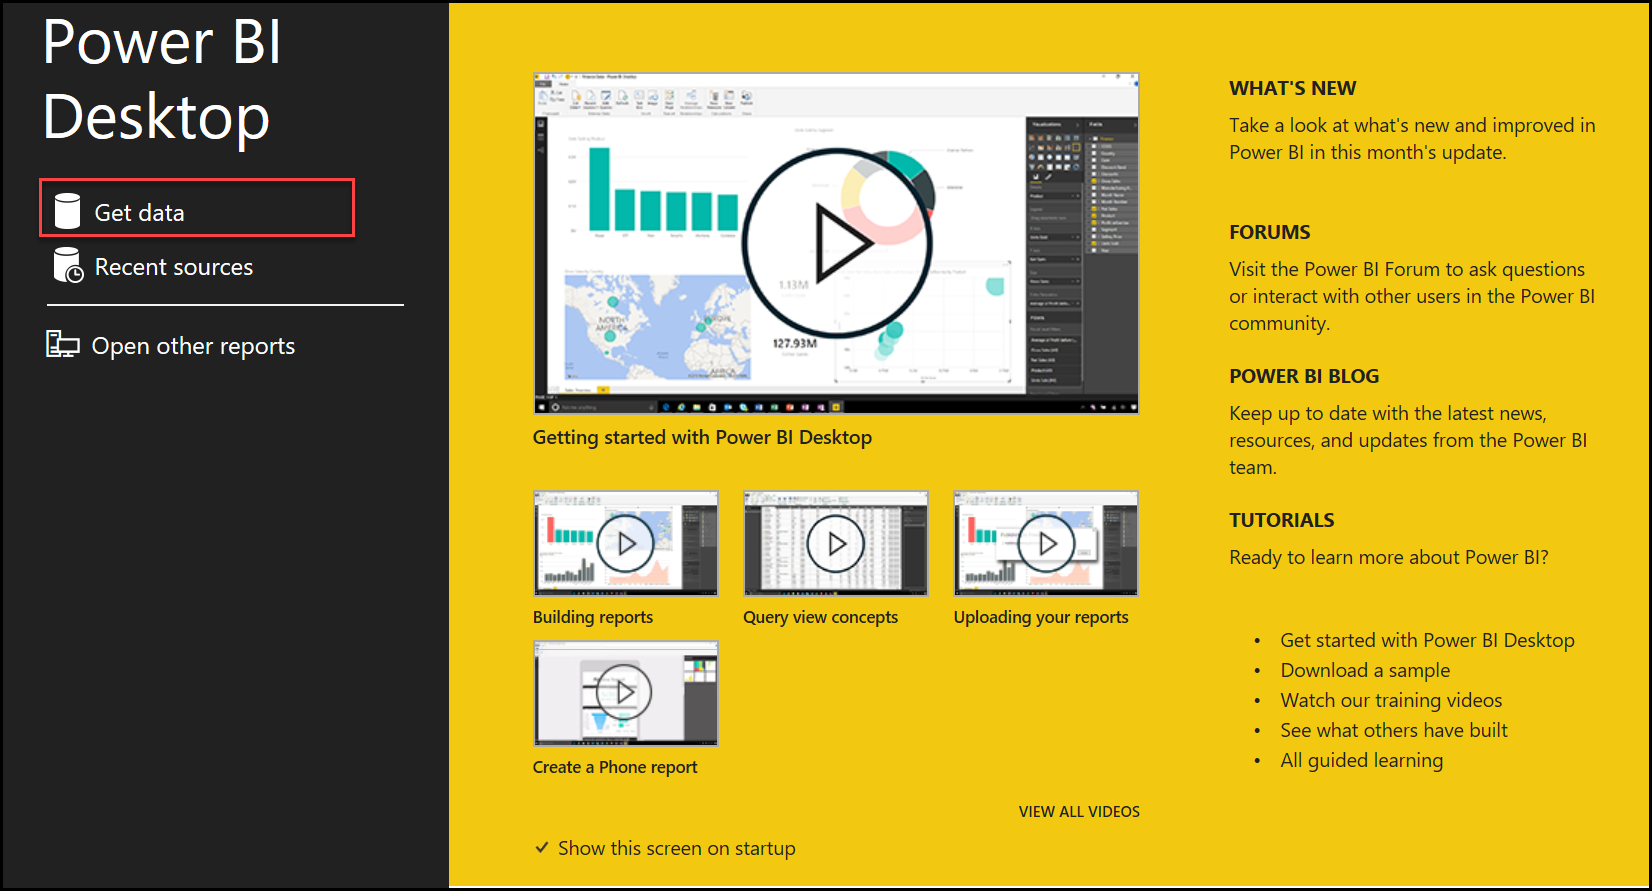
If you no longer have Power BI Desktop open, open it.
Select Get data from the welcome screen.
Select Microsoft Power Platform from the list of data category options.

Select Microsoft Dataverse from the list of Microsoft Power Platform options.

Select Connect.
Use the link that you accessed in Task 2 and paste it into the Server URL column.

Select OK.
If you are already signed in, you will bypass the next step and will not be prompted for your username and password. If you are not signed in, select the Sign in button.

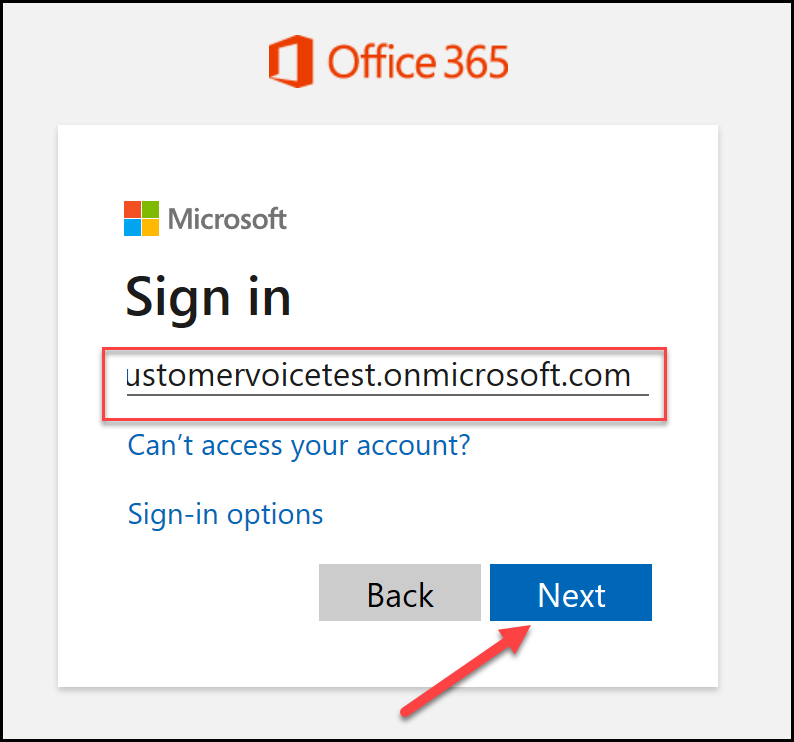
You will be prompted to sign in. Enter your username, and then select Next.
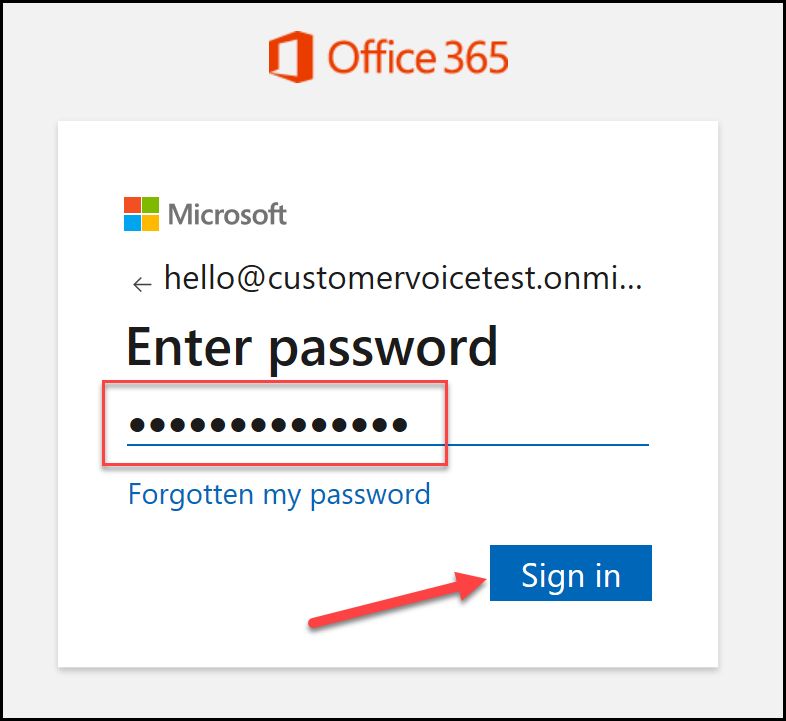
Enter your password and then select Sign in.
The next screen shows that you are currently signed in. Select Connect to continue.

In the Navigator search box, enter msfp, which will filter the table tables and only display the Dynamics 365 Customer Voice tables.
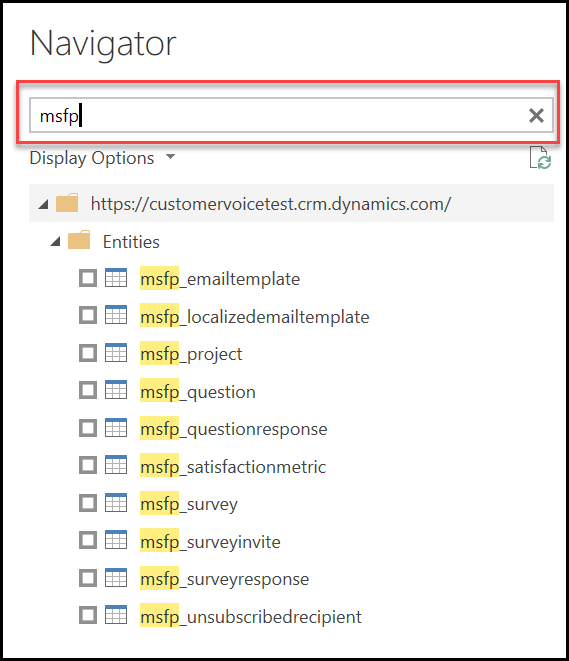
Select the boxes next to the following tables: msfp_question, msfp_questionresponse, msfp_survey, msfp_surveyinvite, and msfp_surveyresponse.

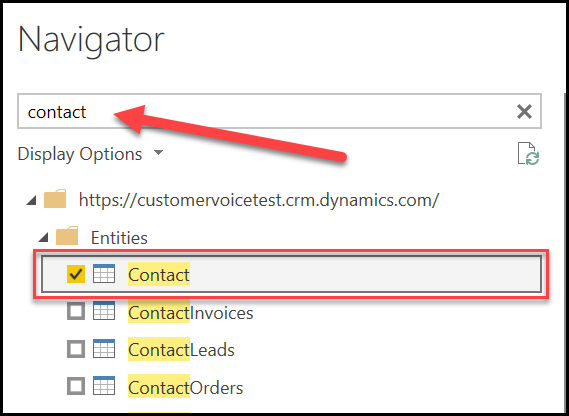
In the Navigator search box, enter the word Contact and then select the box next to the Contact table.
In the Navigator search box, enter activityparty. Select the box next to the ActivityParty table.

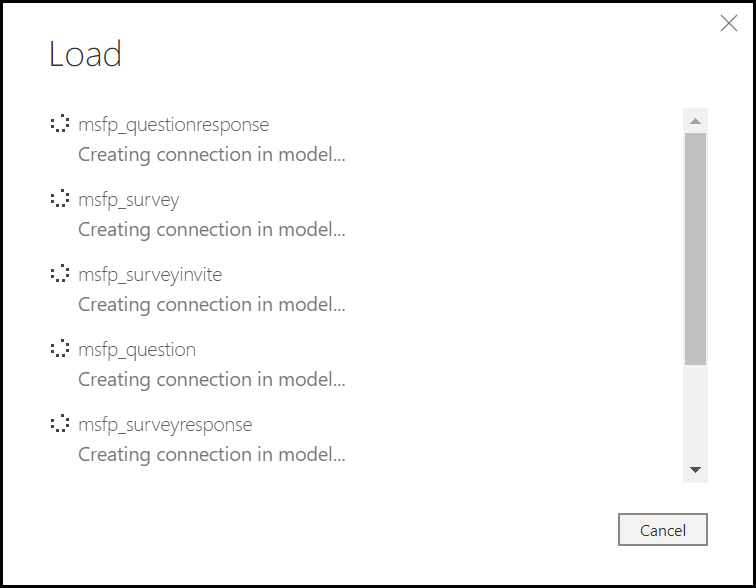
Select the Load button.
Wait for the tables to load.
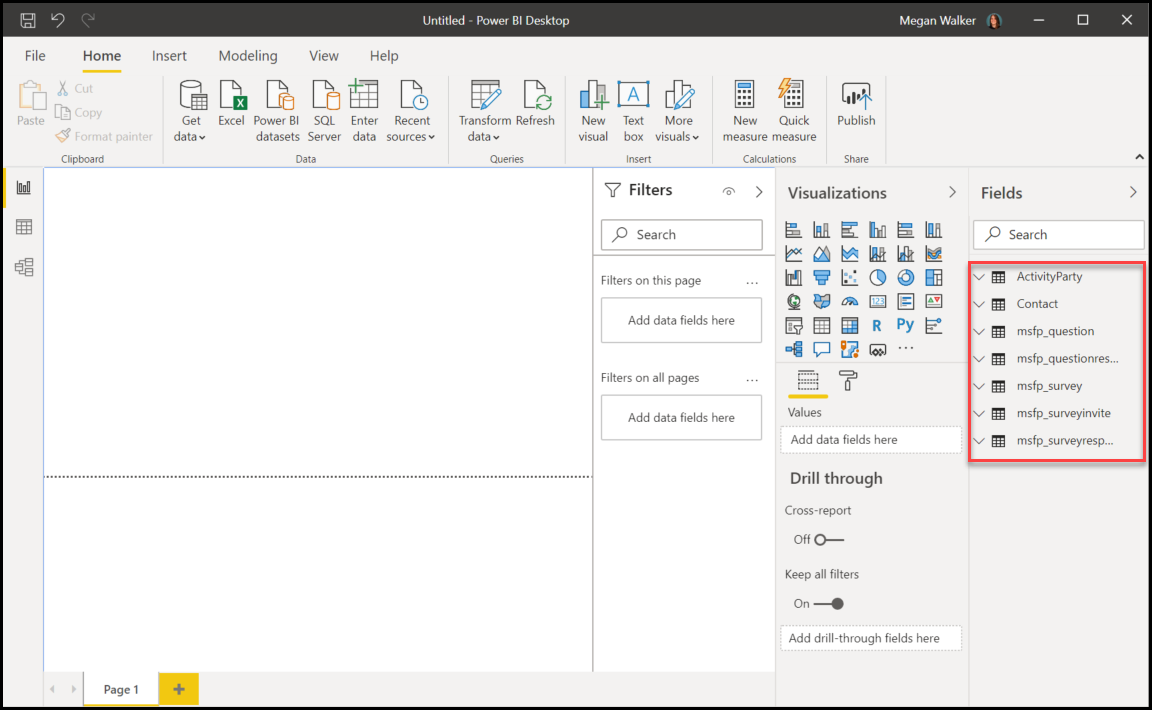
Under the columns section of your Power BI report, you should now see all table tables that were selected in the previous steps.


Task 4: Link table tables in a Power BI report
In this task, you will link the table tables that were selected in Task 3 by creating relationships between them.
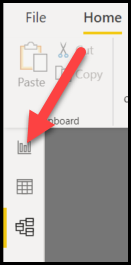
Select the Model icon from the menu on the left side of Power BI.

Using the scroll bar at the bottom of the screen, scroll along to the right until you find the msfp_survey table table.
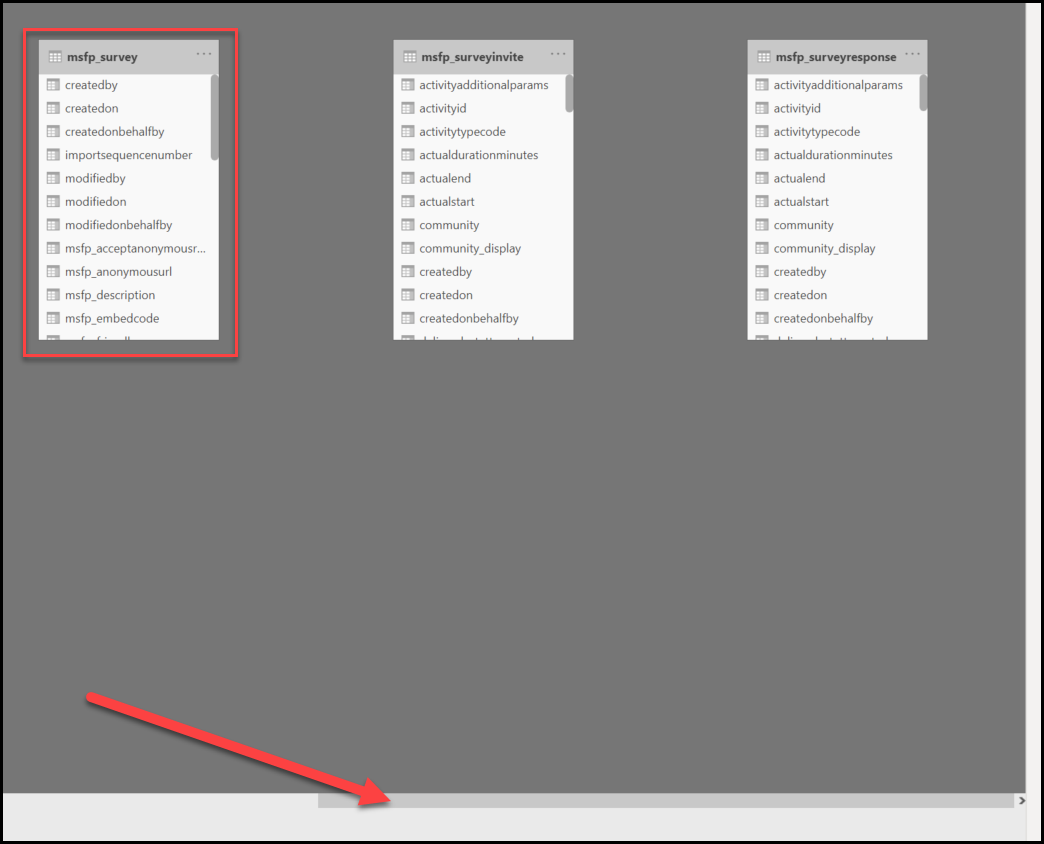
Using your mouse, select and hold the top of the msfp_survey table and then drag it along to the left so that it is now the first table in the view.

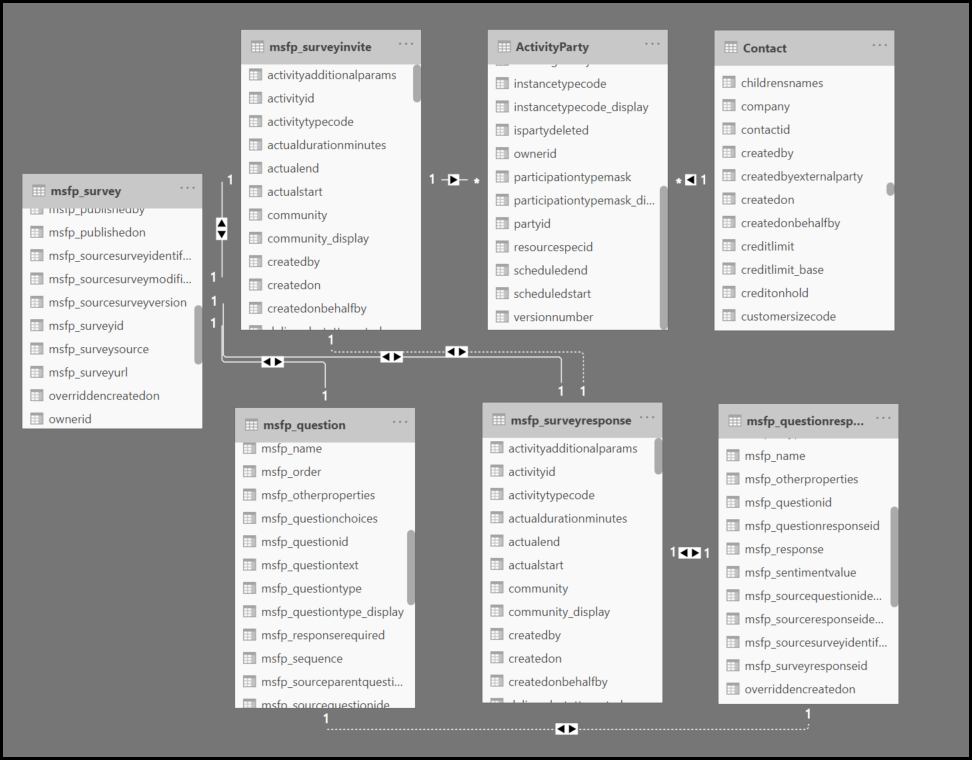
Move all the tables around until the layout looks the same as shown in the following figure. This action will make the next step easier when you link the tables together.

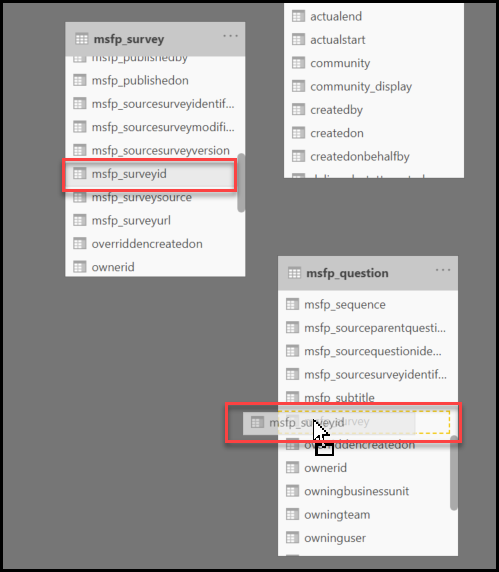
On the msfp_survey table, scroll down until you find the msfp_surveyid column. Then, on the msfp_question table, scroll down until you find the msfp_survey column. Select the msfp_surveyid column and drag it over to the msfp_survey column on the other table. Then, release your mouse.
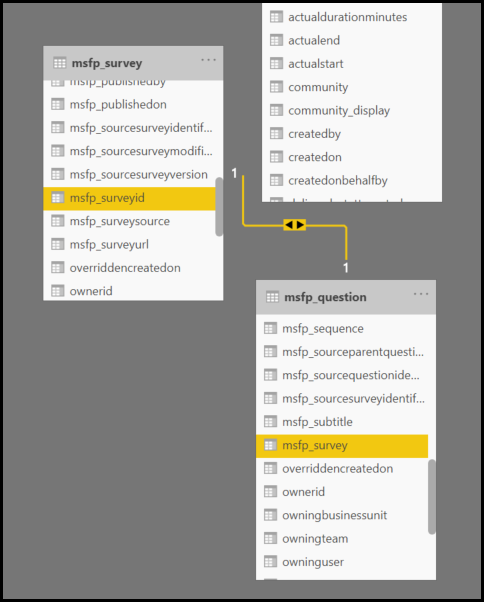
A connection line will now be visible between the two tables. Hovering your mouse over the line will highlight the two columns that are used for the connection.
By using the msfp_surveyid column, connect the msfp_survey table to the msfp_surveyinvite table on the msfp_surveyid column.
By using the msfp_survey ID column, connect the msfp_survey table to the msfp_surveyresponse table on the msfp_surveyid column.
By using the activityid column, connect the msfp_surveyinvite table to the activityparty table on the activityid column.
By using the partyid column, connect the activityparty table to the Contact table on the contactid column.
By using the activityid column, connect the msfp_surveyinvite table to the msfp_surveyresponse table on the msfp_surveyinviteid column.
By using the activityid column, connect the msfp_surveyresponse table to the msfp_questionresponse table on the msfp_surveyresponseid column.
By using the msfp_questionid column, connect the msfp_question table to the msfp_questionresponse table on the msfp_questionid column.
The model should now look similar to the following image.
Select the Report icon from the left navigation.


Your tables are now linked correctly, and you are set up to start creating your Power BI report.
