Exploratory data analysis
Exploratory Data Analysis, popularly referred to as EDA, is an iterative cycle of analyzing datasets to summarize their main characteristics, often by visualizing and transforming that data.
As a data scientist, you'll use various tools and techniques to explore, visualize, and manipulate data. One of the most common ways to work with data is to use the R language and some specific packages for data exploration.
One such package is the Tidyverse, a collection of packages that provide tooling for the most common data-science challenges.1 Among the packages in the Tidyverse that you’ll interact with are ggplot2, dplyr, and tibble.
Visualize data by using ggplot2
Ggplot2 is an R package for creating elegant graphics for data analysis. With ggplot2, you have a flexible way to create graphs by combining independent components of a graphic in a series of iterative steps. This makes ggplot2 one of the most versatile and powerful tools for making graphs in R.
Transform data by using dplyr
Dplyr is a grammar of data manipulation, providing a consistent set of verbs that help you solve the most common data manipulation challenges.1 With dplyr, you can transform the data into precisely the form that you need to enable further analysis or visualization.
Store data by using data frames and tibbles
Data frames present the most common way to store data in R to permit analysis. You can think of a data frame as the R equivalent of an Excel spreadsheet, because it stores data in a similar format.
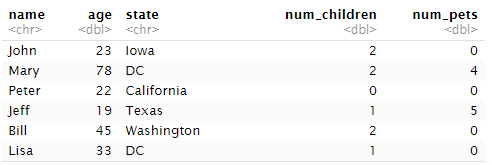
A tibble, on the other hand, is a modern data frame that seeks to improve on some aspects of the R built-in data frame. The terms tibble and data frame are used interchangeably in this module.
Explore data in a Jupyter notebook
Jupyter notebooks are a popular way to run basic scripts by using a web browser. These notebooks are ordinarily a single webpage that's separated into text sections and code sections, and the code is run on the server rather than on your local machine. With Jupyter notebooks, you can get started quickly without needing to install R, Python, or other tools.
Test your hypotheses
Data exploration and analysis is ordinarily an iterative process, in which data scientists analyze a sample of data and test their hypotheses by performing the following kinds of tasks:
- Clean the data to manage errors, missing values, and other issues.
- Apply statistical techniques to better understand the data and how the sample might be expected to represent the real-world population of data, allowing for random variation.
- Visualize the data to determine relationships between variables and, in the case of a machine learning project, to identify features that are potentially predictive of the label.
- Revise the hypothesis and repeat the process.
1. Hadley Wickham and others, "Welcome to the Tidyverse," Journal of Open Source Software, 2019.