Gather hardware information
Windows includes a number of tools that you can use to gather information about the hardware installed on a computer. When you become familiar with the functionality that these tools offer, you can identify the most appropriate tool for a particular hardware-monitoring or troubleshooting scenario.
The Event Viewer tool
The Event Viewer tool is the starting point for troubleshooting hardware failures. You should check the system and application logs for information, warnings, or errors that hardware devices or device drivers generate. Use the Event Viewer tool to show logs on remote computers and on the local machine.
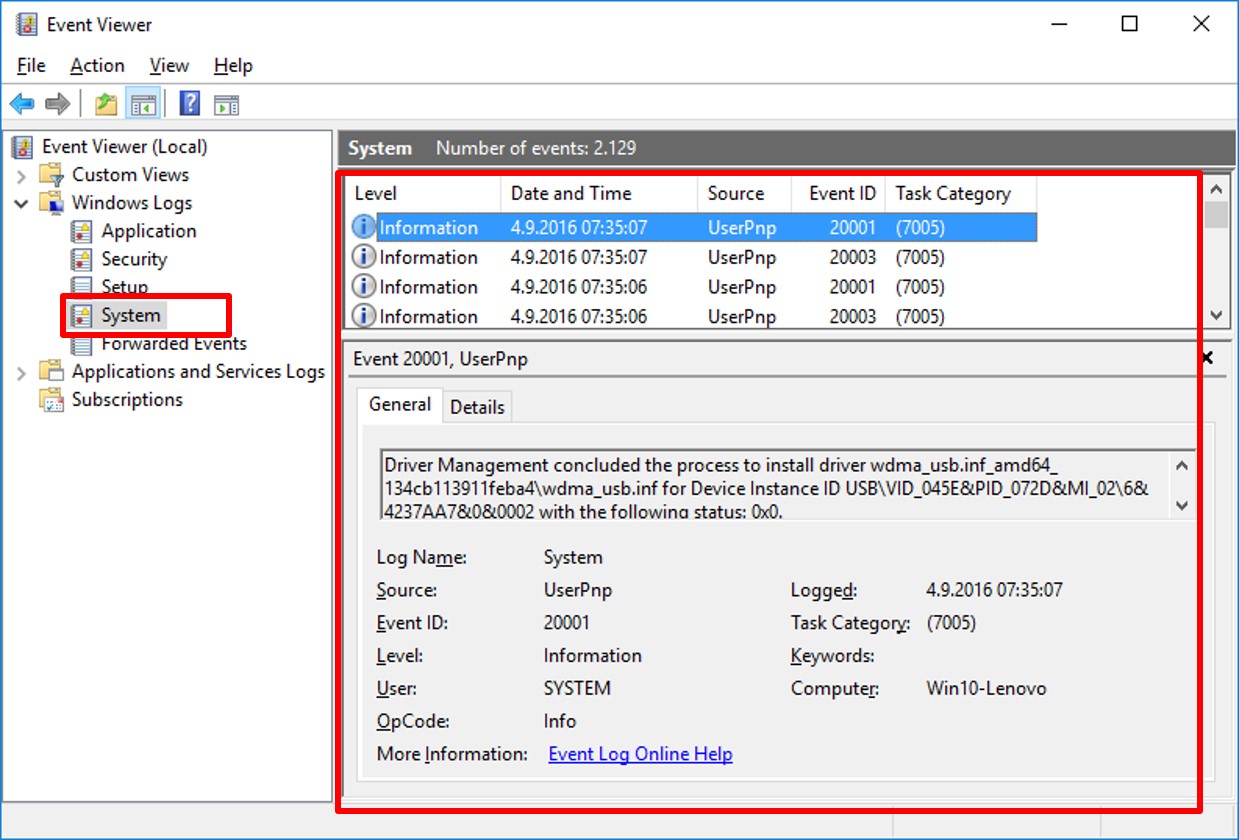
The Event Viewer tool has many built-in logs, including Application, Security, Setup, System, and Forwarded events logs. Event Viewer also includes Applications and Services logs, which store events from a single application or a component. This category of logs includes four subtypes:
- Admin. Admin logs are helpful for IT professionals who use the Event Viewer to troubleshoot problems. These logs provide guidance about how to respond to issues, and primarily target end users, administrators, and support personnel. The events found in admin logs indicate a problem that has a well-defined solution that an administrator can implement.
- Operational. Events in an operational log also are useful for IT professionals, but they often require more interpretation. You can use operational events for analyzing and diagnosing a problem or occurrence, and trigger tools or tasks based on the problem or occurrence.
- Analytic and Debug. Analytic and debug logs are not as user-friendly as admin and operational logs. Analytic logs store events that trace an issue, and they often log a high volume of events. Developers use debug logs when debugging applications. Analytic and debug logs are not visible by default. If you want to review them, you first must configure Event Viewer to display them.
The System Information tool
The System Information (msinfo32.exe) tool displays information about a computer, including reports on installed hardware. You can use the System Information tool to look for hardware-resource conflicts, and to determine the resources that a hardware device is using, including the IRQ line, memory address range, and the base input/output (I/O) address range. You can use the System Information tool to show information from local computer, as well as from remote computers.
The Device Manager tool
As covered earlier, Device Manager displays information about the hardware installed on a computer, including hardware resource settings, device details, and driver information. You also can use Device Manager to perform driver rollback, check for hardware changes, enable and disable drivers, and, where necessary, uninstall drivers. You can use Device Manager to show information only from devices that are connected to a local computer. Service Manager in Windows cannot connect to remote computers.
Windows PowerShell
You can view detailed information about connected devices, as well as enable or disable connected devices, by using Windows PowerShell. You can view information about all connected devices by running the Get-PnpDevice cmdlet. You can view detailed information about a specific connected device, such as a mouse, by typing the following command at a command prompt, and then pressing Enter:
Get-PnpDevice –FriendlyName “HID-compliant mouse” \| Format-List
The Reliability and Performance Monitor tools
The Reliability and Performance Monitor console includes two monitoring tools:
- Reliability Monitor. The Reliability Monitor displays Windows reliability over time and any hardware failures that have occurred. You can use the Reliability Monitor to identify hardware-failure trends so that you can be more proactive in your administration. This can help you identify devices that suffer periodic failures, and replace them before they fail irreversibly.
- Performance Monitor. The Performance Monitor displays and collects performance information that pertains to hardware devices that are installed on a local computer and on remote computers. You can use this information to track performance deterioration that might be a warning sign of potential malfunctioning or failing hardware. The Performance Monitor also includes the System Diagnostics Data Collector Set, which collects the status of local hardware resources, configuration data, and info gathered by the System Information tool.
The Windows Memory Diagnostics tool
The Windows Memory Diagnostics Tool can detect and resolve physical memory problems automatically. If the Windows Memory Diagnostics Tool detects a faulty memory module or parity error, it displays a message in the system tray that prompts the user to diagnose and fix the problem. You can use Windows Memory Diagnostics to check the computer’s memory during the startup process. You can choose to restart the computer immediately and perform the check, or to schedule the memory check during the next computer restart. If you select an immediate check, ensure that you save any work in progress, and close any open windows before restarting the computer.
Centralized inventory
You can use additional products or services, for example Microsoft Endpoint Manager, to gather hardware information from devices in your company. You can review this information, and then generate reports or perform various actions, as needed, based on the device hardware.