Identify problematic query plans
The path most DBAs take to troubleshoot query performance is to first identify the problematic query (typically the query consuming the highest amount of system resources), and then retrieve that query’s execution plan. There are two scenarios. One is that the query consistently performs poorly. Consistent poor performance can be caused by a few different problems, including hardware resource constraints (though this situation typically won't affect a single query running in isolation), a suboptimal query structure, database compatibility settings, missing indexes, or poor choice of plan by the query optimizer. The second scenario is that the query performs well for some executions, but not others. This problem can be caused by a few other factors, the most common being data skew in a parameterized query that has an efficient plan for some executions, and a poor one for other executions. The other common factors in inconsistent query performance are blocking, where a query is waiting on another query to complete in order to gain access to a table, or hardware contention.
Let’s look at each of these potential problems in more detail.
Hardware constraints
Usually, hardware constraints won't manifest themselves with single query executions but will be evident when production load is applied and there's a limited number of CPU threads and a limited amount of memory to be shared among the queries. When you have CPU contention, it will usually be detectable by observing the performance monitor counter ‘% Processor Time’, which measures the CPU usage of the server. Looking deeper into SQL Server, you may see SOS_SCHEDULER_YIELD and CXPACKET wait types when the server is under CPU pressure. However, in some cases with poor storage system performance, even single executions of a query that is otherwise optimized can be slow. Storage system performance is best tracked at the operating system level using the performance monitor counters ‘Disk Seconds/Read’ and ‘Disk Seconds/Write’ which measure how long an I/O operation takes to complete. SQL Server will write to its error log if it detects poor storage performance (if an I/O takes longer than 15 seconds to complete). If you look at wait statistics and see a high percentage of PAGEIOLATCH_SH waits in your SQL Server, you might have a storage system performance issue. Typically, hardware performance is examined at a high level, early in the performance troubleshooting process, because it's relatively easy to evaluate.
Most database performance issues can be attributed to suboptimal query patterns, but in many cases running inefficient queries will put undue pressure on your hardware. For example, missing indexes could lead to CPU, storage, and memory pressure by retrieving more data than is required to process the query. It's recommended that you address suboptimal queries and tune them, before addressing hardware issues. We’ll start looking at query tuning next.
Suboptimal query constructs
Relational databases perform best when executing set-based operations. Set-based operations perform data manipulation (INSERT, UPDATE, DELETE, and SELECT) in sets, where work is done on a set of values and produces either a single value or a result set. The alternative to set-based operations is to perform row-based work, using a cursor or a while loop. This type of processing is known as row-based processing, and its cost increases linearly with the number of rows impacted. That linear scale is problematic as data volumes grow for an application.
While detecting suboptimal use of row-based operations with cursors or WHILE loops is important, there are other SQL Server anti-patterns that you should be able to recognize. Table-valued functions (TVF), particularly multi-statement table-valued functions, caused problematic execution plan patterns prior to SQL Server 2017. Many developers like to use multi-statement table valued functions because they can execute multiple queries within a single function and aggregate the results into a single table. However, anyone writing T-SQL code needs to be aware of the possible performance penalties for using TVFs.
SQL Server has two types of table-valued functions, inline and multi-statement. If you use an inline TVF, the database engine treats it just like a view. Multi-statement TVFs are treated just like another table when processing a query. Because TVFs are dynamic and as such, SQL Server doesn't have statistics on them, it used a fixed row count when estimating the query plan cost. A fixed count can be fine, if the number of rows is small, however if the TVF returns thousands or millions of rows, the execution plan could be inefficient.
Another anti-pattern has been the use of scalar functions, which have similar estimation and execution problems. Microsoft has made significant performance improvement with the introduction of Intelligent Query Processing, under compatibility levels 140 and 150.
SARGability
The term SARGable in relational databases refers to a predicate (WHERE clause) in a specific format that can use an index to speed up execution of a query. Predicates in the correct format are called ‘Search Arguments’ or SARGs. In SQL Server, using a SARG means that the optimizer will evaluate using a nonclustered index on the column referenced in the SARG for a SEEK operation, instead of scanning the entire index (or the entire table) to retrieve a value.
The presence of a SARG doesn't guarantee the use of an index for a SEEK. The optimizer’s costing algorithms could still determine that the index was too expensive. This could be the case if a SARG refers to a large percentage of rows in a table. The absence of a SARG does mean that the optimizer won't even evaluate a SEEK on a nonclustered index.
Some examples of expressions that aren't SARGs (sometimes said to be non-sargable) are those that include a LIKE clause with a wildcard at the beginning of the string to be matched, for example, WHERE lastName LIKE ‘%SMITH%’. Other predicates that aren't SARGs occur when using functions on a column, for example, WHERE CONVERT(CHAR(10), CreateDate,121) = ‘2020-03-22’. These queries with non-sargable expressions are typically identified by examining execution plans for index or table scans, where seeks should otherwise be taking place.
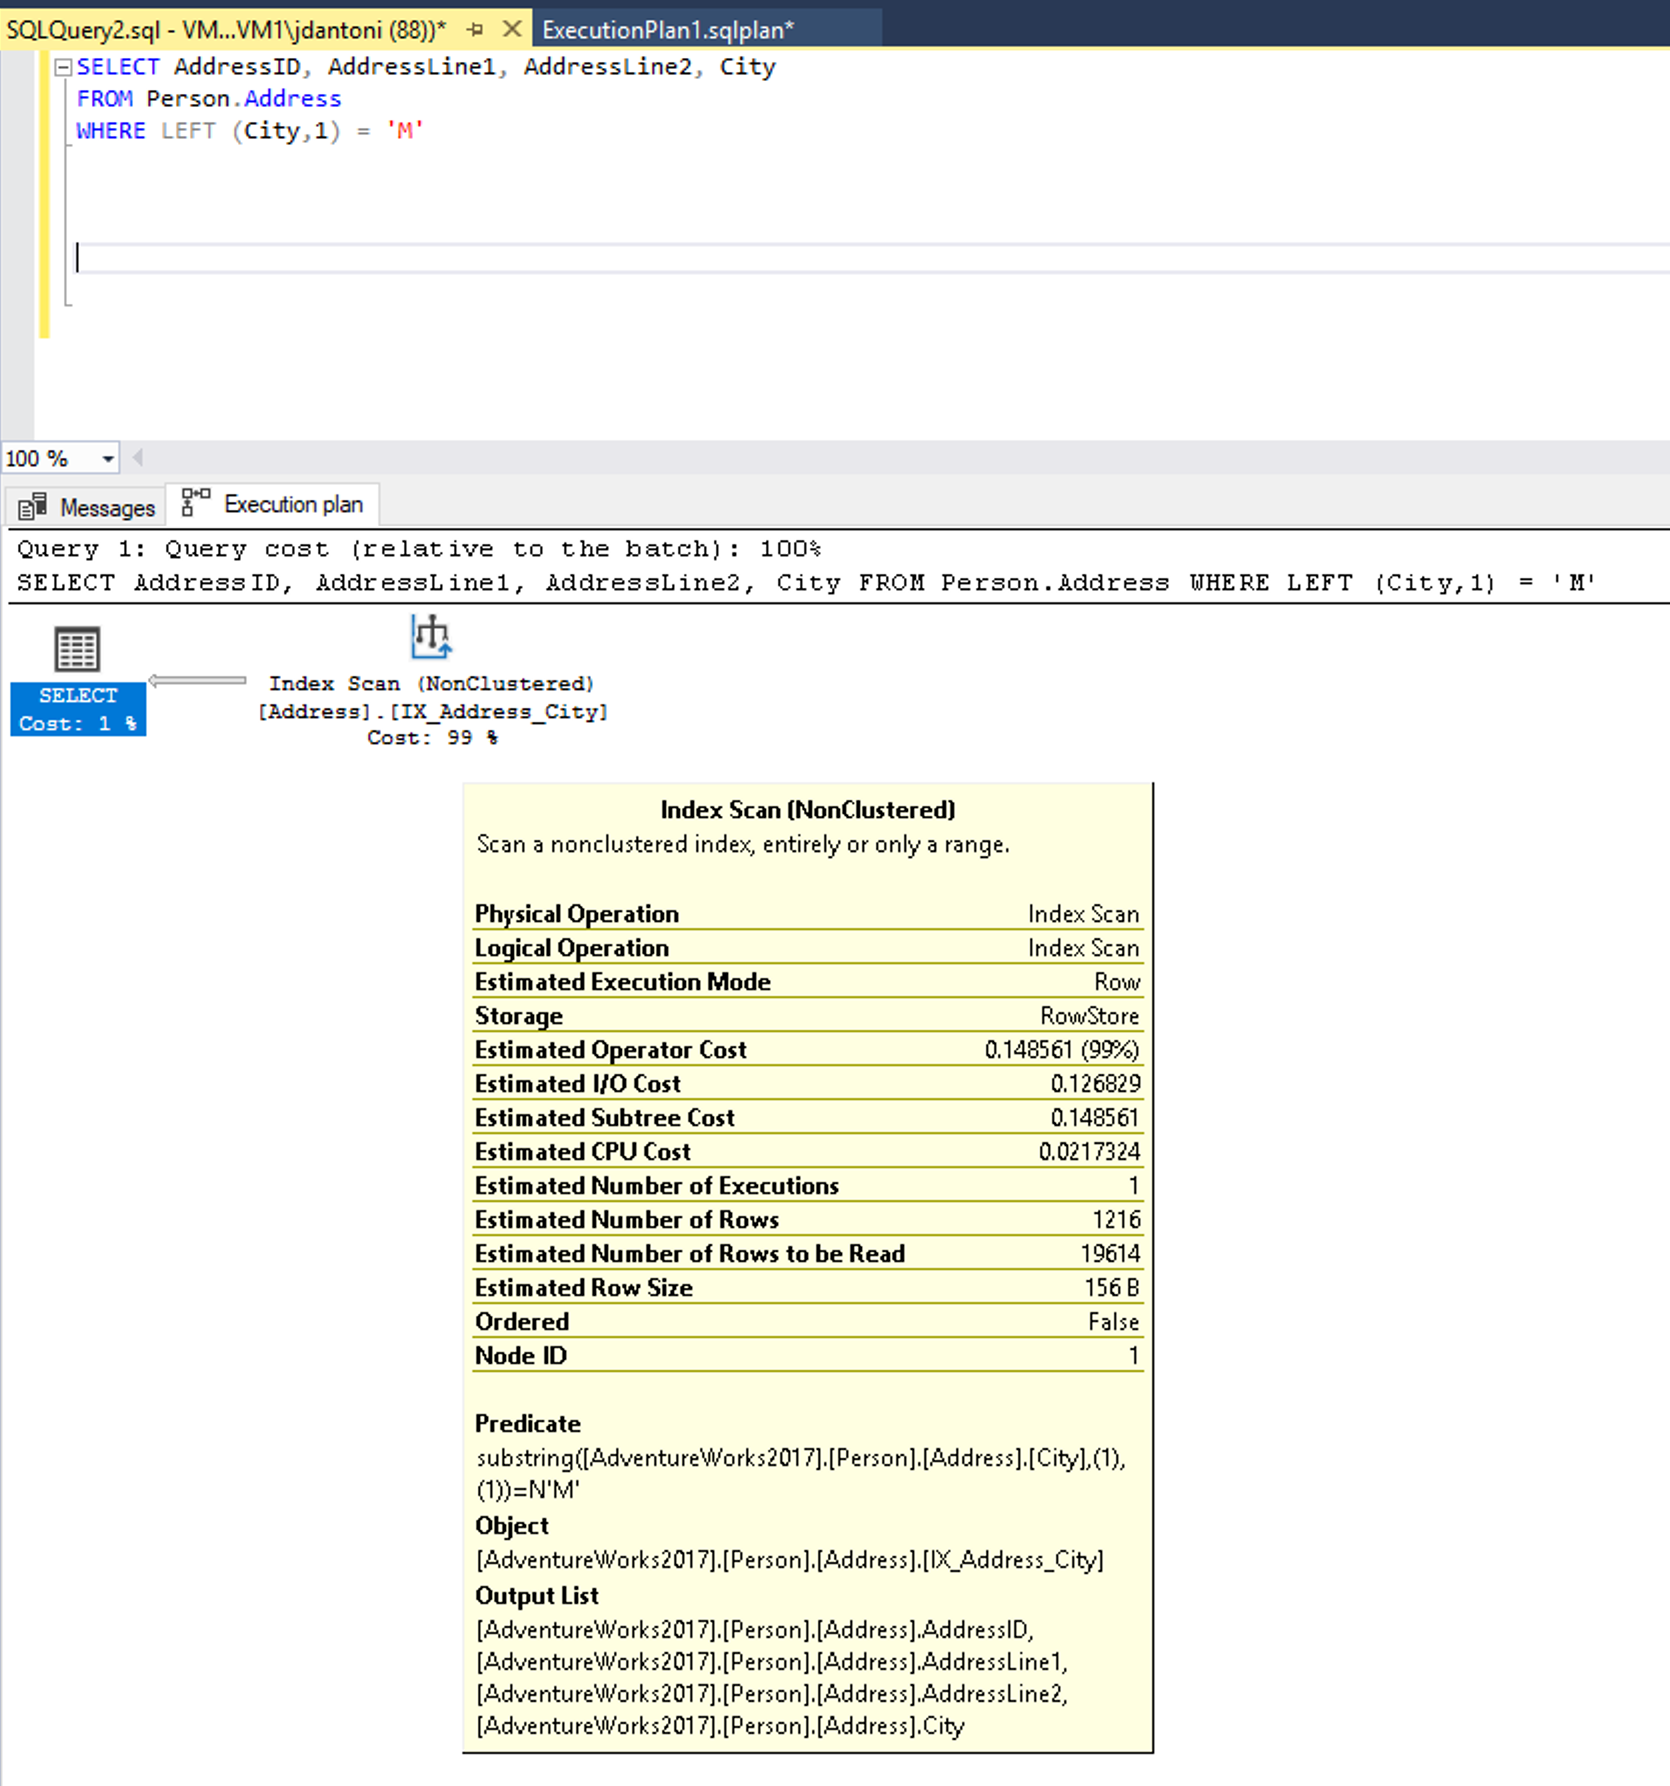
There's an index on the City column that is being used in the WHERE clause of the query and while it's being used in this execution plan above, you can see the index is being scanned, which means the entire index is being read. The LEFT function in the predicate makes this expression non-SARGable. The optimizer won't evaluate using an index seek on the index on the City column.
This query could be written to use a predicate that is SARGable. The optimizer would then evaluate a SEEK on the index on the City column. An index seek operator, in this case, would read a much smaller set of rows, as shown below.
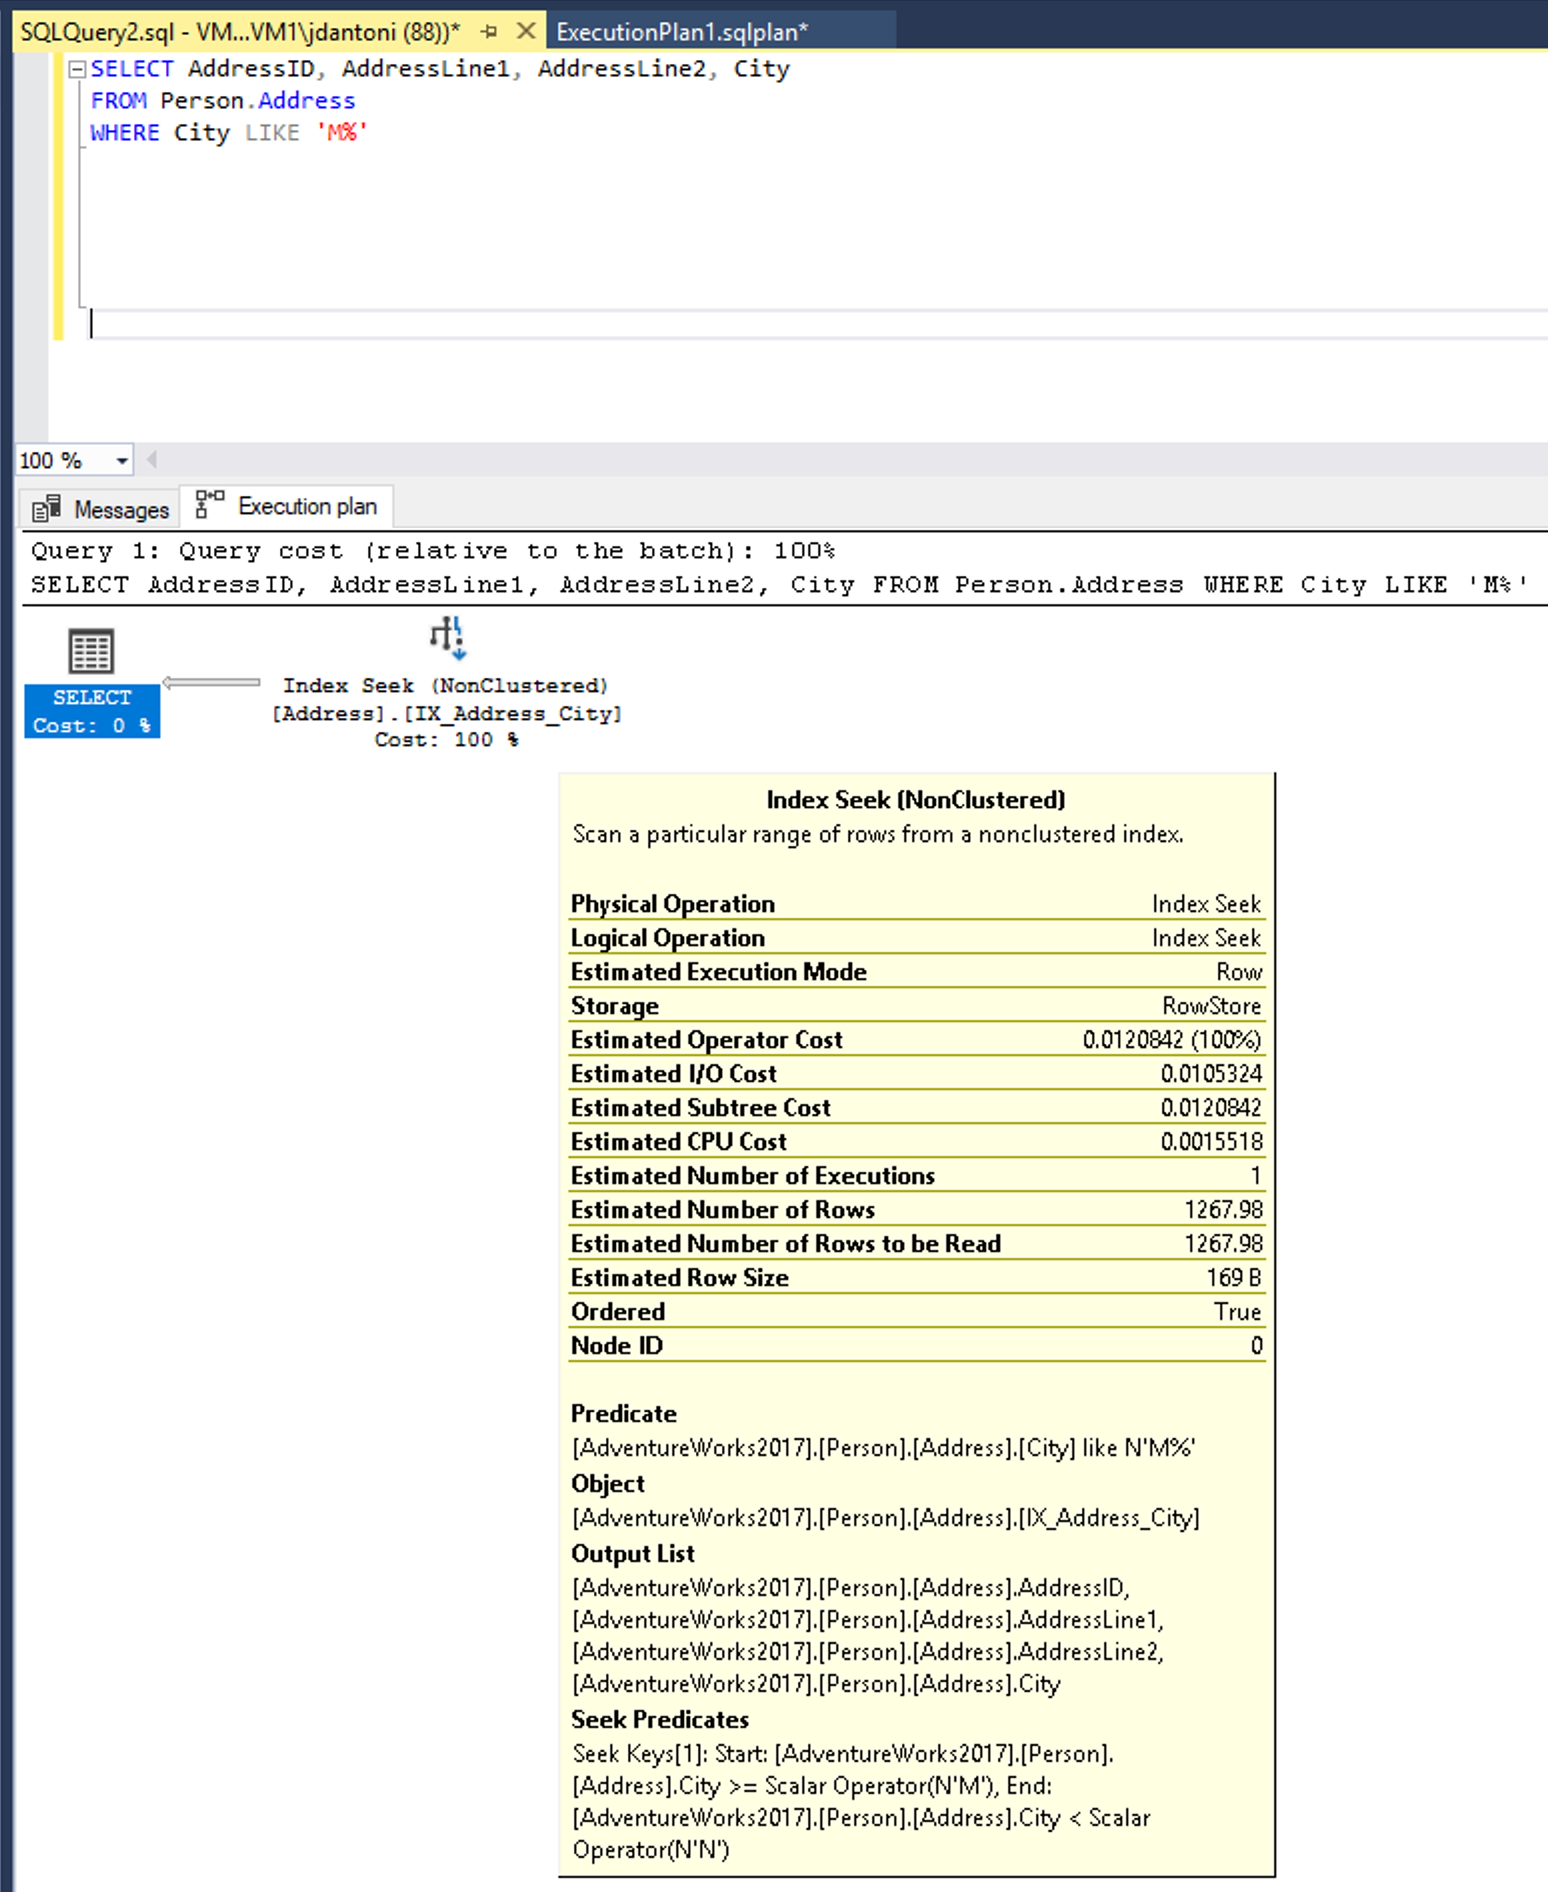
Changing LEFT function into a LIKE results in an index seek.
Note
The LIKE keyword, in this instance, does not have a wildcard on the left, so it is looking for cities that begin with M. If it was “two-sided” or started with a wildcard ('%M%' or '%M') it would be non-SARGable. The seek operation is estimated to return 1267 rows, or approximately 15% of the estimate for the query with the non-SARGable predicate.
Some other database development anti-patterns are treating the database as a service rather than a data store. Using a database to convert data to JSON, manipulate strings, or perform complex calculations can lead to excessive CPU use and increased latency. Queries that try to retrieve all records and then perform computations in the database can lead to excessive IO and CPU usage. Ideally, you should use the database for data access operations and optimized database constructs like aggregation.
Missing indexes
The most common performance problems we see as database administrators are due to a lack of useful indexes causing the engine to read far more pages than necessary to return the results of a query. While indexes aren't free in terms of resources (adding more indexes to a table can affect write performance and consume space), the performance gains they offer can offset the extra resource costs many times over. Frequently execution plans with these performance issues can be identified by the query operator Clustered Index Scan or the combination of the Nonclustered Index Seek and Key Lookup (which is more indicative of missing columns in an existing index).
The database engine attempts to help with this problem by reporting on missing indexes in execution plans. The names and details of the recommended indexes are available through a dynamic management view called sys.dm_db_missing_index_details. There are also other DMVs in SQL Server like sys.dm_db_index_usage_stats and sys.dm_db_index_operational_stats, which highlight the utilization of existing indexes.
It may make sense to drop an index that isn't used by any queries in the database. The missing index DMVs and plan warnings should only be used as a starting point for tuning your queries. It’s important to understand what your key queries are and build indexes to support those queries. Creating all missing indexes without evaluating indexes in the context of each other isn't recommended.
Missing and out-of-date statistics
You've learned about the importance of column and index statistics to the query optimizer. It's also important to understand conditions that can lead to out-of-date statistics, and how this problem can manifest itself in SQL Server. Azure SQL offerings default to having auto-update statistics set to ON. Prior to SQL Server 2016, the default behavior of auto-update statistics was to not update statistics until the number of modifications to columns in the index was equal to about 20% of the number of rows in a table. Because of this behavior, you could have data modifications that were significant enough to change query performance, but not update the statistics. Any plan that used the table with the changed data would be based on out-of-date statistics and would frequently be suboptimal.
Prior to SQL Server 2016, you had the option of using trace flag 2371, which changed the required number of modifications to be a dynamic value, so as your table grew in size, the percentage of row modifications that was required to trigger a statistics update got smaller. Newer versions of SQL Server, Azure SQL Database and Azure SQL Managed Instance support this behavior by default. There's also a dynamic management function called sys.dm_db_stats_properties, which shows you the last time statistics were updated and the number of modifications that have been made since the last update, which allows you to quickly identity statistics that might need to be manually updated.
Poor optimizer choices
While the query optimizer does a good job of optimizing most queries, there are some edge cases where the cost-based optimizer may make impactful decisions that aren't fully understood. There are many ways to address this including using query hints, trace flags, execution plan forcing, and other adjustments in order to reach a stable and optimal query plan. Microsoft has a support team that can help troubleshoot these scenarios.
In the below example from the AdventureWorks2017 database, a query hint is being use to tell the database optimizer to always use a city name of Seattle. This hint won't guarantee the best execution plan for all city values, but it will be predictable. The value of ‘Seattle’ for @city_name will only be used during optimization. During execution, the actual supplied value (‘Ascheim’) will be used.
DECLARE @city_name nvarchar(30) = 'Ascheim',
        @postal_code nvarchar(15) = 86171;

SELECT *
FROM Person.Address
WHERE City = @city_name
      AND PostalCode = @postal_code
OPTION (OPTIMIZE FOR (@city_name = 'Seattle');
As seen in the example, the query uses a hint (the OPTION clause) to tell the optimizer to use a specific variable value to build its execution plan.
Parameter sniffing
SQL Server caches query execution plans for future use. Since the execution plan retrieval process is based on the hash value of a query, the query text has to be identical for every execution of the query for the cached plan to be used. In order to support multiple values in the same query, many developers use parameters, passed in through stored procedures, as seen in the example below:
CREATE PROC GetAccountID (@Param INT)
AS

<other statements in procedure>

SELECT accountid FROM CustomerSales WHERE sales > @Param;

<other statements in procedure>

RETURN;

-- Call the procedure:

EXEC GetAccountID 42;
Queries can also be explicitly parameterized using the procedure sp_executesql. However, explicit parameterization of individual queries is usually done through the application with some form (depending on the API) of PREPARE and EXECUTE. When the database engine executes that query for the first time, it will optimize the query based on the initial value of the parameter, in this case, 42. This behavior, called parameter sniffing, allows for the overall workload of compiling queries to be reduced on the server. However, if there's data skew, query performance could vary widely.
For example, a table that had 10 million records, and 99% of those records have an ID of 1, and the other 1% are unique numbers, performance will be based on which ID was initially used to optimize the query. This wildly fluctuating performance is indicative of data skew and isn't an inherent problem with parameter sniffing. This behavior is a fairly common performance problem that you should be aware of. You should understand the options for alleviating the issue. There a few ways to address this problem, but they each come with tradeoffs:
- Use the
RECOMPILEhint in your query, or theWITH RECOMPILEexecution option in your stored procedures. This hint will cause the query or procedure to be recompiled every time it's executed, which will increase CPU utilization on the server but will always use the current parameter value. - You can use the
OPTIMIZE FOR UNKNOWNquery hint. This hint will cause the optimizer to choose to not sniff parameters and compare the value with column data histogram. This option won't get you the best possible plan but will allow for a consistent execution plan. - Rewrite your procedure or queries by adding logic around parameter values to only RECOMPILE for known troublesome parameters. In the example below, if the SalesPersonID parameter is NULL, the query will be executed with the
OPTION (RECOMPILE).
CREATE OR ALTER PROCEDURE GetSalesInfo (@SalesPersonID INT = NULL)
AS
DECLARE  @Recompile BIT = 0
         , @SQLString NVARCHAR(500)

SELECT @SQLString = N'SELECT SalesOrderId, OrderDate FROM Sales.SalesOrderHeader WHERE SalesPersonID = @SalesPersonID'

IF @SalesPersonID IS NULL
BEGIN
     SET @Recompile = 1
END

IF @Recompile = 1
BEGIN
    SET @SQLString = @SQLString + N' OPTION(RECOMPILE)'
END

EXEC sp_executesql @SQLString
    ,N'@SalesPersonID INT'
    ,@SalesPersonID = @SalesPersonID
GO
The example above is a good solution but it does require a fairly large development effort, and a firm understanding of your data distribution. It also may require maintenance as the data changes.