Add observability to a cloud-native application
Now that you understand the importance of observability, you'll see how you can include it in your cloud-native application. You do this step by adding OpenTelemetry to your app.
Add OpenTelemetry to your app
.NET has a rich ecosystem of built-in observability tools that produce logging, metrics, and tracing data. You can use these tools to add observability to your cloud-native application. These libraries are:
- Logging:
Microsoft.Extensions.Logging.ILogger - Metrics:
System.Diagnostics.Metrics.Meter - Tracing:
System.Diagnostics.ActivityandSystem.Diagnostics.ActivitySource
OpenTelemetry consumes all the preceding telemetry, but first your cloud-native app needs to add OpenTelemetry support via NuGet packages. These packages can be categorized into three groups:
| Category | Package | Description |
|---|---|---|
| Core API | OpenTelemetry | The main library that provides the core OpenTelemetry functionality. |
| Core API | OpenTelemetry.Extensions.Hosting | Provides extension methods for automatically starting and stopping OpenTelemetry tracing in ASP.NET Core hosts. |
| Instrumentation | OpenTelemetry.Instrumentation.AspNetCore | Instrumentation for ASP.NET Core applications. This package collects a great number of metrics about your app without you having to write any code. |
| Exporter | OpenTelemetry.Exporter.Console | Exporter for the console allows the app to write out telemetry to the console. |
Many more instrumentation and exporter packages are available to include in your cloud-native app. For more information, see .NET observability with OpenTelemetry. Depending on the type of app you're building, you can add the packages that are most relevant to you.
This module focuses on using OpenTelemetry with the eShopLite cloud-native app. This app is built with .NET Core and Blazor WebAssembly, so it means that all the code examples are based on taking advantage of dependency injection.
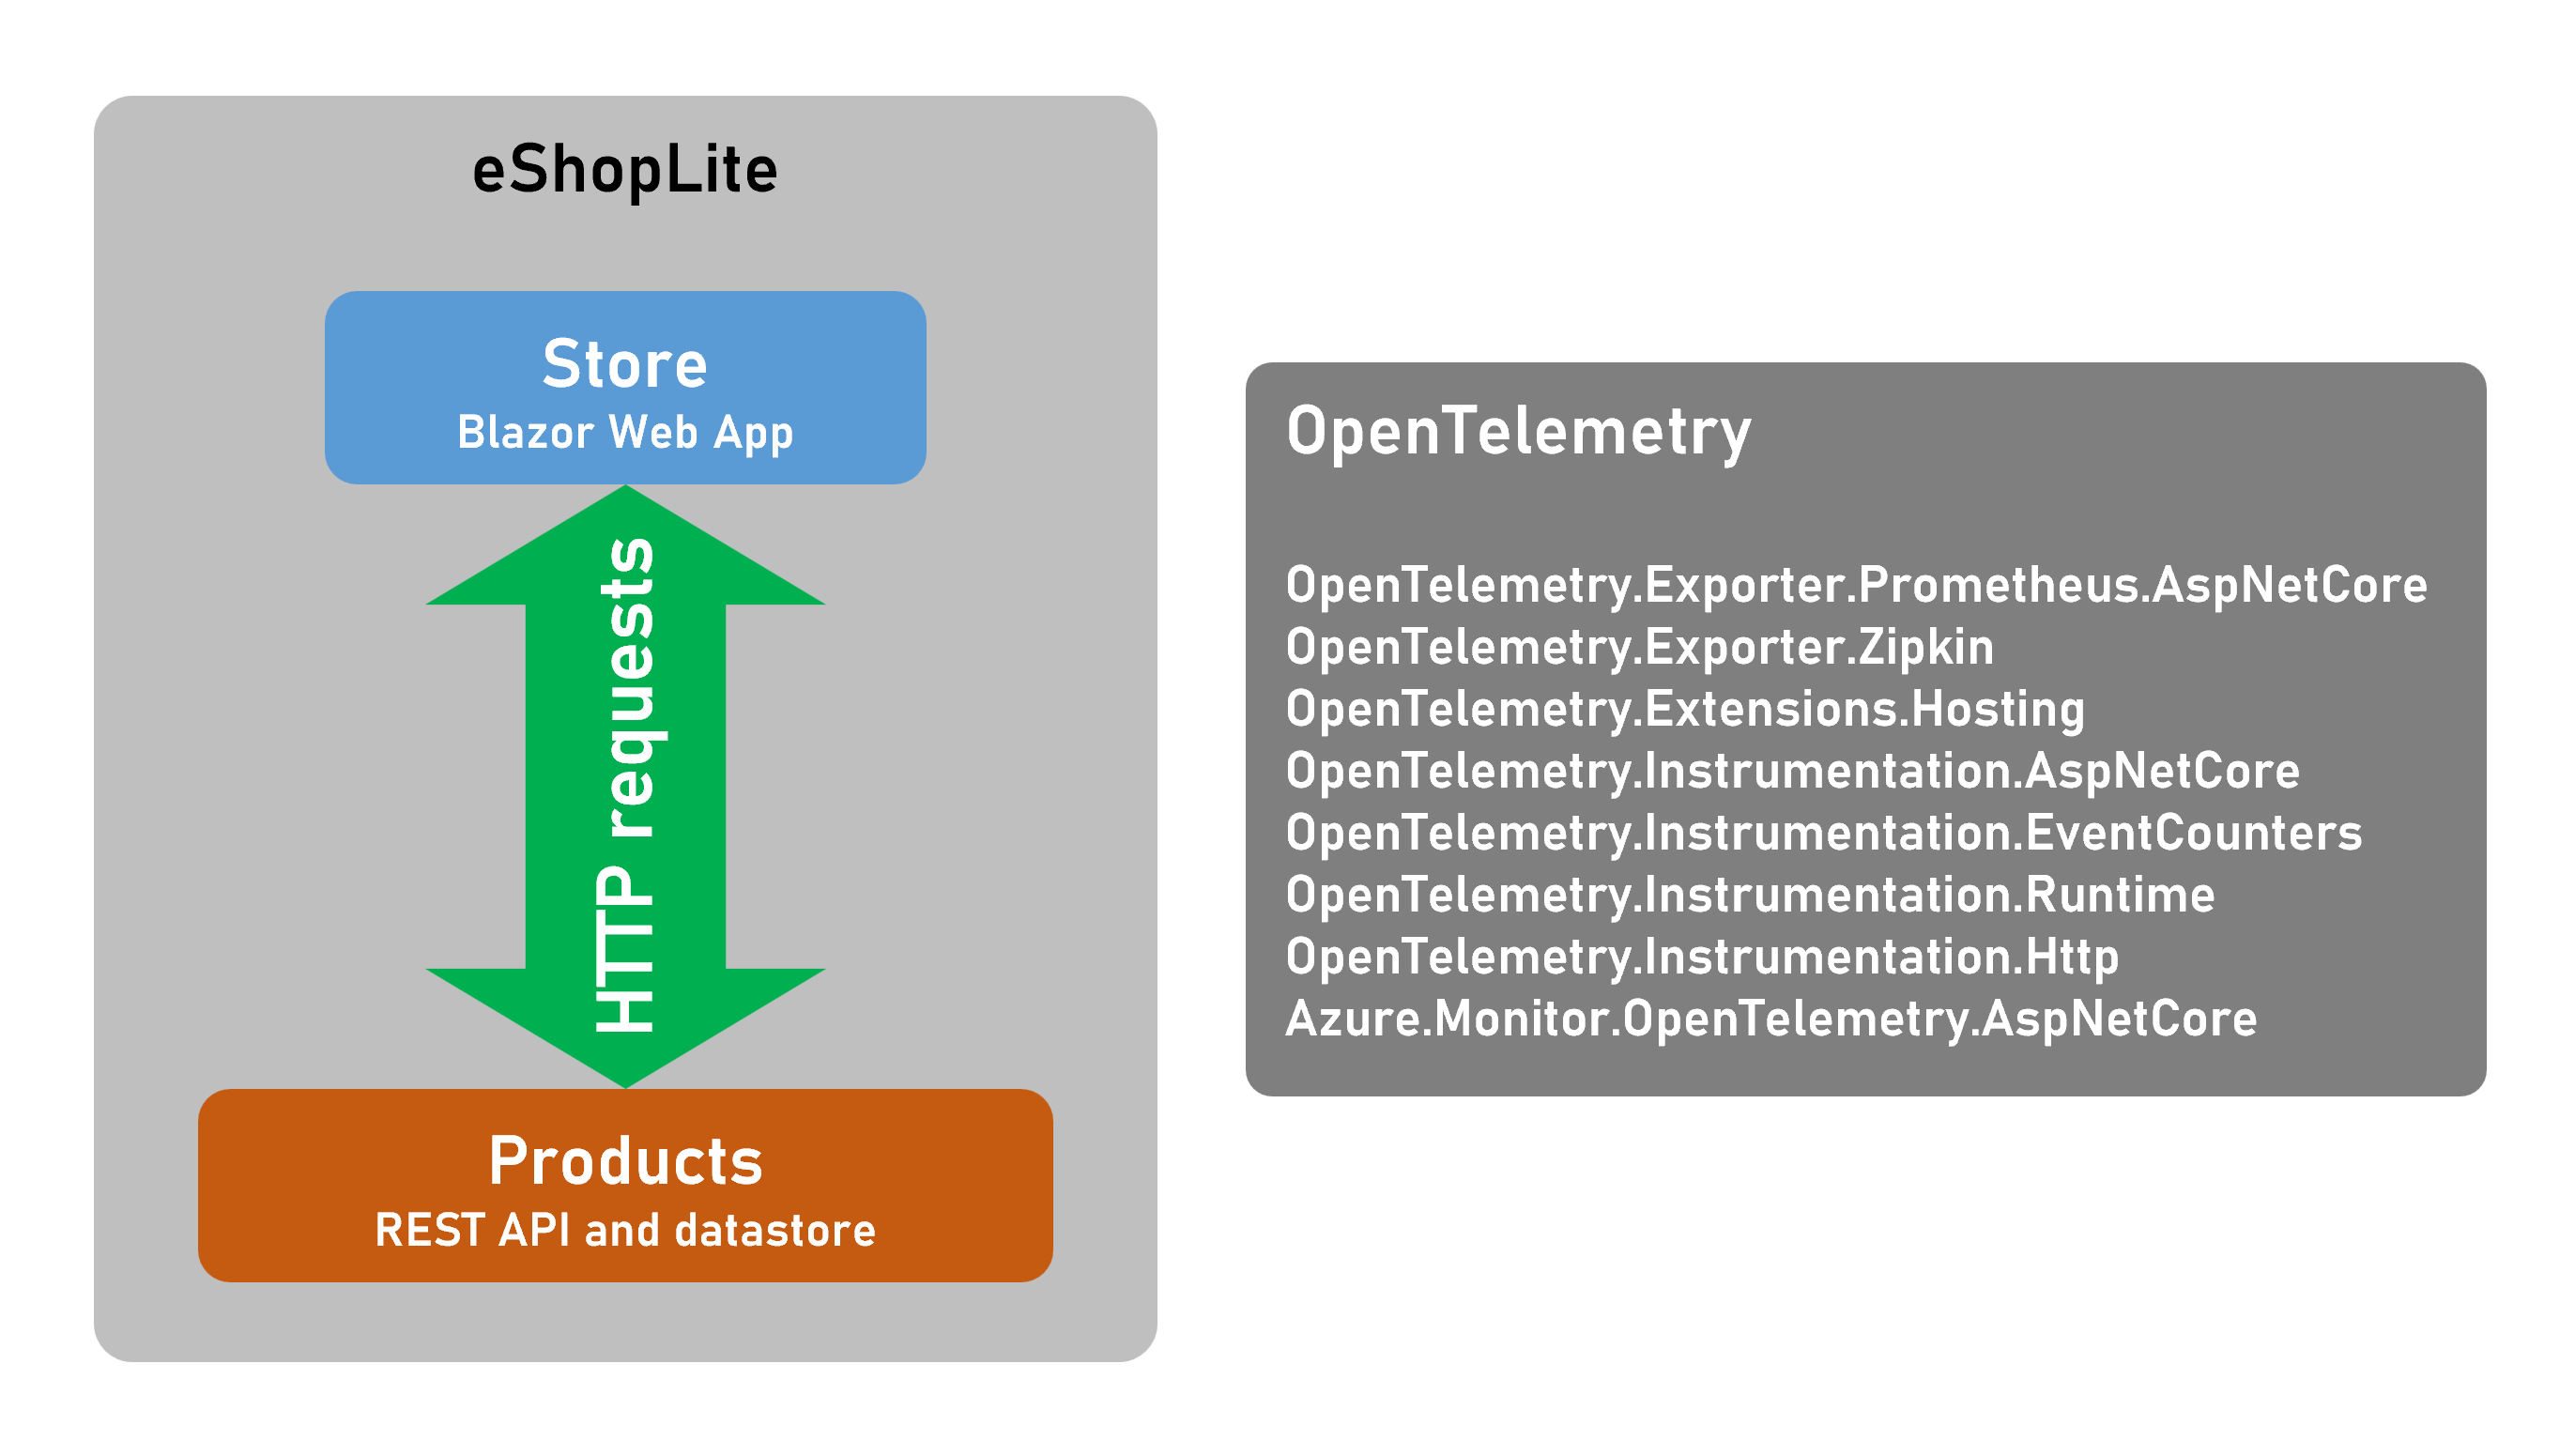
You could choose to include all the OpenTelemetry packages to both the Products and Store services in the microservices app. However, in a real-world app, you have many more services. Adding all these packages to each one involves unnecessary duplication. A better approach is to add a new diagnostics project to your solution that any microservice can reference to be observed.
Here's some example code that creates a method AddObservability that a microservice can call to use OpenTelemetry:
using OpenTelemetry.Metrics;
using OpenTelemetry.Resources;
using OpenTelemetry.Trace;

namespace Microsoft.Extensions.DependencyInjection;

public static class DiagnosticServiceCollectionExtensions
{
  public static IServiceCollection AddObservability(this IServiceCollection services,
      string serviceName,
      IConfiguration configuration)
  {
    // create the resource that references the service name passed in
    var resource = ResourceBuilder.CreateDefault().AddService(serviceName: serviceName, serviceVersion: "1.0");

    // add the OpenTelemetry services
    var otelBuilder = services.AddOpenTelemetry();

    otelBuilder
        // add the metrics providers
        .WithMetrics(metrics =>
        {
          metrics
            .SetResourceBuilder(resource)
            .AddRuntimeInstrumentation()
            .AddAspNetCoreInstrumentation()
            .AddHttpClientInstrumentation()
            .AddEventCountersInstrumentation(c =>
            {
              c.AddEventSources(
                      "Microsoft.AspNetCore.Hosting",
                      "Microsoft-AspNetCore-Server-Kestrel",
                      "System.Net.Http",
                      "System.Net.Sockets");
            })
            .AddMeter("Microsoft.AspNetCore.Hosting", "Microsoft.AspNetCore.Server.Kestrel")
            .AddConsoleExporter();

        })
        // add the tracing providers
        .WithTracing(tracing =>
        {
          tracing.SetResourceBuilder(resource)
                      .AddAspNetCoreInstrumentation()
                      .AddHttpClientInstrumentation()
                      .AddSqlClientInstrumentation();
        });

    return services;
  }

  // Add the Prometheus endpoints to your service, this will expose the metrics at http://service/metrics
  public static void MapObservability(this IEndpointRouteBuilder routes)
  {
    routes.MapPrometheusScrapingEndpoint();
  }
}
The method returns an IServiceCollection class that can be added as a service to an ASP.NET Core WebApplicationBuilder.
This action then creates a variable var otelBuilder = services.AddOpenTelemetry() to store the OpenTelemetry builder. The code can then add metrics and traces to otelBuilder.
For example, this configuration adds instrumentation for:
- ASP.NET Core
- C# Runtime
- HttpCLient
- Kestrel web server
These metrics are displayed in the console. The .AddConsoleExporter() method adds the exporter to the builder.
It also adds tracing to the console for:
- ASP.NET Core
- HttpClient
- SQL Client
The last line returns the IServiceCollection class.
With the diagnostic project completed, it's as simple as adding a reference to the project and a single line of code to the service. For example, to include OpenTelemetry in the Products service, add the project reference in your Product.csproj file:
<ProjectReference Include="..\Diagnostics\Diagnostics.csproj" />
Then add the following line to the Program.cs file under your declaration of builder:
var builder = WebApplication.CreateBuilder(args);

builder.Services.AddObservability("Products", builder.Configuration);
Let's add this code to the Products services in the eShopLite app.