View telemetry with Azure Monitor and third-party tools
Your app is collecting telemetry data and you now need a more comprehensive way to view it. In this unit, you'll see how to view telemetry data in many different tools.
Monitor and view telemetry data
A common way to view telemetry data is to use Prometheus and Grafana together. Prometheus is an open-source monitoring system that collects metrics from your cloud-native app. Grafana is an open-source visualization tool that you use to create dashboards to view the metrics collected by Prometheus.
Prometheus
The first step is to add a Prometheus container and configure it to collect data from each microservice in your app. You then add the Prometheus .NET client library to collect metrics from the app.

OpenTelemetry provides an exporter for Prometheus. You can add this exporter to your app by including the OpenTelemetry.Exporter.Prometheus.AspNetCore NuGet package. This package exports metrics to Prometheus in a format that it can understand. You replace the current console exporter with the Prometheus exporter.
You add the endpoints for all the microservices in your app. For example:
global:
  scrape_interval: 1s

scrape_configs:
  - job_name: 'products'
    static_configs:
      - targets: ['backend:8080']
  - job_name: 'store'
    static_configs:
      - targets: ['frontend:8080']
Grafana
Grafana is an open-source visualization tool that you can use to create dashboards to view the metrics collected by Prometheus. You can configure Grafana to connect to Prometheus and display the metrics in a dashboard. Like before, you add a Grafana container to your app and configure it to connect to Prometheus.

You add Prometheus as a data source to Grafana in a YAML file:
apiVersion: 1

datasources:
- name: Prometheus
  type: prometheus
  url: http://prometheus:9090
  isDefault: true
  access: proxy
  editable: true
Enable distributed tracing
OpenTelemetry has support for both Jaeger and Zipkin. In this module, you use Zipkin, which is an open-source distributed tracing system. It helps gather timing data needed to troubleshoot latency problems in microservice architectures. It manages both the collection and lookup of this data.
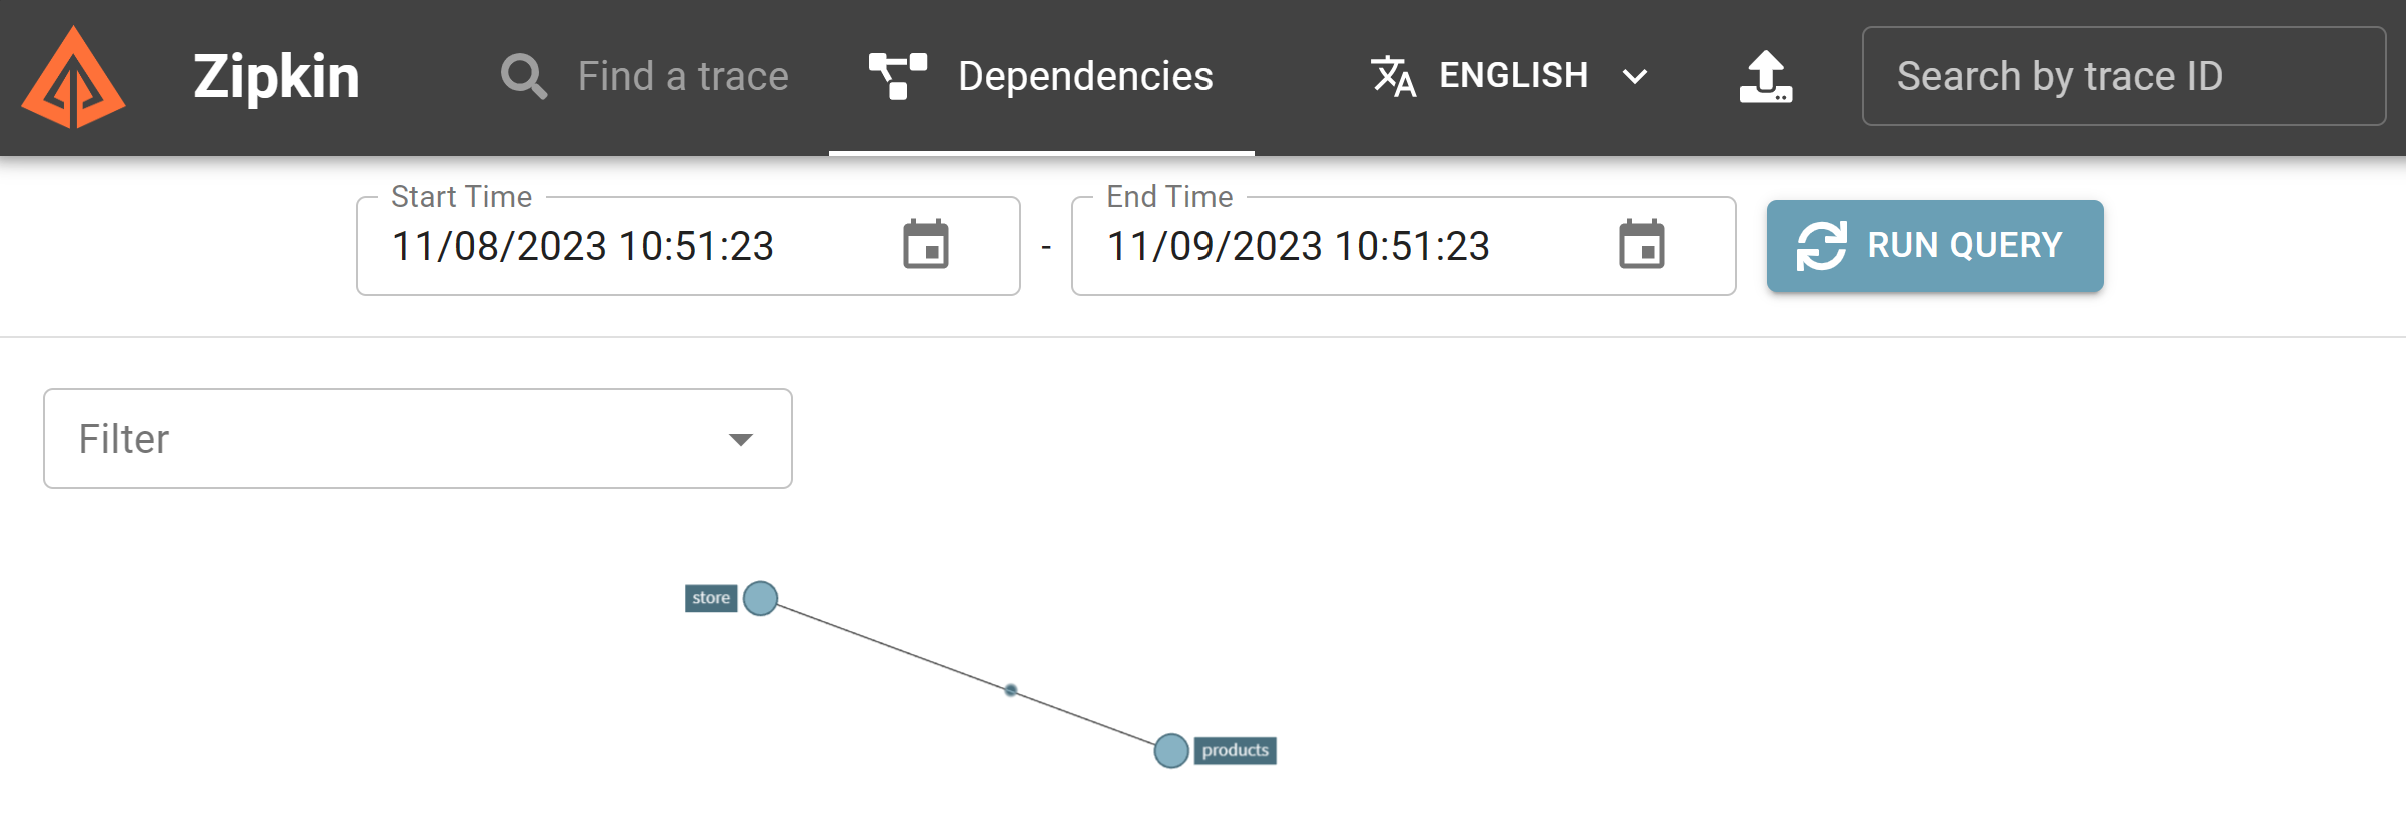
In your diagnostics project, you need to add support for Zipkin via the OpenTelemetry.Exporter.Zipkin NuGet package. You then add code to the AddObservability method to export data to Zipkin.
Go deeper with Application Insights
There's a tool that can combine looking at metrics and viewing distributed tracing and then merge it with data from logs. Application Insights is an extensible Application Performance Management (APM) service. You can use it to monitor your live web application. Application Insights automatically detects performance anomalies. It includes powerful analytics tools to help you diagnose issues and understand what users actually do with your app.

Like the preceding tools, you need to add a NuGet package to your solution Azure.Monitor.OpenTelemetry.AspNetCore and then introduce Azure Monitor as an exporter to your diagnostics project.