Exercise - Extend telemetry in .NET 8
The current eShopLite app is using the default telemetry provided by OpenTelemetry. You can extend the telemetry by adding custom metrics and custom attributes to the telemetry data. This capability allows you to add more context to the telemetry data and to create more powerful queries in Application Insights.
In this exercise, you add new metrics to apps and see how to view them in your observability apps.
Create a custom metric
You want to have greater visibility of how a stock changes over time, so you create a custom metric.
In Visual Studio Code, on the EXPLORER pane, right-click the Products folder and then select New File.
In the File name field, enter ProductsMetrics.cs.
In the text editor, replace the code with this example:
using System;
using System.Diagnostics.Metrics;

public class ProductsMetrics
{
    private readonly Counter<int> _serviceCalls;
    private readonly Counter<int> _stockChange;

    public ProductsMetrics(IMeterFactory meterFactory)
    {
        var meter = meterFactory.Create("eShopLite.Products");
        _stockChange = meter.CreateCounter<int>("eshoplite.products.stock_change", unit: "{stock}", description: "Amount of stock being changed through the product service.");
    }

    public void StockChange(int quantity)
    {
        _stockChange.Add(quantity);
    }
}
The preceding code creates a new metric called
eshoplite.products.stock_change. This metric tracks the amount of stock being changed through the product service.Select Ctrl+S to save the file.
On the EXPLORER pane, in the Products folder, select Program.cs.
Replace the
AddObservabilitycode with this code:builder.Services.AddObservability("Products", builder.Configuration, ["eShopLite.Products"]); // Register the metrics service. builder.Services.AddSingleton<ProductsMetrics>();This code adds the
ProductsMetricsclass to the dependency injection container.Select Ctrl+S to save the file.
On the EXPLORER pane, in the Products folder, expand the Endpoint folder and then select ProductEndpoints.cs.
Replace the existing stock update
MapPutendpoint with this code:stock.MapPut("/{id}", async (int id, int stockAmount, ProductDataContext db, ProductsMetrics metrics) => { // Increment the stock change metric. metrics.StockChange(stockAmount); var affected = await db.Product .Where(model => model.Id == id) .ExecuteUpdateAsync(setters => setters .SetProperty(m => m.Stock, stockAmount) ); return affected == 1 ? Results.Ok() : Results.NotFound(); })You use dependency injection to add the
ProductsMetricsclass to the endpoint. You're then calling theStockChangemethod to increment the metric with the new stock amount.Select Ctrl+S to save the file.
Add the metric to OpenTelemetry
You now add the metric to OpenTelemetry so that it can be exported to your observability tools.
On the EXPLORER pane, in the Diagnostics folder, select DiagnosticServiceCollectionExtensions.
Change the
AddObservabilitymethod to accept a new parameter:public static IServiceCollection AddObservability(this IServiceCollection services, string serviceName, IConfiguration configuration, string[]? meeterNames = null)Below the Prometheus exporter line, add this code:
.AddPrometheusExporter();

// add any additional meters provided by the caller
if (meeterNames != null)
{
  foreach (var name in meeterNames)
  {
    metrics.AddMeter(name);
  }
}
Select Ctrl+S to save the file.
View the new metric in Prometheus
On the TERMINAL pane at the bottom, go to the dotnet-observability/eShopLite folder.
cd ..Update the apps containers.
dotnet publish /p:PublishProfile=DefaultContainerGo to the dotnet-observability folder, and start the app with Docker:
cd ..
docker compose up
Open the eShopLite app in a browser at
http://localhost:32000.Go to the Products page and change the stock amount on several products.
Open the Prometheus dashboard at
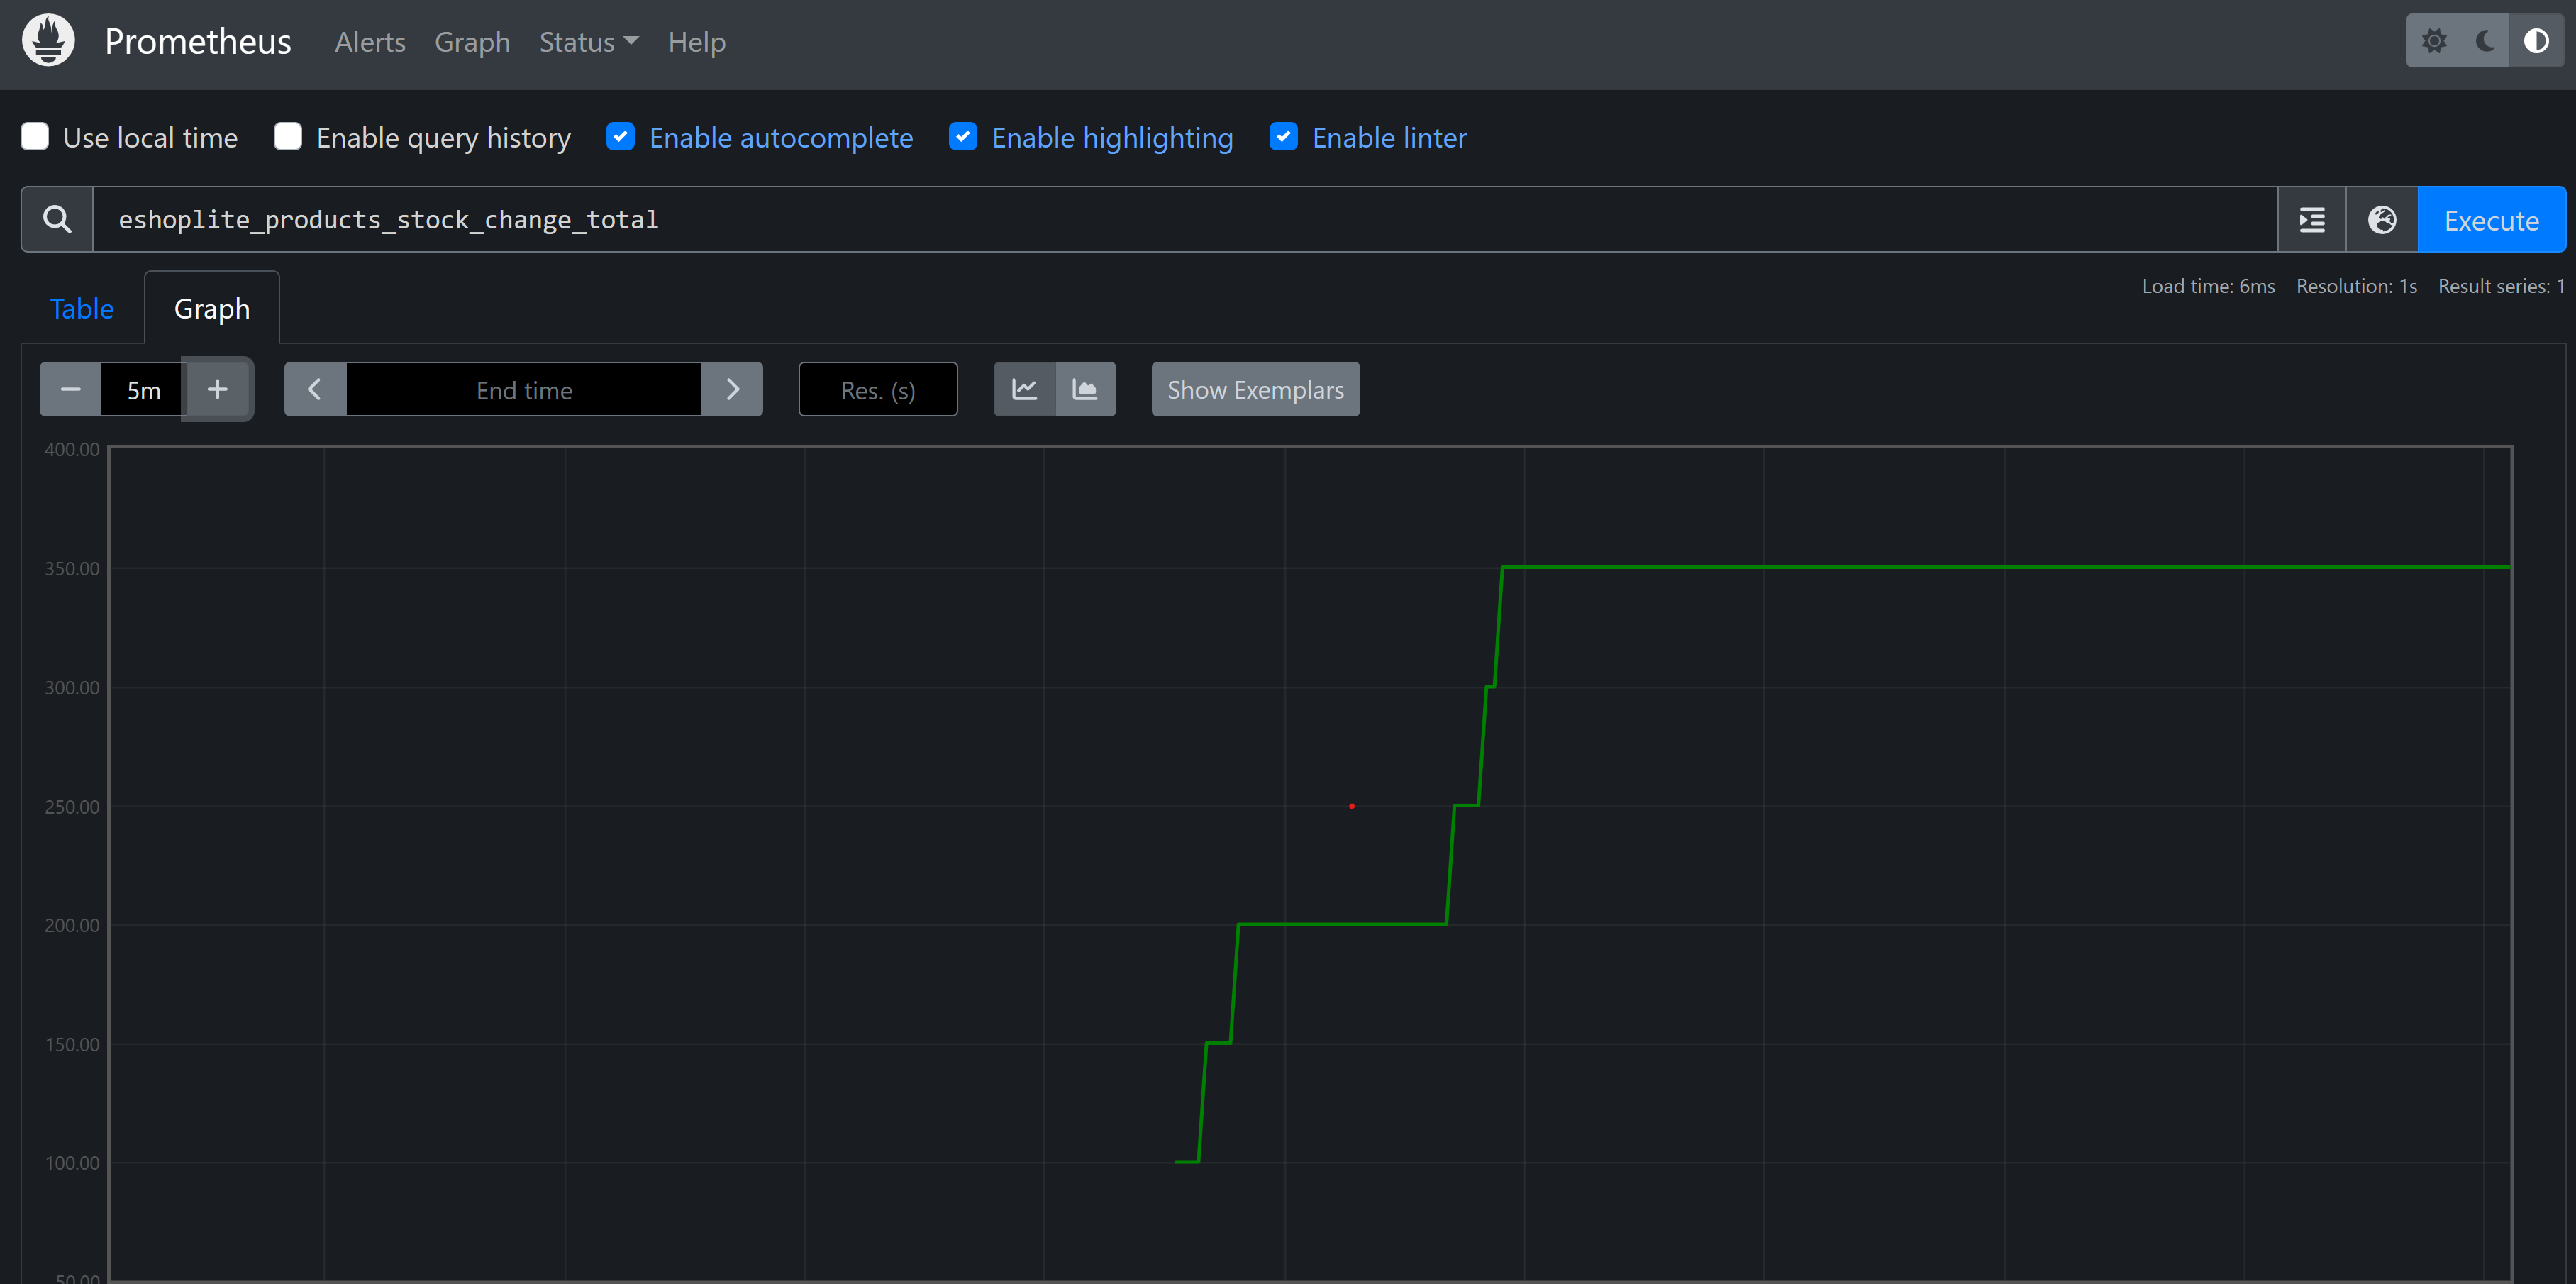
http://localhost:9090.In the search box, enter the
eshoplite_products_stock_change_totalmetric and then select Execute.You should see it listed in a table.
Select the Graph tab. You should see the stock amount change over time.
On the TERMINAL pane, press Ctrl+C to stop the app.
