The post-incident review process
A key part of a post-incident review is the construction of a shared, accurate chronology that reflects the non-linear nature of an incident.
By non-linear, we mean that incidents are almost never just “this thing happens, and then that happened, then we noticed, then we did something, and then we are done”. People come in and out, different people notice and try different things, some work, some don’t. And if multiple people are working at the same time, these things can happen at the same time too. So it is a bit more complicated.
To create a timeline like this, even a complex one, there's always an important first step: gather the data.
Gather the data
Before you can conduct a post-incident review, you first need to gather data. Specifically, you need to collect as much of the conversation and context (both technical and non-technical) surrounding the event as you can so you can use all of the crucial data contained in it. The conversation among team members that happened during the outage or incident will be one of your richest sources of information.
You also should gather data from your monitoring system and other places the people involved in the incident drew context. What information were they getting from your systems when the incident was going on?
And finally, if possible, it would be helpful for you to get a better picture of what changed just prior to and during the incident because changes are often contributing factors when an incident occurs.
We can look at this process as three separate parts:
- Collect the conversation. In other modules in this learning path, we've mentioned that it is important to carve out a specific place for people to communicate during an incident. During the incident, ideally people are sharing what worked and what failed, what they’re hesitant to try, what they’ve tried in the past. This conversation between the people as they work through and solve the issue is your best source of learning.
- Determine the context. The people in an incident are receiving signals from various places. One primary place is your monitoring system. We've discussed the importance of having a solid monitoring system in a previous module in this learning path. Ideally we should be able to look at the monitoring system to build a point-in-time snapshot for the time period around or related to the incident.
- Find the changes. You can do this through activity and audit logs.
Azure tools to help gather the data
Azure offers a number of tools that can assist with this process:
Azure DevOps for holding metadata about the incident
In a previous module in this learning path we discussed using Azure Boards in the Azure DevOps suite as one place to collect all of the information about an incident starting from the initial response. It helps us with questions about when an incident was first declared, who was on call, who was assigned to the incident, and so forth. You can also use the Azure DevOps Wiki as a centralized way to pull in some of the pieces of information about both the incident itself and the conversation that happened during the incident.
Microsoft Graph API for extracting the conversation
Microsoft Graph API provides a programmatic way to find, export and bring in the conversation that was collected inside the Teams channel devoted to this specific incident. The data retrieved will also include metadata that will be useful when constructing a chronology including who joined the channel (and when) and timestamps for individual parts of the conversation.
One easy way to get started with Microsoft Graph API is to use the Microsoft Graph Explorer. Microsoft Graph Explorer is a web-based API browser which allows you to pick the API calls by choosing pre-populated options. Here's what it looks like:
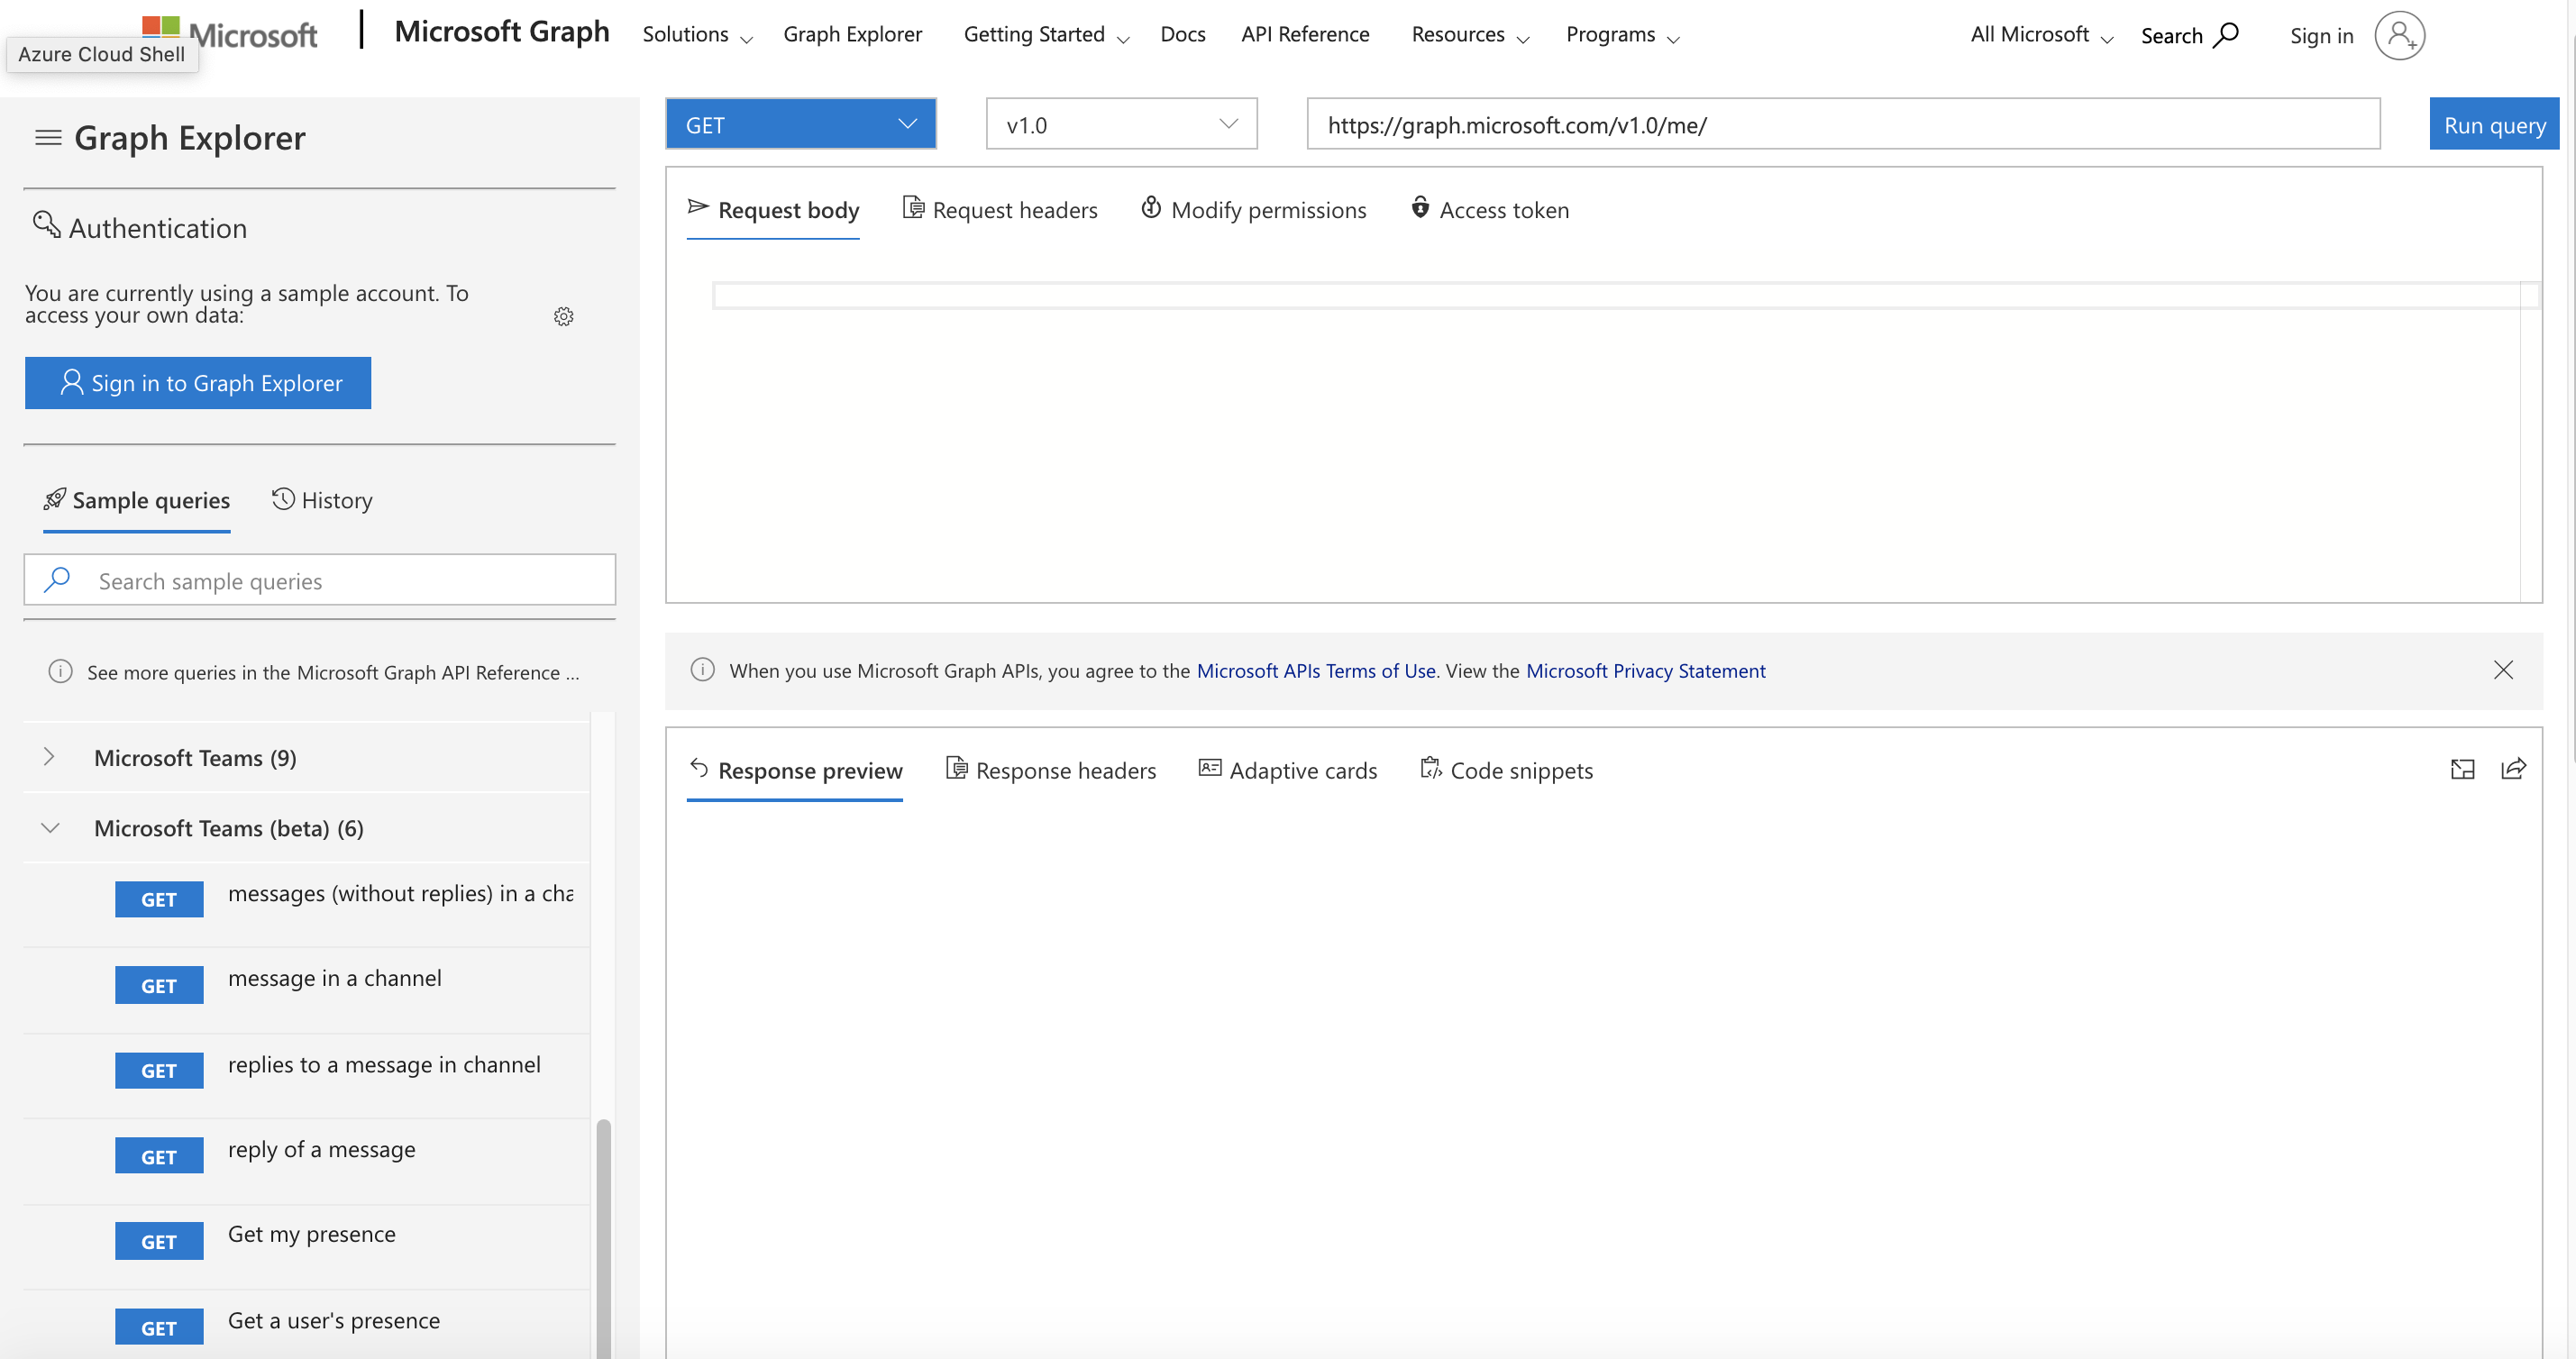
We will step through a set of "Microsoft Teams" and "Microsoft Teams (beta)" API calls to retrieve the conversation. Each step of the way, we will choose a query, run the query, and then select the info from the response that helps us with the next step. We then use this info to construct the next request. For example, first we query a list of team IDs to show the teams we are a part of. We choose the one we need from the response and insert this ID into the next query URL to get a list of channels in that team.
Here are our steps:
- GET "my joined teams" (to find the team ID of the team we use)
- GET "channels of a team which I am member of" (to find the channel ID of the channel we used for that incident)
- GET "messages in a channel" (to retrieve the conversation)
If later we wanted to construct a program to perform each of those steps (and indeed we do) there is a "code snippets" option in the request window that presents sample code for that query in a number of different programming languages.
Targeted dashboards for context display
Dashboards in Azure allow us to collect together on a single page the information from Azure Monitor that matters to us for operational awareness. The user interface allows us to choose the time period being displayed so it is possible to "rewind time" and show the dashboard information for the time period associated with an incident if we so choose (providing the information is not too old to no longer be retained in Azure Monitor). This reconstructed user interface can be helpful when trying to determine what the people in an incident saw during that incident, but it requires the person doing the incident review to manually seek to the right time period.
One feature of dashboards on Azure that often gets overlooked is its ability to dump a template of any dashboard being displayed into a JSON file using the download (down arrow) button and to load them back in with the upload (up arrow) button. This means we could either manually seek to the right time, download the dashboard in that state and share the JSON file with others or simply download the current dashboard and modify the JSON to our specification. If you search for the string "time" in a downloaded JSON dashboard file, you will come upon a section that looks like this:
"metadata": {
  "model": {
    "timeRange": {
      "value": {
        "relative": {
          "duration": 24,
          "timeUnit": 1
        }
      },
      "type": "MsPortalFx.Composition.Configuration.ValueTypes.TimeRange"
    },
    "filterLocale": {
      "value": "en-us"
    },
    "filters": {
      "value": {
        "MsPortalFx_TimeRange": {
          "model": {
            "format": "utc",
            "granularity": "auto",
            "relative": "24h"
          },
          "displayCache": {
            "name": "UTC Time",
            "value": "Past 24 hours"
          },
Modify this section to your specification and reupload. If you are not familiar with the format in use, you can change the dashboard manually, download it, and see the required format.
Audit Logs and Log Analytics for change exploration
A Log Analytics workspace can take in data from many sources including the Azure Activity Log. First, create a new log analytics workspace. Then go to the Activity log feature in the portal and choose "diagnostic settings". This will give the option to send the activity log for an Azure subscription to your new workspace.
In a short amount of time you will be able to use all of the power of the Kusto Query Language (KQL) to retrieve detailed information about changes that have taken place in that subscription since you connected the data source.
For example, this query:
AzureActivity
| where CategoryValue == 'Administrative'
| where OperationNameValue endswith "write" or OperationNameValue endswith "delete"
| project TimeGenerated, Level, ResourceGroup, ResourceId, OperationName, OperationNameValue, ActivityStatus, Caller
| order by TimeGenerated nulls first
shows information about resources that changed or have been deleted. We can set the range of time for the query in the query explorer to more precisely hone in on the time shortly before the incident if we desire.
One quick note: when you set the Azure activity log as a data source, the information starts to flow into the log analytics workspace from that point in time forward. You will not be able to query that workspace for data retroactively for events that took place before you made the connection.
These tools should be able to give you a good start on collecting information necessary for a chronology to use in a post-incident review. Before you dive right into a post-incident review, we'd like to warn you about some common traps. That's the subject of our next unit.