View Application Insights data
After you have set up your application to send telemetry to Application Insights, you can view collected data from the Azure portal. From your Application Insights resource in the portal, you have the following ways to access the data:
Individual visualizations - For example, the users report allows you to visualize summary data for a time period and allows you to drill down into more detail.
Workbooks - Provide insights into the availability, performance, usage, and overall health of the underlying components. Several prebuilt workbooks are available, and you can build your own to include data from multiple Azure data sources.
Logs - Allow you to query the raw event data and look for patterns. Also, you can answer questions directly in Application Insights on the Azure portal or in an external app like Power BI.
You can use Application Insights to collect application performance data for many different types of applications, including Power Apps. For this reason, the portal offers many different visualizations and workbook templates for the different types of applications. Not all visualizations and workbook templates are applicable for Power Apps, and as you explore the different assets, you might find that many of them don't contain data or provide a limited experience.
Visualizations and workbook templates that you will find useful for Power Apps include:
Investigate > Transaction Search
Monitoring > Metrics
Monitoring > Logs
Monitoring > Workbooks > App Performance Index
Monitoring > Workbooks > Active Users
Monitoring > Workbooks > Analysis of page views
Monitoring > Workbooks > Engaged Users
Monitoring > Workbooks > New, returning, and churn
Monitoring > Workbooks > Usage calendar
Monitoring > Workbooks > Usage through the day
Monitoring > Workbooks > User Timeliness
Monitoring > Workbooks > User Retention
Usage > Users
Usage > Sessions
Usage > Events
Usage > User Flows
A good place to start is Usage > Users and then determine who/how many people are using your app. To find your Application Insights resource in the Azure portal, select All Resources and then search for the name that you provided.
Cohorts
Using cohorts will allow you to define sets of users, events, or operations that have something in common. For example, you could define a cohort for all users of a specific screen in your app. Another example would be all users from a country/region. Then, you could use the cohort to filter your Application Insights visualizations.
Custom visualizations
From most of the built-in visualizations, such as Users and Metrics, you can add or modify the filters and other criteria and then save your custom visualization. This approach can be useful if you frequently filter on the same information whenever you visit the data. For example, you can create a new chart on metrics and then customize the time range and granularity.
Alerts
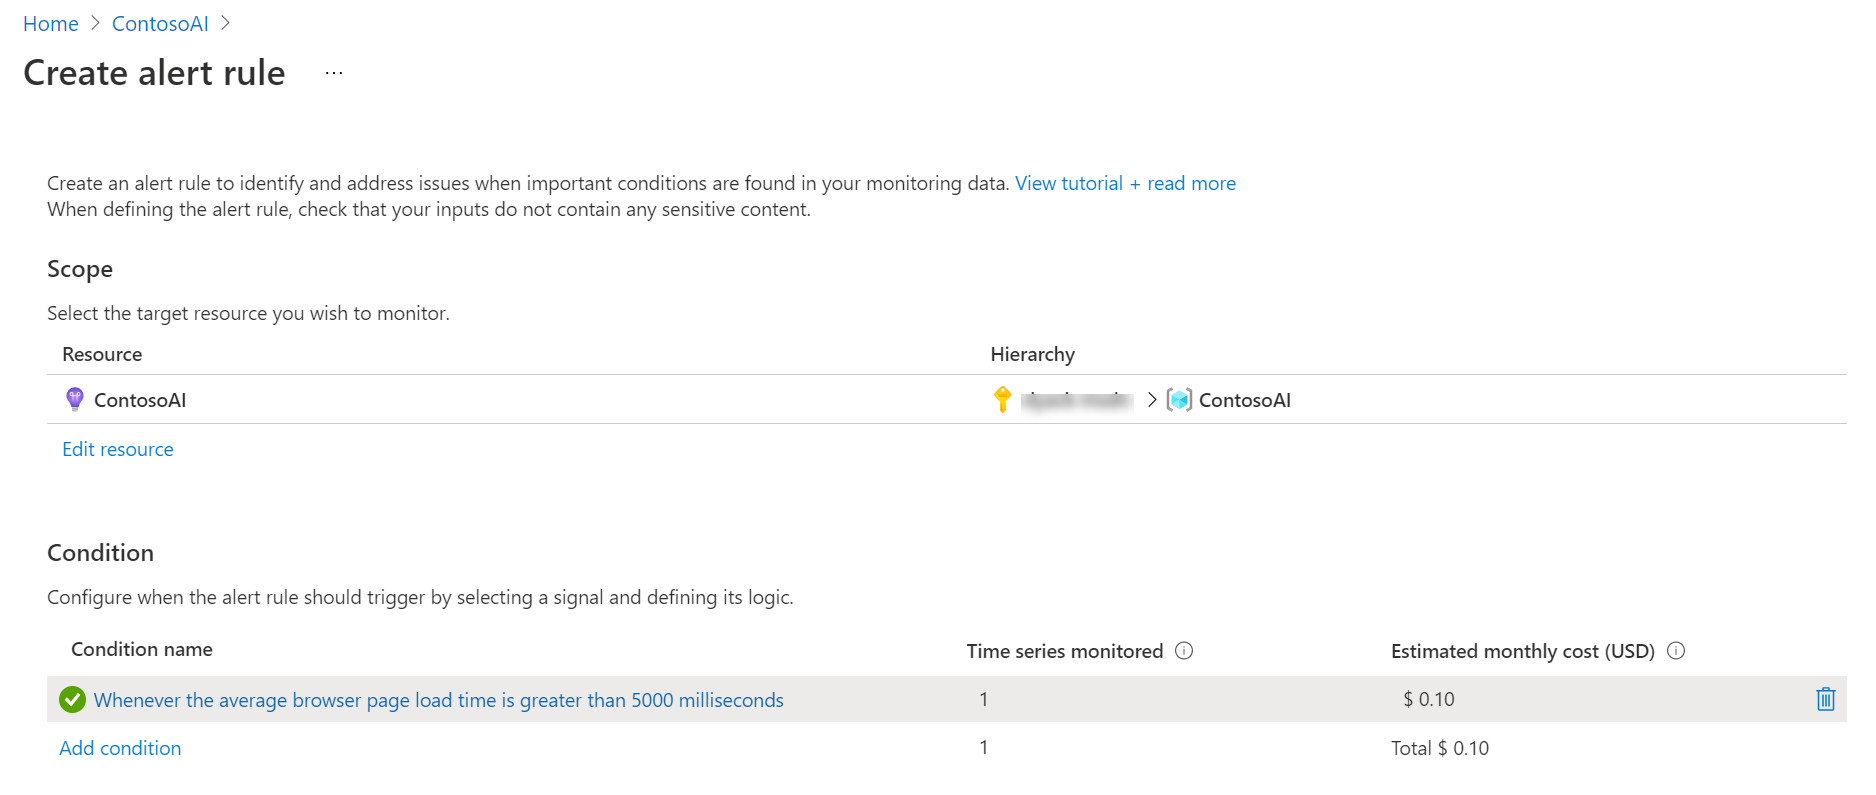
You can use the Alerts feature to help you stay aware of the metrics and send notifications when your apps don't behave as planned. For example, you could set up an alert if average page load time was high.
Power BI
If you want to use Power BI to create custom visualizations, you can import the log data into a Power BI dataset.
Automate reporting by using Power Automate
By using the Azure Monitor connector, you can build automated workflows that use data from your Application Insights workspace. For example, you could have a daily email that includes a list of errors that are logged by users of your app.
