Monitor Azure Stack HCI by using Azure Monitor
As Contoso transitions to a new operational model that uses the capabilities of Azure Stack HCI, you want to determine how to enhance these capabilities by using Azure hybrid services. To provide more visibility into performance and availability of your on-premises workloads, you decide to use Azure Monitor.
Before you use Azure Monitor, you want to learn about the features of Azure Monitor and how you can use it to monitor and maintain an Azure Stack HCI deployment.
Overview of Azure Monitor
Azure Monitor is a comprehensive, cloud-based, hybrid monitoring service that you can use to monitor and maintain a wide range of Azure services and Windows, Azure Stack HCI, and Linux servers residing in any location with direct or indirect connectivity to Azure. Azure Monitor features include:
- Collection, storage, visualization, and analytics of metrics. Metrics are numerical values that represent the performance and health status of monitored workloads.
- Collection, storage, visualization, and analytics of logs. Logs can contain activity, diagnostics, and telemetry data.
- Alerting and remediation. Alerts notify you of important events affecting monitored workloads. Remediation automates corrective actions that bring monitored workloads to their intended state. For example, an alert can trigger an email notification or an incident in your Information Technology Service Management (ITSM) system. An alert can also trigger a remediation action implemented by such methods as an Azure logic app, Microsoft Azure Functions, Azure Automation runbook, or a custom web service that you manage.
Azure Monitor allows you to archive collected data for long-term storage in Microsoft Azure Storage, route it to Azure Stream Analytics, or deliver it to other Microsoft or third-party services via Event Hub.
Azure Monitor components
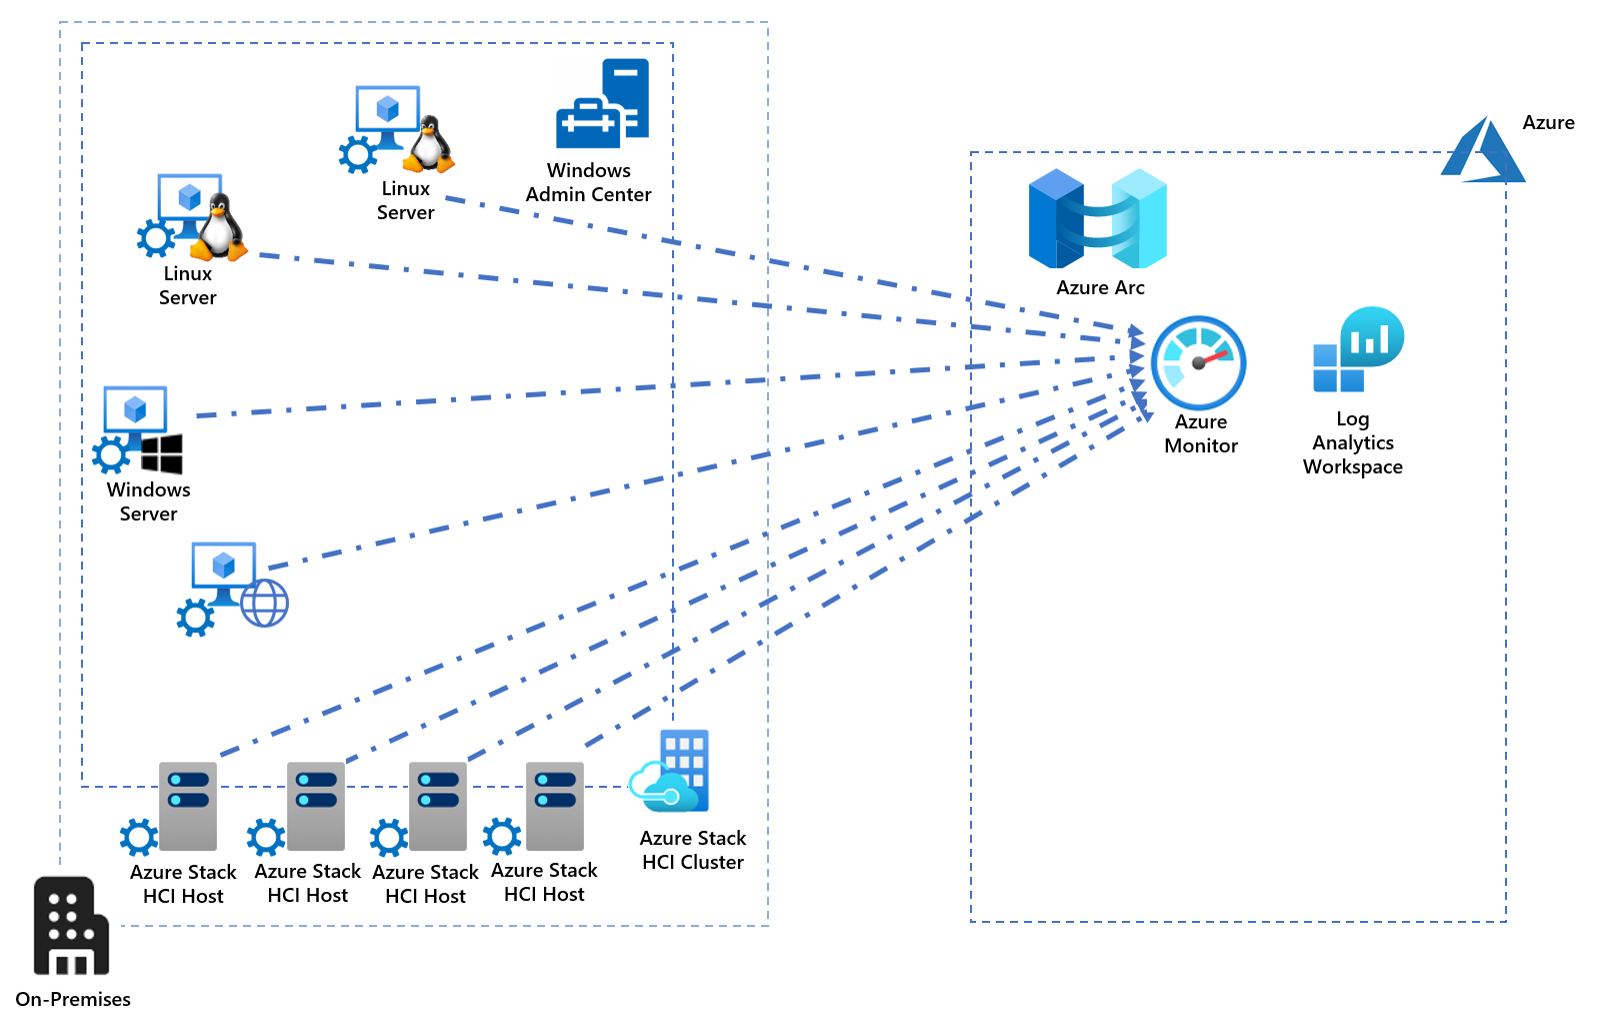
Azure Monitor uses agents installed on monitored servers to collect and upload metrics and logs to an Azure-based storage and analytics service referred to as Log Analytics workspace. A workspace allows you to define the scope of data collection and analysis and control data access.
At Contoso, you want to customize the scope of data to collect and analyze. You can do this by adding monitoring solutions to a workspace. Monitoring solutions determine data collection, processing, and analytics rules. They also include pre-defined queries, dashboards, and workbooks.
You can perform data analysis by using the Kusto query language (KQL) directly from the Log Analytics workplace blade in the Azure portal. KQL allows you to manipulate data by applying various operations, including filtering, aggregation, and sorting. You can use solution-specific or custom dashboards to display query results. You also have the option to configure query-based alerts.
Azure Monitor support for Azure Stack HCI
Azure Stack HCI offers the built-in monitoring functionality, readily available from the graphical interface of Windows Admin Center and accessible via PowerShell scripts. This provides you with a straightforward and convenient method to assess performance and health status of Azure Stack HCI cluster nodes, volumes, disks, and VMs. You can also track Health Service reports, faults, and actions, which focus on Storage Spaces Direct-specific events. In addition, Azure Stack HCI automatically integrates with Microsoft Azure Arc, which allows you to use the Azure portal as a centralized inventory of all your Azure Stack HCI clusters, along with all your Azure and Azure Arc enabled resources.
For Contoso, you're looking at more in-depth monitoring, analytics, alerting, and automatic remediation and want to centralize monitoring and maintenance across multiple Azure Stack HCI deployments. To provide these capabilities, you should consider integrating Azure Stack HCI with Azure Monitor, which relies on the following components:
- Microsoft Monitoring Agent and Microsoft Dependency agents installed on each cluster node
- InfrastructureInsights and ServiceMap solutions added to the Log Analytics workspace
Note
Microsoft Monitoring Agent is also referred to as the Log Analytics agent.
The resulting functionality is referred to as Azure Monitor for VMs and, in addition to the aforementioned Azure Monitor features, includes:
- Pre-defined trending performance charts, which illustrate core performance operating system metrics, with consolidated views across multiple servers connected to the same workspace. This helps with forecasting and capacity planning.
- Service map, which illustrates dependencies between distributed services in the monitored environment, including services external to servers running the Azure Monitor agents. This is valuable for initiatives such as server migrations, datacenter consolidations, or disaster recovery planning.

Note
Despite its name, Azure Monitor for VMs supports virtual and physical servers.
Azure Monitor supports a range of other solutions that provide additional functionality, beyond what is implemented by default during the Windows Admin Center-based onboarding. For example; Update Management, Inventory, and Change tracking use the capabilities of Azure Automation to automate patching of the Windows Server operating system and facilitate asset management. Azure Security Center facilitates monitoring for security vulnerabilities and cyber threats.
Cloud-based monitoring might eliminate the need for an on-premises monitoring system. If you have existing Azure resources, cloud-based monitoring will provide a uniform monitoring solution that uses cloud hyperscale and seamlessly integrates with other Azure services.
Onboarding Azure Stack HCI to Azure Monitor
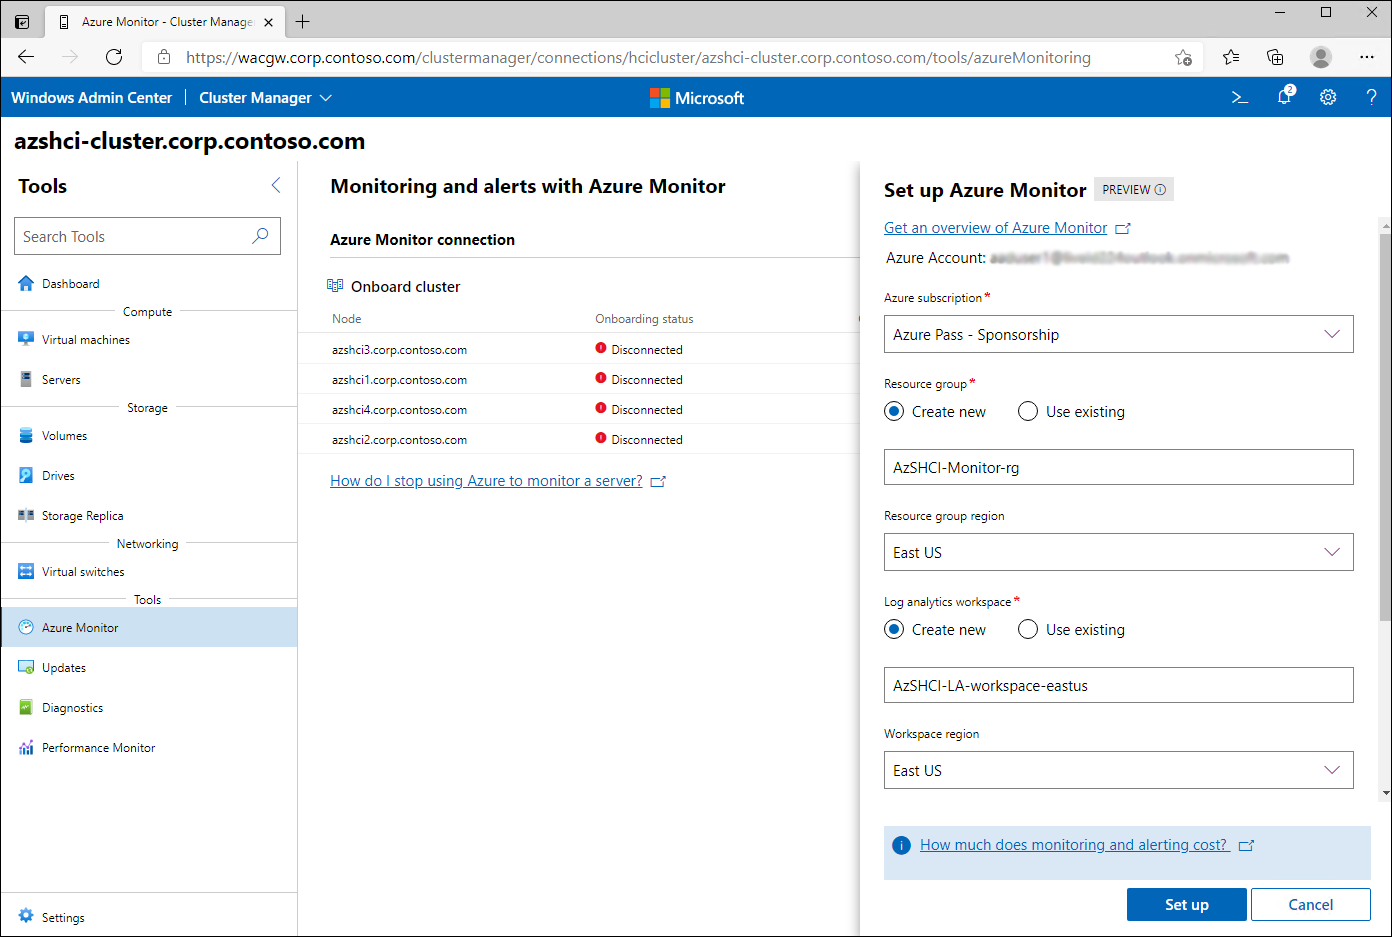
Now that you have learned about the features of Azure Monitor, let's look at how you can onboard an Azure Stack HCI cluster that is deployed at Contoso to Azure Monitor by using Windows Admin Center. Windows Admin Center offers the option to automatically provision all required Azure components, including resource groups and a Log Analytics workspace, install the agents on cluster nodes, and, optionally, onboard the nodes to Azure Arc.
Note
As with any functionality that involves Azure-based services, you first need to register Windows Admin Center in Azure.
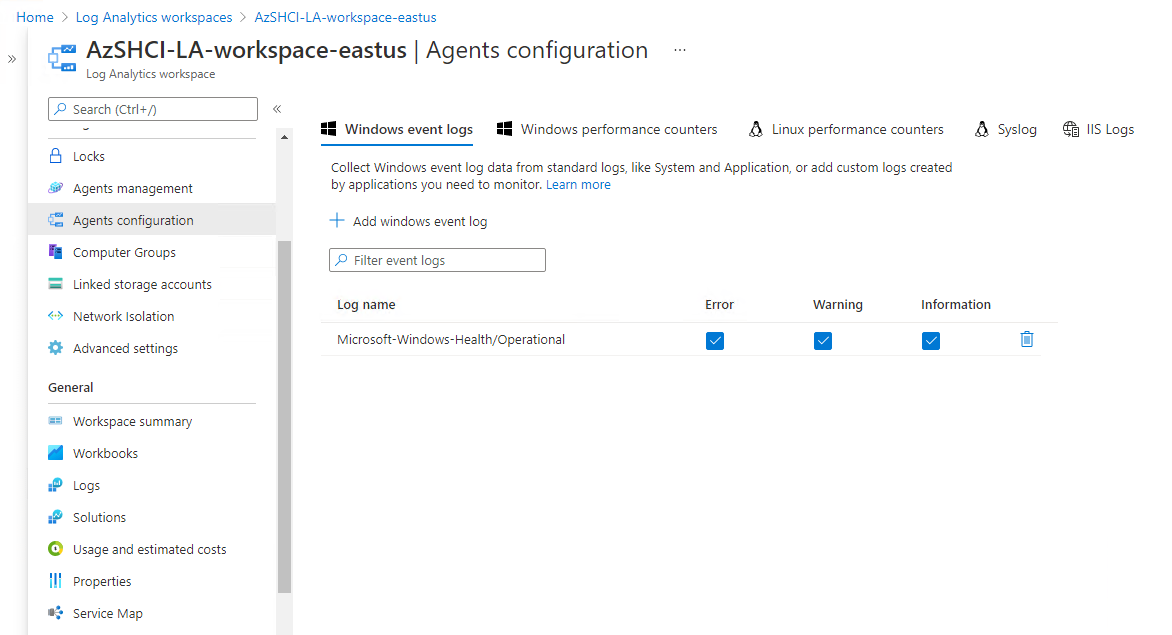
In addition, Windows Admin Center configures Windows Server 2019 Health Service to deliver its telemetry into the target workspace.
You can also use Windows Admin Center to onboard individual Windows servers, including those running as VMs on Azure Stack HCI, to Azure Monitor. Alternatively, for larger scale deployments, you can fully automate installation of Azure Monitor agents by using Azure Arc.
Demonstration: Onboard Azure Stack HCI cluster to Azure Monitor
In this demonstration, you'll learn how to onboard an Azure Stack HCI cluster to Azure Monitor.