Discover DevOps
DevOps is the union of people, process, and products to enable continuous delivery of value to our end users.
Typically, the goal for Development is to deliver more features faster, and the goal of Operations is to achieve better system stability. DevOps aligns these disciplines by using a framework of best practices proven to increase speed to market while improving system stability.
For Microsoft, DevOps encompasses the entire software delivery lifecycle, from idea to applications running in production.

One holistic DevOps view for Microsoft Services
After considerable debate, collaboration, and refinement, we agreed on the following DevOps view for Microsoft Services:
- First, we identified four pillars that support DevOps, derived from People/Process/Product: Culture, Lean Product, Architecture, and Technology.
- Then we identified eight functions, or capabilities, which include various practices within each function or across functions:
- Continuous Planning
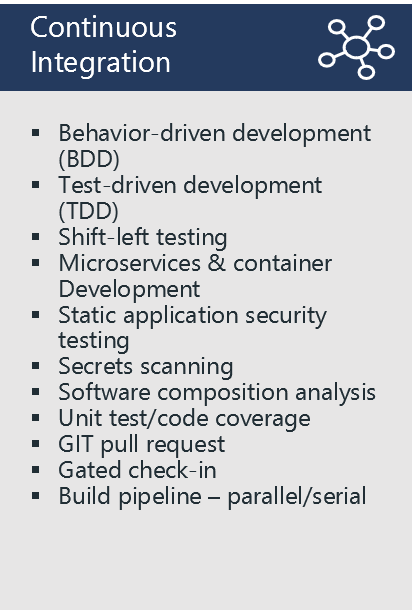
- Continuous Integration
- Continuous Delivery
- Continuous Operations
- Continuous Quality
- Continuous Security
- Continuous Collaboration
- Continuous Improvement
What is new? Continuous Everything. The process is a journey and requires a growth mindset to continually evolve and improve.
Note
Please note that each capability lists example practices; it is not an exhaustive list.
DevOps capabilities and practices
Here’s our DevOps taxonomy of capabilities and practices that go into a world-class DevOps practice.


Note
Please note that each capability lists example practices; it is not an exhaustive list.
DevOps benefits
The 2019 State of DevOps Report is based on research that provides the most comprehensive view of the growing DevOps industry.
According to this report, elite performers:
- Deploy code 208 times more frequently than low performers
- Have 106 times faster change lead time from commit to deploy than low performers
- Change failure rates that are seven times better than low performers
- Restore service 2,604 times faster than low performers
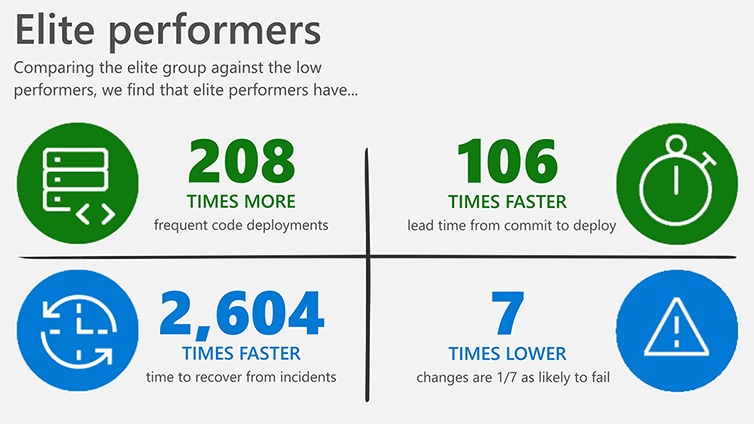
These results show that by focusing on DevOps values, teams aren't trading speed to market for stability. They can achieve both at the same time.