What is Azure Digital Twins?
Across the many industries where the Internet of Things (IoT) is featured today, IoT environments are often large in scale, providing device data from sensors throughout buildings, factories, farms, railways, stadiums, energy networks, and even entire cities. Such environments generate a large amount of IoT device data that needs to be organized before it can be consumed and processed into logical insights.
Azure Digital Twins is a platform as a service (PaaS) offering that enables the creation of digital twin graphs that parallel entire real-world environments. Through these digital models you can organize data ingested from IoT devices; contextualize data with business logic or information from connected business systems; and query the data to create dashboards or other digital solutions that enable meaningful insights about your environment, both right now and as patterns over time. These insights can help drive better products, optimized operations, reduced costs, and breakthrough customer experiences.
In this unit, you learn about the components of Azure Digital Twins. In the following units, you'll practice using them.
Model your business environment
In Azure Digital Twins, you freely define the types of digital entities that represent your environment, including the people, places, and things that it contains.
Using the vocabulary that fits your business, you define your own twin types in terms of their properties, telemetry, components, and relationships. These custom twin types are called models, and they're written in a JSON-based language called Digital Twin Definition Language (DTDL). You can design your own model sets from scratch, or get started with a pre-existing set of industry ontologies based on common vocabulary for your industry. You can also bring models from outside of Azure Digital Twins and convert them so they're usable in Azure Digital Twins. In the factory scenario for this module, you'll design a model to represent the concept of a robotic arm. That model will have a boolean property indicating whether that arm has an active alert that the latest package was not picked up.
After creating models to define the types of entity in your environment, you create instances of each model to represent the actual, specific environment entities. These instances are called digital twins (or just twins for simplicity). In this module's scenario, you'll use the robotic arm model to create multiple robotic arm twins. Each twin will be based on the model, so each twin will have that boolean property representing the pickup failure alert.
Tip
From a programming perspective, models are like class definitions, and twins are like instances of those classes.
Finally, digital twins are connected to each other through relationships to form a conceptual graph of your complete environment. You'll create a twin to represent the entire distribution center, and use relationships to indicate that the center contains each of the robotic arm twins that you've created. Using relationships like this can help you to aggregate data from twins that are conceptually connected to each other, enabling insights like the average hourly efficiency across all robotic arms in the factory.
Sync and contextualize IoT and business system data
Digital twin graphs in Azure Digital Twins are live, up-to-date representations of the real world.
To keep digital twin properties current against your environment, connect your Azure Digital Twins solution to IoT Hub, which manages physical IoT devices. When physical devices send data to IoT Hub in the cloud, that data can be routed into Azure Digital Twins.
You can also ingest data from other data sources, using REST APIs or connectors to other Azure services, like Logic Apps. These methods can help you input data from business systems and incorporate them into your twin graph.
Once data reaches Azure Digital Twins, you can connect external compute resources, like Azure functions, that define exactly how your digital twins are updated in response. In this way, you can flexibly customize data processing to reflect your business logic.
Query for environment insights
Azure Digital Twins provides a query API for extracting insights from the live execution environment. The API can query the twin graph with extensive search conditions, including twin property values, relationships, relationship properties, model information, and more. You can also combine queries to gather a broad range of insights about your environment. The data produced by the query API can be used to create dashboards, generate warnings or alerts, and more.
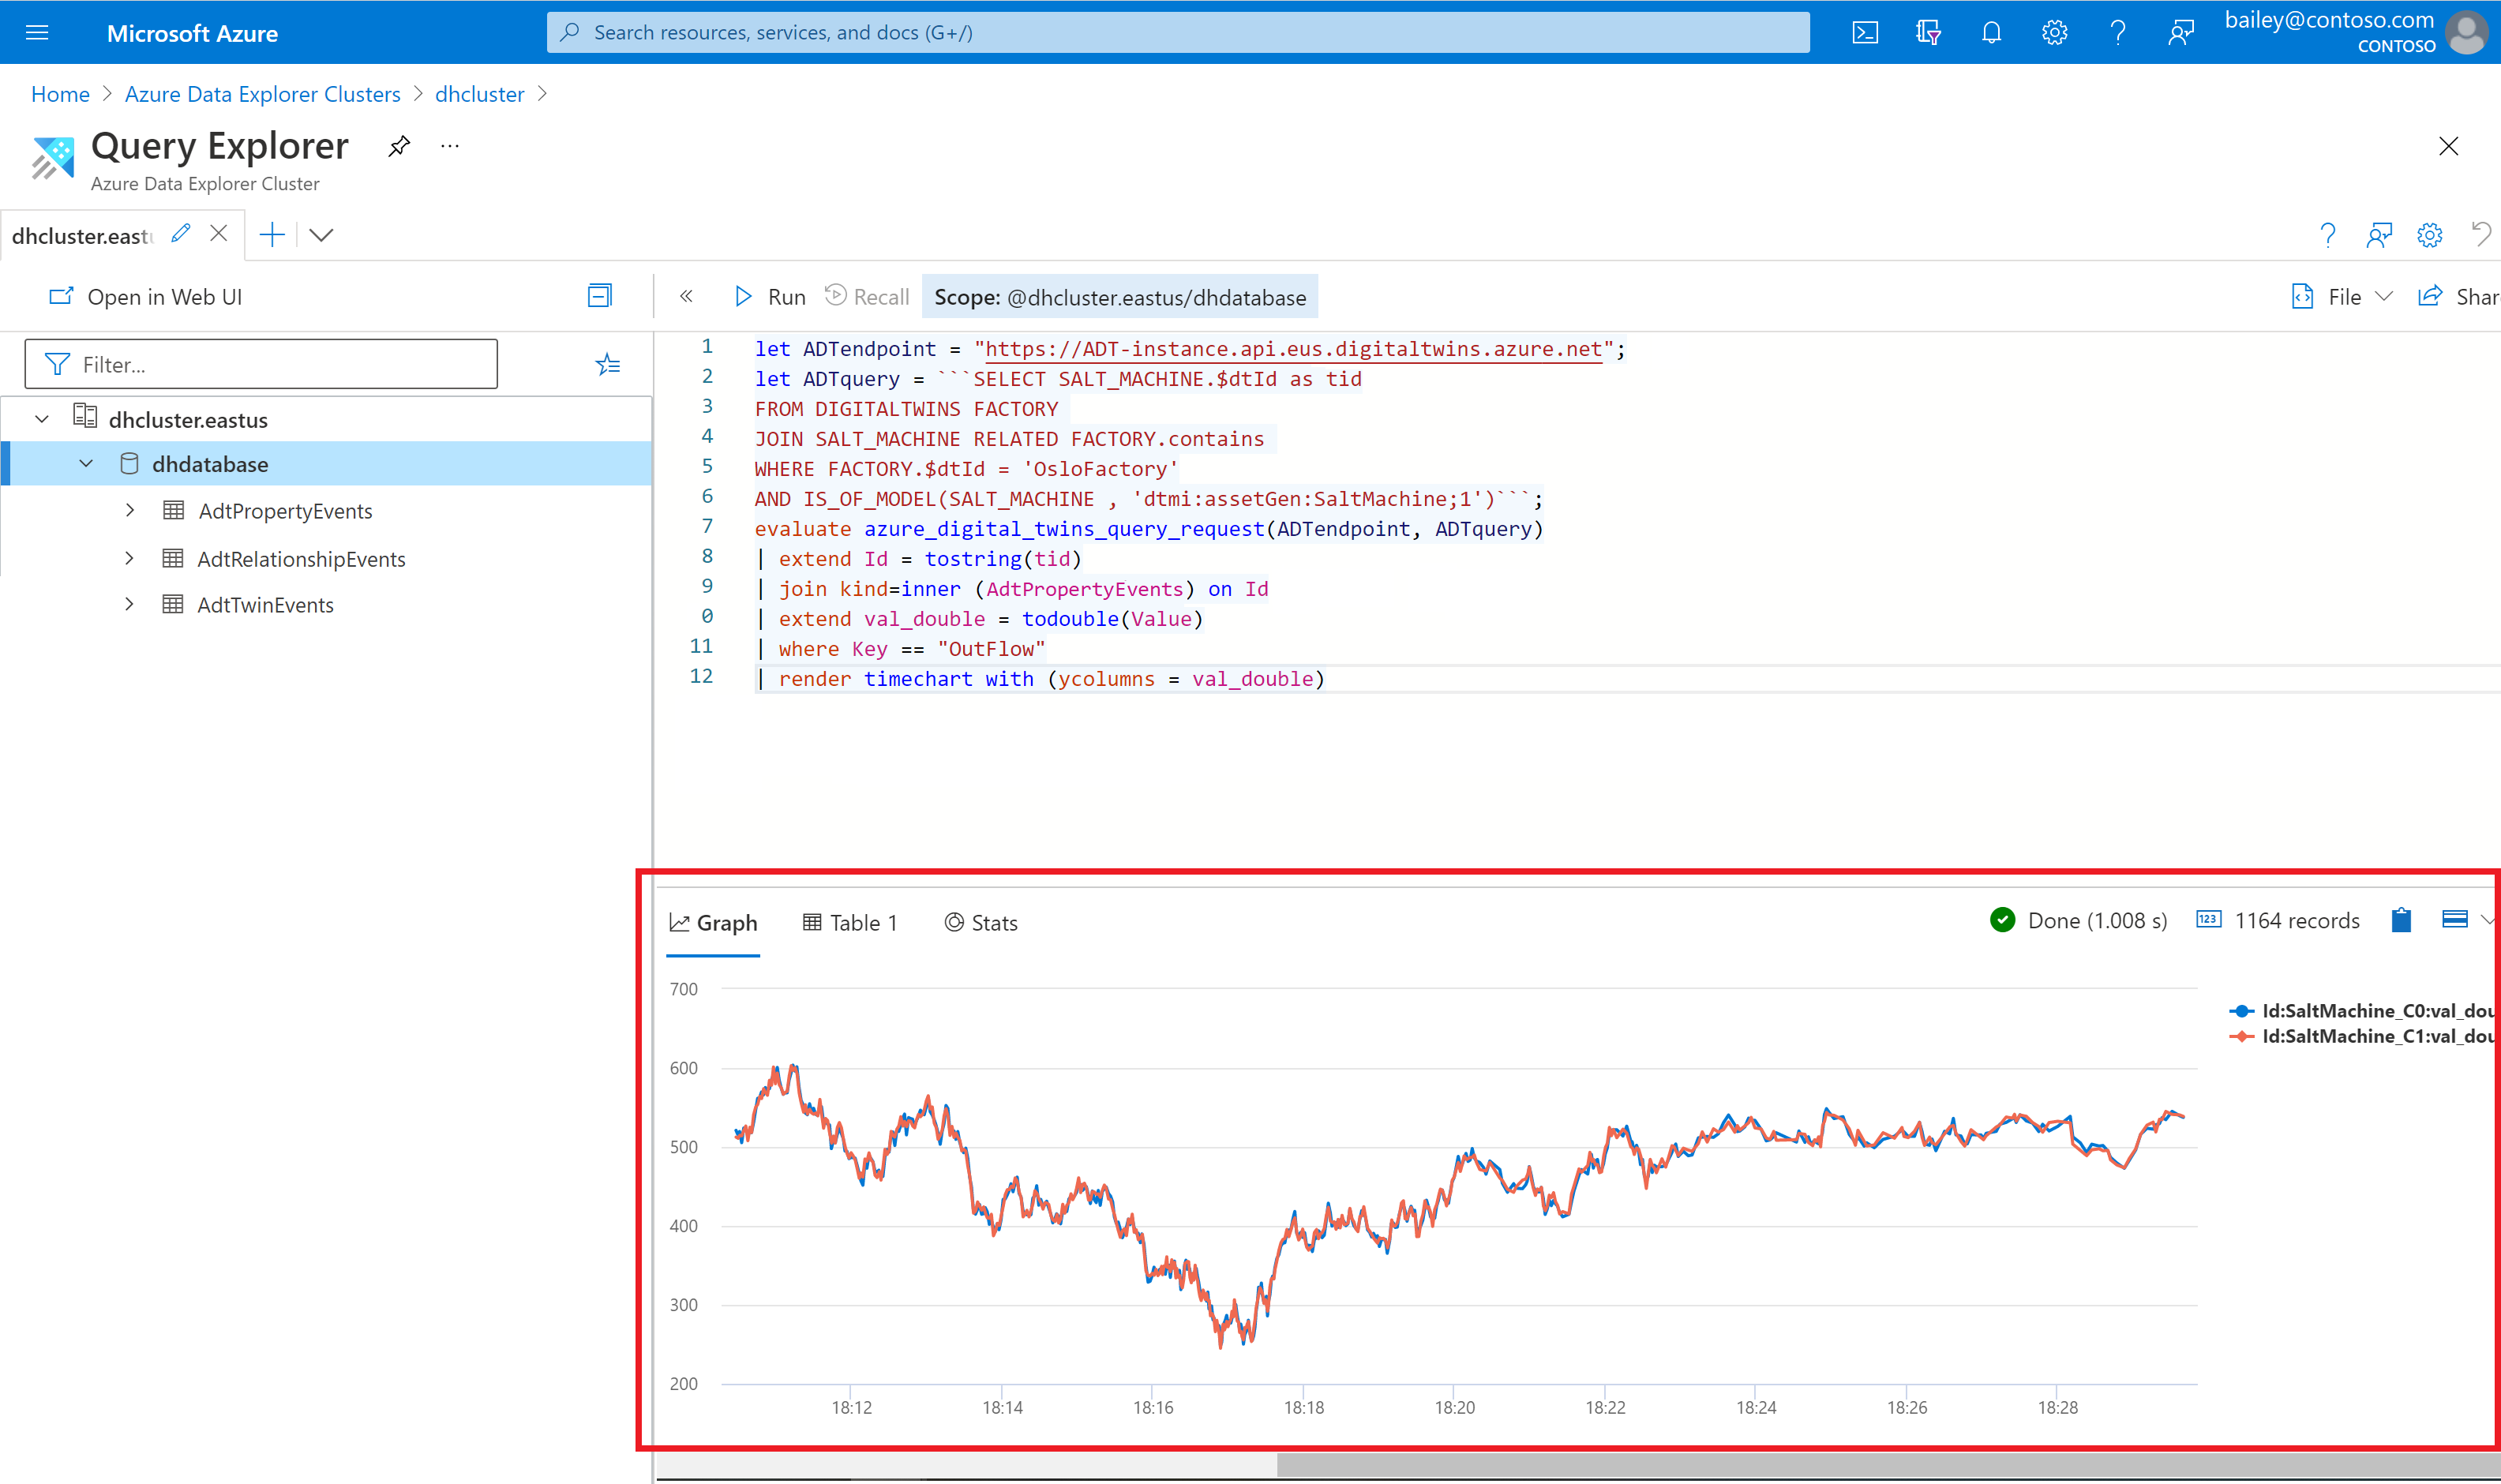
You can also query historized twin data collected over time, using the data history feature. This feature connects an Azure Digital Twins instance to an Azure Data Explorer cluster, so that graph updates are automatically stored in Azure Data Explorer. From there, the data can be queried using the Azure Digital Twins query plugin for Azure Data Explorer. This provides a wider pool of environment data, and the ability to identify patterns over time.
Here's an example of historized twin updates shown in Azure Data Explorer, illustrating the changing values of outflow from a salt machine in a dairy factory over time.
Visualize
Azure Digital Twins provides the ability to visualize your environment in two or three dimensions.
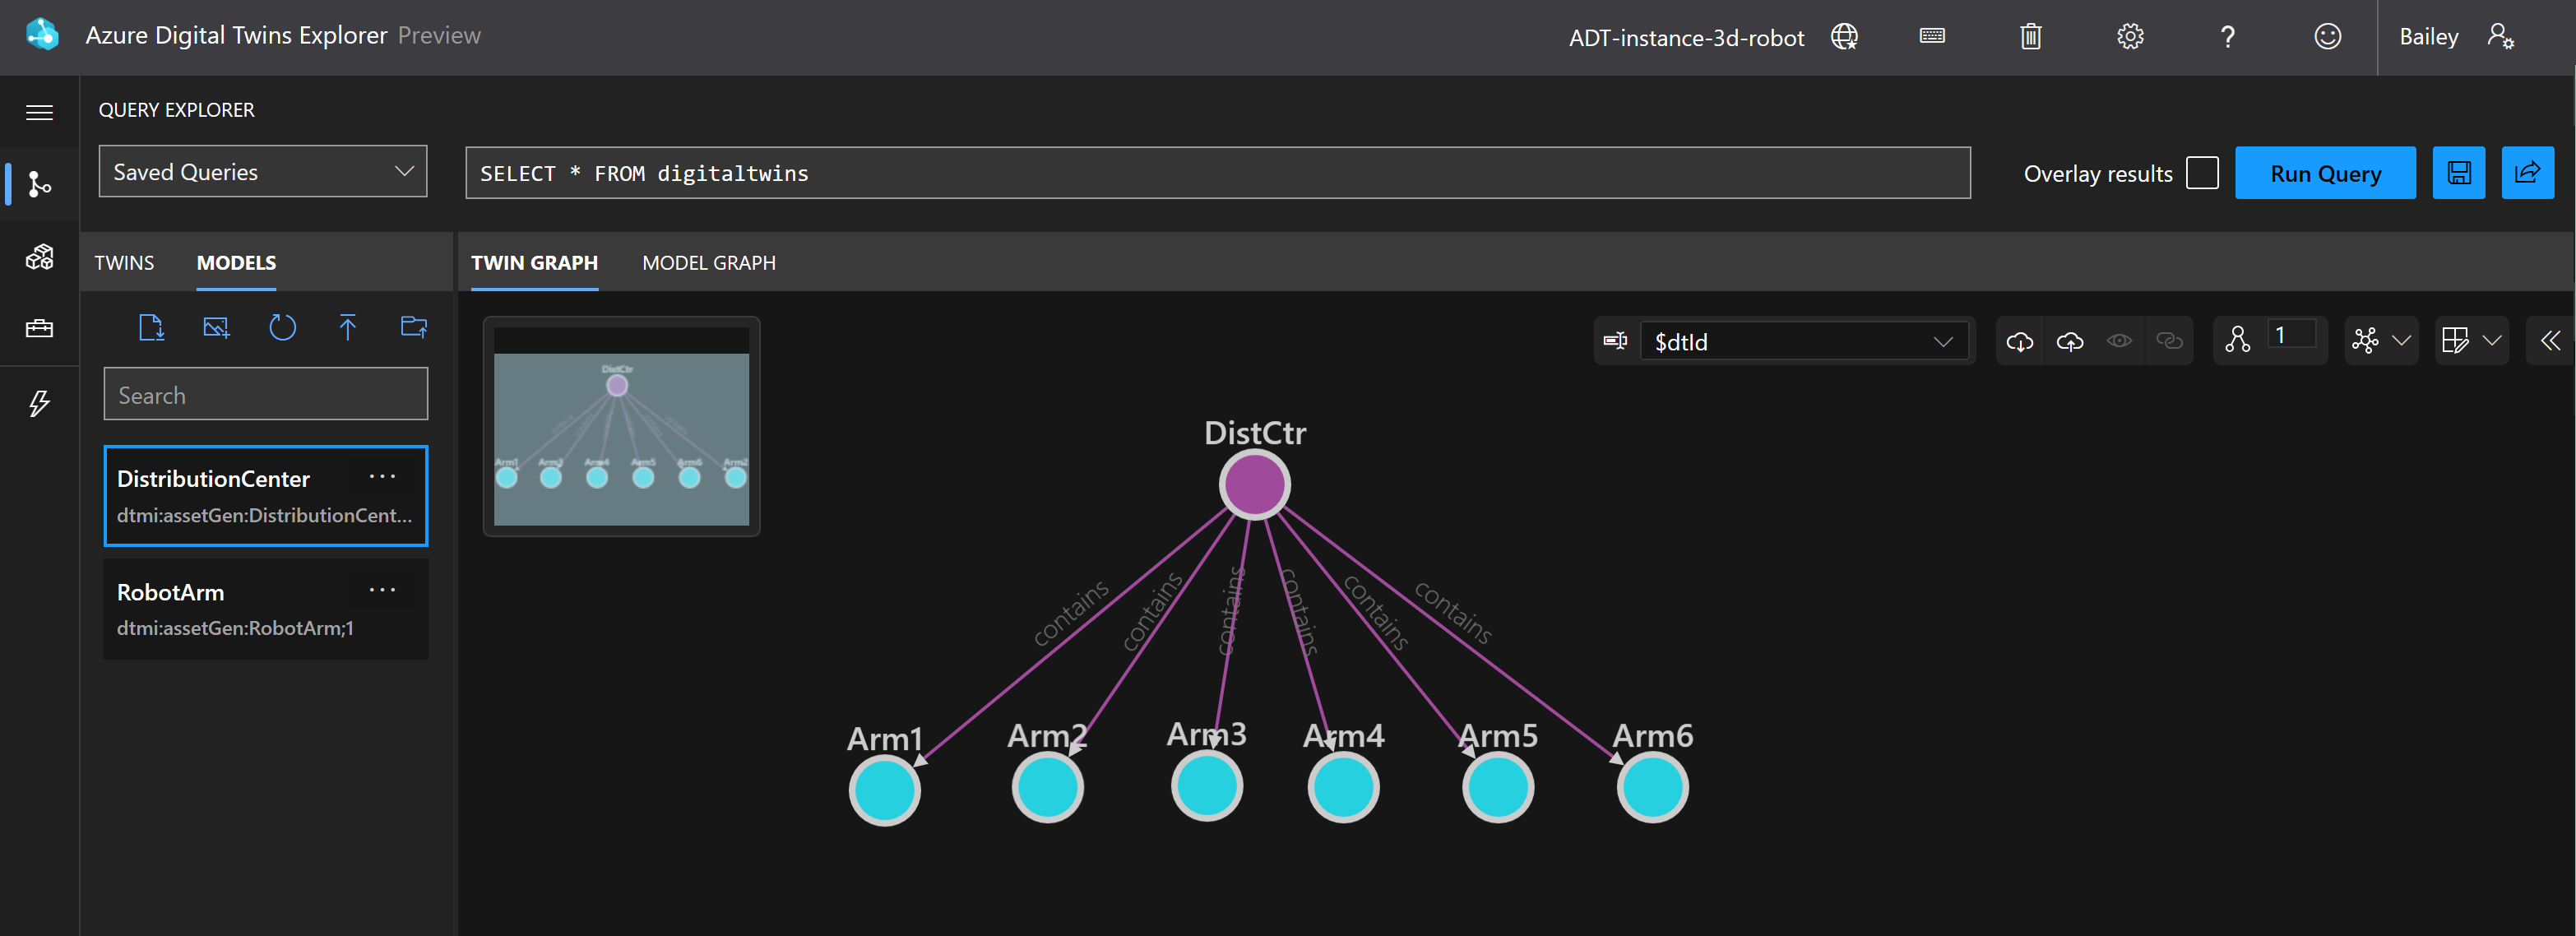
Azure Digital Twins Explorer is a 2D interface that can help you build and interact with your graph. Here's an example of the graph for the module scenario shown in Azure Digital Twins Explorer. It shows a twin for the entire distribution center, connected with contains relationships to six robotic arm twins.
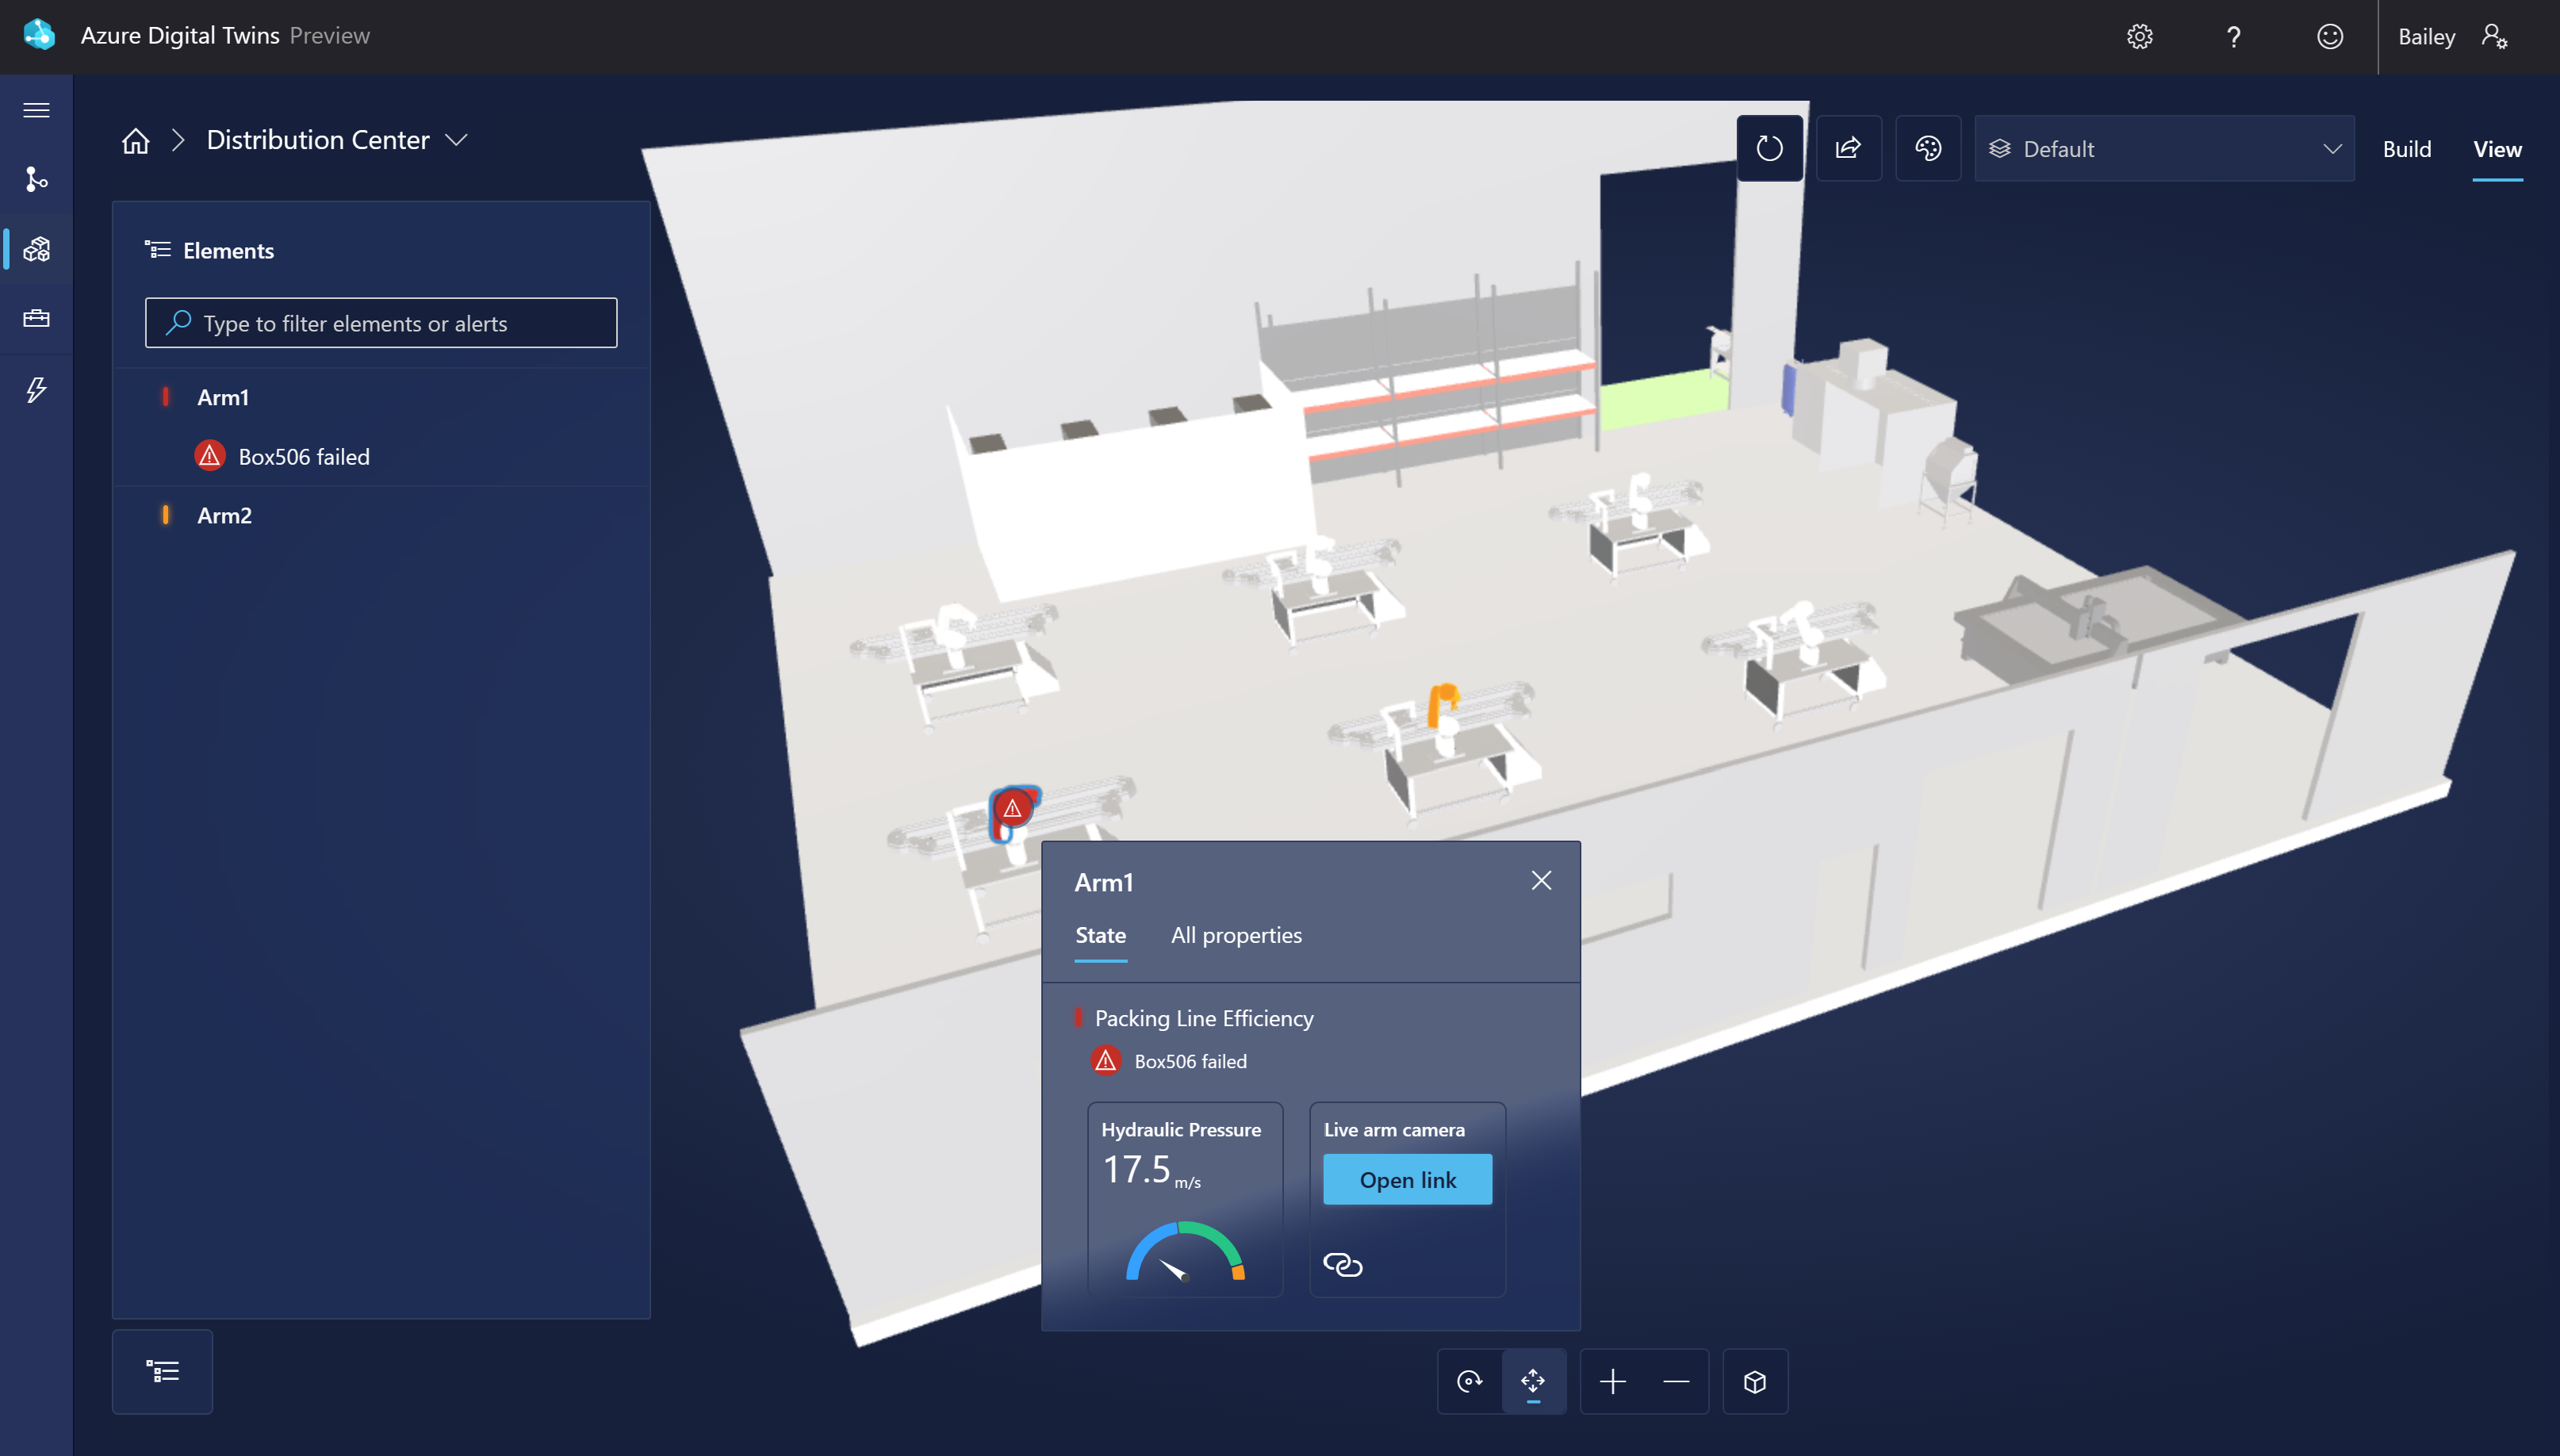
Azure Digital Twins 3D Scenes Studio (preview) is an immersive visual 3D environment, where end users can monitor, diagnose, and investigate operational digital twin data with the visual context of 3D assets. Starting with a digital twin graph and curated 3D model, you can map the 3D elements to digital twins in the Azure Digital Twins graph using the studio's low-code builder. Then, you can define UI interactivity and business logic to complete the 3D visualization of a business environment. 3D scenes can be consumed in the hosted 3D Scenes Studio, or in custom applications using the embeddable 3D viewer component. Here's an example of the module scenario shown as a scene in 3D Scenes Studio. The 3D model shows a room in a distribution center containing six robotic arms, which are capable of displaying alerts and property details.
Export twin data
The data in your Azure Digital Twins instance can be routed to downstream Azure services or external destinations, for custom storage and processing.
The built-in data history feature can be used to automatically historize twin data to Azure Data Explorer, where it can be queried as historical data over time.
Digital twin data can be sent to other Azure services or ultimately outside of Azure through event routes, which utilize Azure Event Hubs, Event Grid, and Service Bus to send data through custom flows.
Here are some examples of downstream destinations and goals that you can accomplish with event routes in Azure Digital Twins:
- Store Azure Digital Twins data in Azure Data Lake
- Analyze Azure Digital Twins data with Azure Synapse Analytics, or other Microsoft data analytics tools
- Integrate larger workflows with Logic Apps
- Send data to custom applications for customized responsive actions
Flexible egress of data is another way that Azure Digital Twins can connect into a larger solution, and support your custom needs for working with environment insights.


