Create dynamic reports with parameters
Dynamic reports are reports in which the data can be changed by a developer according to user specifications. Dynamic reports are valuable because a single report can be used for multiple purposes. If you use dynamic reports, you'll have fewer individual reports to create, which will save organizational time and resources.
You can use parameters by determining the values that you want to see data for in the report, and the report updates accordingly by filtering the data for you.
Creating dynamic reports allows you to give users more power over the data that is displayed in your reports; they can change the data source and filter the data by themselves.
In the following example, you've created a report for the Sales team at Tailwind Traders that displays the sales data in the SQL Server database. The report gives a holistic view of how the Sales team is performing. While the report is useful, the Sales team members want to be able to filter the report so that they can view their own data only and track their performance against their sales targets.
Create dynamic reports for individual values
To create a dynamic report, you first need to write your SQL query. Then use the Get data feature in Power BI Desktop to connect to the database.
In this example, you connect to your database on SQL Server by following these steps:
After you have entered your server details, in the SQL Server database window, select Advanced options.
Paste the SQL query into the SQL statement box and then select OK.

When the connection is made, the data is shown in the preview window.
Select Edit to open the data in Power Query Editor.


Next, you create the parameter by following these steps:
On the Home tab, select Manage parameters > New parameter.
On the Parameters window, change the default parameter name to something more descriptive so that its purpose is clear. In this case, you change the name to SalesPerson.
Select Text from the Type list and then select Any value from the Suggested value list.
Select OK.

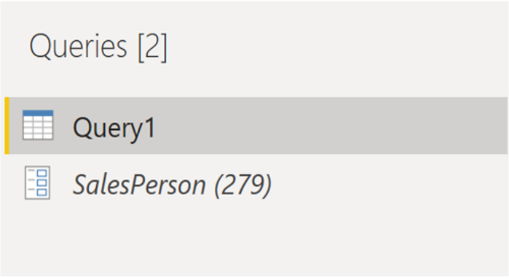
A new query is shown for the parameter that you created.


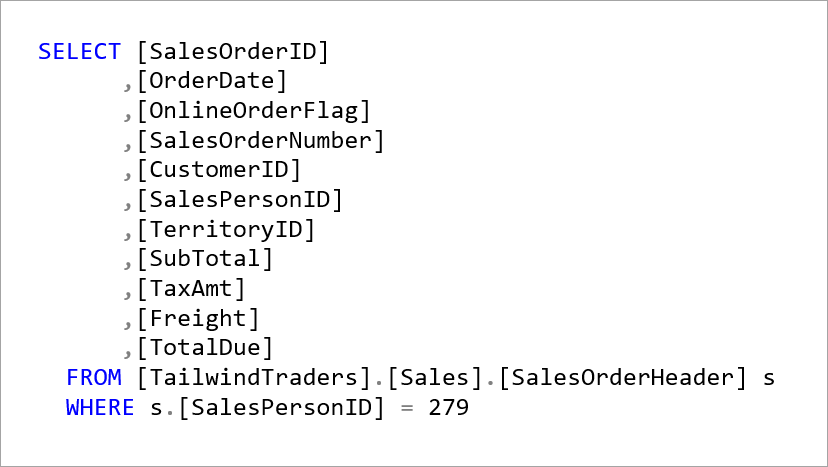
Now, you need to adjust the code in SQL query to assess your new parameter:
Right-click Query1 and then select Advanced editor.
Replace the existing value in the execute statement with an ampersand (&) followed by your parameter name (SalesPerson), as illustrated in the following image.

Make sure that no errors are shown at bottom of the window and then select Done.

Though you don't see a difference on the screen, Power BI ran the query.
To confirm that the query was run, you can run a test by selecting the parameter query and entering a new value in the Current Value box.

A warning icon might display next to the query. If so, select that query to view the warning message, which states that permission is required to run this native database query. Select Edit Permission and then select Run.
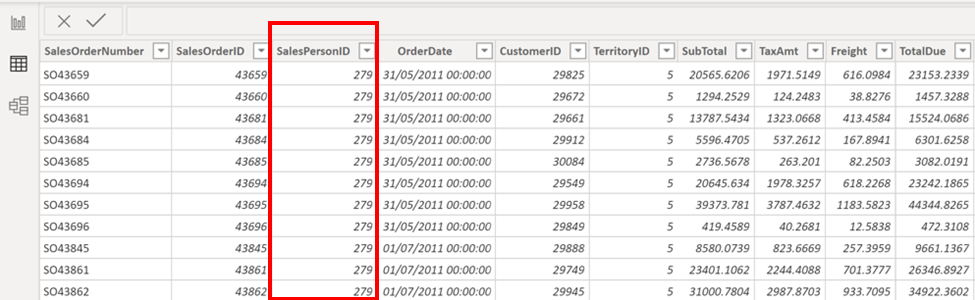
When the query runs successfully, the parameter displays the new value.

Select Close and Apply to return to the report editor.


Now, you can apply the parameter to the report:
Select Edit queries > Edit parameters.
On the Edit Parameters window, enter a new value and then select OK.
Select Apply changes and then run the native query again.
Now, when you view the data, you see the data for the new value that was passed through the parameter.

You can now create a report that displays data for one particular value at a time. More steps are needed to display data for multiple values at the same time.
Create dynamic reports for multiple values
To accommodate multiple values at a time, you first need to create a Microsoft Excel worksheet that has a table consisting of one column that contains the list of values.
Next, use the Get data feature in Power BI Desktop to connect to the data in that Excel worksheet, and then follow these steps:
On the Navigator window, select Edit to open the data in Power Query Editor, where you see a new query for the data table.
Rename the column in the table to something more descriptive.
Change the column data type to Text so that it matches the parameter type and you avoid data conversion problems.
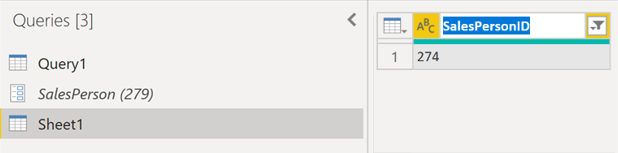
In the query Properties section, change the name of the data source to something more descriptive. For this example, enter SalesPersonID.

Next, you need to create a function that passes the new SalesPersonID query into Query1:
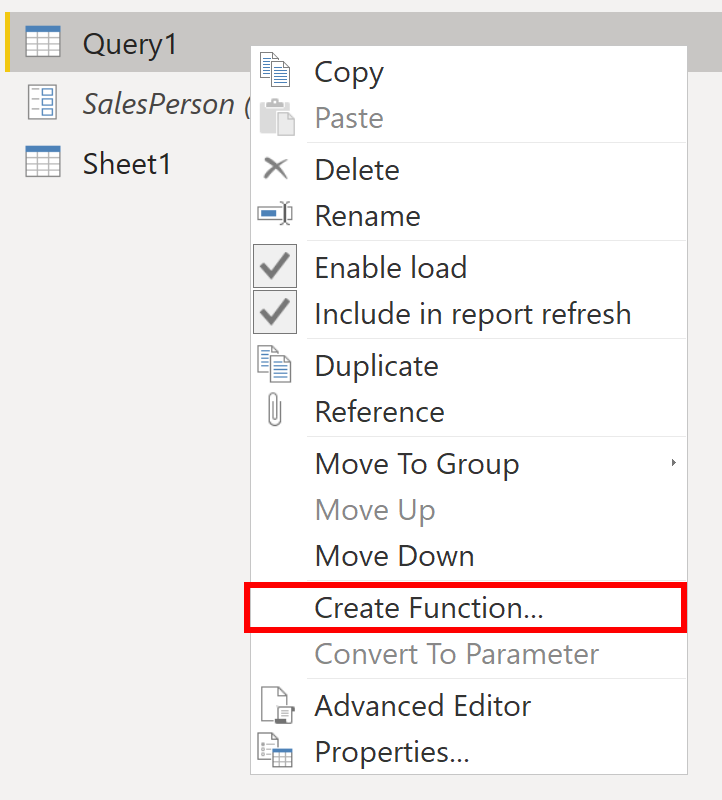
Right-click Query1 and then select Create function.
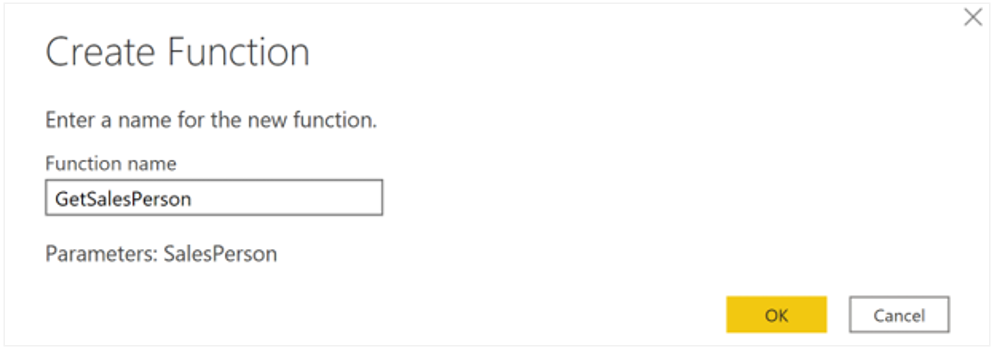
Enter a name for the function and then select OK.
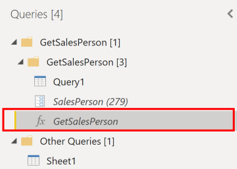
Your new function appears in the Queries pane.
To ensure that Query1 doesn't show up in the field list for the report, which could potentially confuse users, you can disable it from loading in the report by right-clicking Query1 again and then selecting Enable load (selected by default) to disable the feature.

Select the SalesPersonID query that you loaded from the Excel worksheet and then, on the Add Column tab, select Invoke custom function to run the custom function that you created.

On the Invoke Custom Function window, select your function from the Function query list.


The New column name updates automatically and the table that contains the values that you're going to pass through the parameter is selected by default.
Select OK and, if necessary, run the native query.

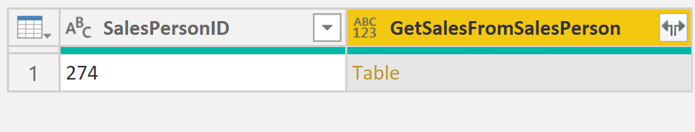
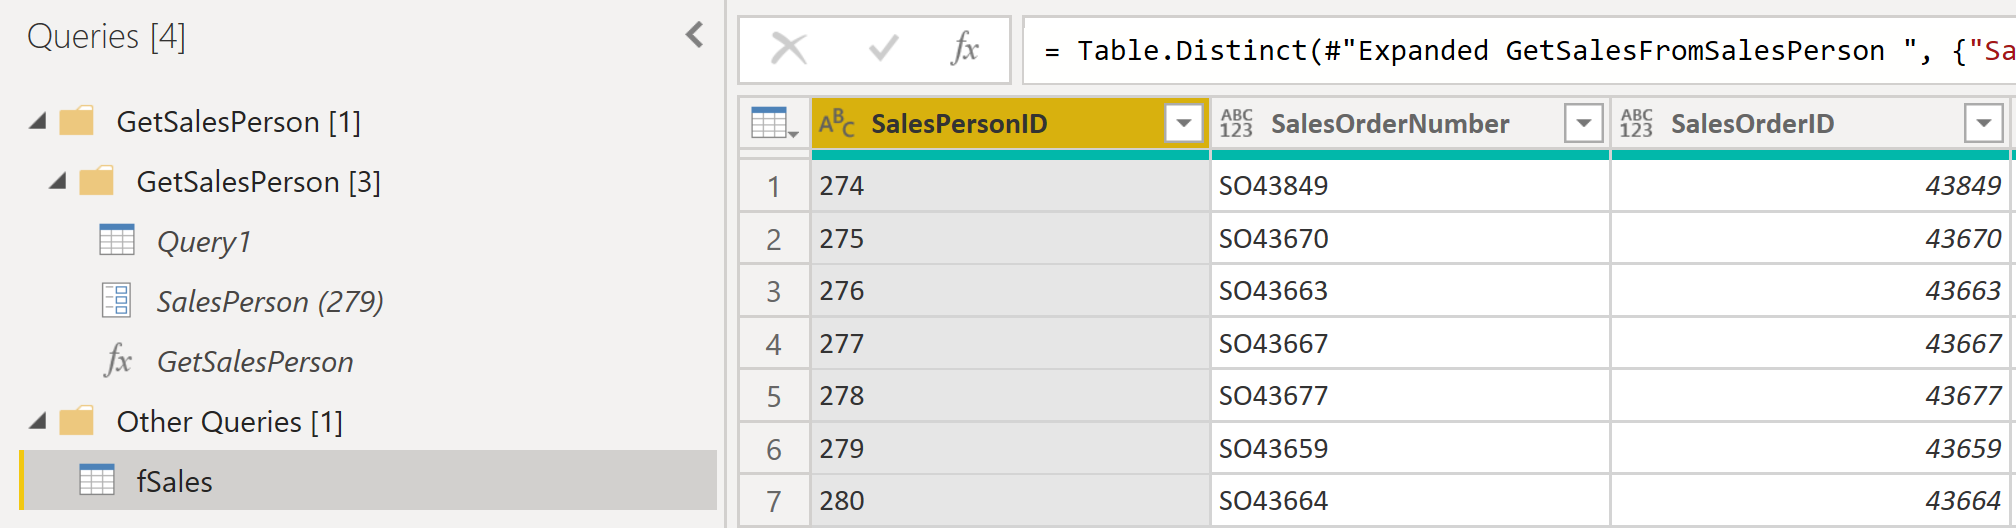
A new column for your GetSalesFromSalesPerson function appears next to the SalesPersonID column.
Select the two arrows icon in the new column header and then select the check boxes of the columns that you want to load. This section is where you determine the details that are available in the report for each value (sales person ID).
Clear the Use original column name as prefix check box at the bottom of the screen because you don't need to see a prefix with the column names in the report.
Select OK.

You should be able to view the data for the columns that you selected, for each value (sales person ID).
If necessary, you can add more values (sales people IDs) to the SalesPersonID column in the Excel worksheet, or you can change the existing values.
Save your changes and then return to Power Query Editor.
On the Home tab, select Refresh Preview, and then run the native query again (if necessary). You should see the sales from the new sales people IDs that you added into the worksheet.
Select Close and Apply to return to the report editor, where you see the new column names in the Fields pane.


Now, you can start building your report.