Analyze alerts to establish a baseline
Alerts proactively notify you when the monitoring system detects important issues. They allow you to identify and address those issues before the users of your system notice them.
Here, you learn about the alert experience in Azure Monitor, which includes Log Analytics and Application Insights.
Analyze alerts to establish a baseline
An effective alerting strategy starts with establishing a baseline. This diagram shows the flow of alerts:
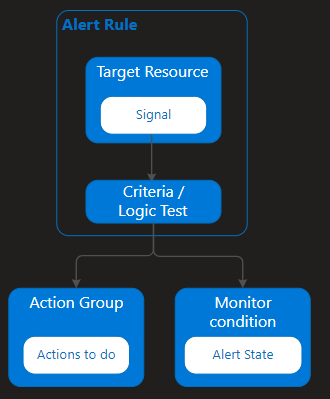
Alert rules are separated from alerts and the actions that are taken when an alert fires.
The alert rule captures the target and criteria for alerting. The alert rule can be in an enabled or a disabled state. Alerts only fire when enabled.
The key attributes of an alert rule are:
Target Resource: Target Resource defines the scope and signals available for alerting. A target can be any Azure resource. Example targets include virtual machines, storage accounts, Virtual Machine Scale Sets, Log Analytics workspaces, or Application Insights resources. For certain resources (like virtual machines), you can specify multiple resources as the target of the alert rule.
Signal: Signals are emitted by the target resource and can be of several types: Metric, Activity log, Application Insights, and Log.
Criteria / Logic Test: Criteria is a combination of Signal and Logic applied on a Target resource. Examples include:
- CPU utilization above 70%.
- Server response time greater than 4 ms.
- Log queries that produce more than 100 results.
Action Group: Action Group is a specific action that's taken when the alert is fired. To learn more, see Create and manage action groups in the Azure portal.
What you can alert on
You can alert on metrics and logs as described in Sources of monitoring data for Azure Monitor. These alerts include, but are not limited to:
- Metric values.
- Log search queries.
- Activity Log events.
- Health of the underlying Azure platform.
- Tests for web site availability.
Manage alerts
You can set the state of an alert to specify where it is in the resolution process. When the criteria specified in the alert rule is met and an alert is created or fired, it has a status of New. You can change the status when you acknowledge an alert and when you close it. All state changes are stored in the alert's history.
The following alert states are supported:
| State | Description |
|---|---|
| New | The issue has been detected and has not yet been reviewed. |
| Acknowledged | An administrator has reviewed the alert and started working on it. |
| Closed | The issue has been resolved. After an alert has been closed, you can reopen it by changing it to another state. |
Alert state is different and independent of the monitor condition. Alert state is set by the user. Monitor condition is set by the system. When an alert fires, the alert's monitor condition is set to fired. When the underlying condition that caused the alert to fire clears, the monitor condition is set to resolved. The alert state isn't changed until the user changes it. Learn how to Manage your alert instances.
Alerts experience
The default Alerts page provides a summary of alerts that are created within a particular time window. It displays the total alerts for each severity with columns that identify the total number of alerts in each state for each severity. Select any of the severities to open the All Alerts page filtered by that severity.
Here's an example:

You can filter this view by selecting values in the drop-down menus at the top of the page.
| Column | Description |
|---|---|
| Subscription | Select up to five Azure subscriptions. Only alerts in the selected subscriptions are included in the view. |
| Resource group | Select a single resource group. Only alerts with targets in the selected resource group are included in the view. |
| Time range | Only alerts fired within the selected time window are included in the view. Supported values are the past hour, the past 24 hours, the past 7 days, and the past 30 days. |
Select the following values at the top of the Alerts page to open another page.
| Value | Description |
|---|---|
| Total alerts | The total number of alerts that match the selected criteria. Select this value to open the All Alerts view with no filter. |
| Total alert rules | The total number of alert rules in the selected subscription and resource group. Select this value to open the Rules view filtered on the selected subscription and resource group. |
Manage alert rules
Select Manage alert rules to show the Rules page. The rules page is a single place for managing all alert rules across your Azure subscriptions. It lists all alert rules and can be sorted based on target resources, resource groups, rule name, or status. Alert rules can also be edited, enabled, or disabled from this page.
Here's an example:

Create an alert rule
Alerts can be authored in a consistent manner regardless of the monitoring service or signal type. All fired alerts and related details are available from a single page.
You create a new alert rule with the following three steps:
- Pick the target for the alert.
- Select the signal from the available signals for the target.
- Specify the logic to be applied to data from the signal.
This simplified authoring process no longer requires you to know the monitoring source or signals that are supported before selecting an Azure resource. The list of available signals is automatically filtered based on the target resource that you select. Also, based on that target, you are guided through defining the logic of the alert rule automatically.
You can learn more about how to create alert rules in Create a new alert rule.
Alerts are available across several Azure monitoring services. For information about how and when to use each of these services, see Monitoring and observability.
The All Alerts page
Select Total Alerts to see the All Alerts page. Here, you can view a list of alerts that were created within the selected time window.
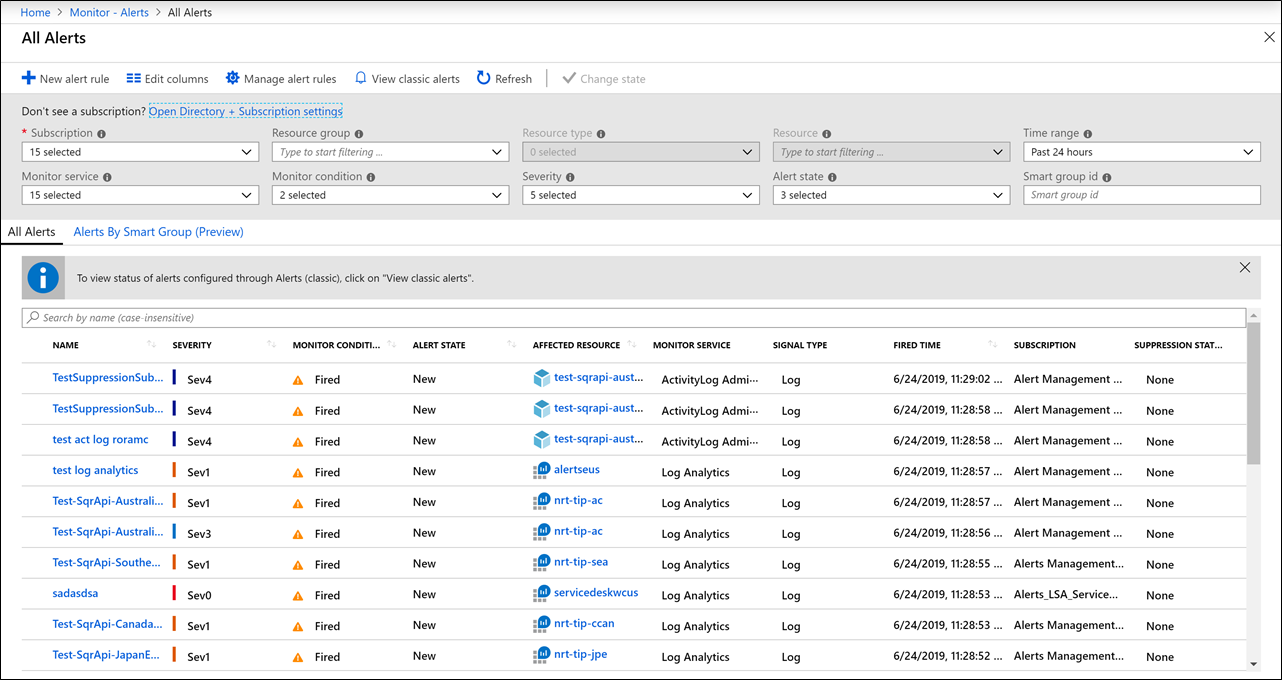
You can filter the view by selecting the following values in the dropdown menus at the top of the page.
| Column | Description | |
|---|---|---|
| Subscription | Select up to five Azure subscriptions. Only alerts in the selected subscriptions are included in the view. | |
| Resource group | Select a single resource group. Only alerts with targets in the selected resource group are included in the view. | |
| Resource type | Select one or more resource types. Only alerts with targets of the selected type are included in the view. This column is only available after a resource group has been specified. | |
| Resource | Select a resource. Only alerts with that resource as a target are included in the view. This column is only available after a resource type has been specified. | |
| Severity | Select an alert severity, or select All to include alerts of all severities. | |
| Monitor condition | Select a monitor condition, or select All to include alerts of conditions. | |
| Alert state | Select an alert state, or select All to include alerts of states. | |
| Monitor service | Select a service, or select All to include all services. Only alerts created by rules that use service as a target are included. | |
| Time range | Only alerts fired within the selected time window are included in the view. | Supported values are the past hour, the past 24 hours, the past 7 days, and the past 30 days. |
Select Columns at the top of the page to select which columns to display.