Use Power BI
While Power BI has countless features and gives developers a multitude of ways to interact with their data, Power BI empowers you to quickly create stunning reports with a friendly user interface while incorporating a variety of features to make data easy and beautifully accessible. In this unit, you will learn how Power BI makes creating beautiful data presentations easy.
Power BI -- alignment and grouping
Power BI includes formatting and canvas layout features to make building well formatted reports straightforward such as the following:
Align visual borders within the canvas.
Visuals will "snap" into place when they align.
Visuals can also be distributed horizontally and vertically.
Group visuals together.
Ctrl + click (or click + lasso) to select multiple items. Then right click and select Group.
Lasso and group visuals to align and resize.
Power BI -- Themes
You can change the entire theme right from the ribbon. You can use pre-defined themes or import your own custom theme to quickly change the design of the report.
Power BI -- Accessibility
Power BI is designed to meet three of the strictest accessibility standards and guidelines to enable more people access to data.
- Web Content Accessibility Guidelines (WCAG 2.1)
- US Section 508 for Governments and Federal Agencies
- EN 301 549 the Harmonized European Standards for Accessibility requirements
Accessibility Features
- Full Screen
- Reports can be set to fit to the screen, to the page, or to screen width for improved viewing and readability.
- Full screen mode hides extraneous menus to focus on the report itself.
[!div class="mx-imgBorder"]

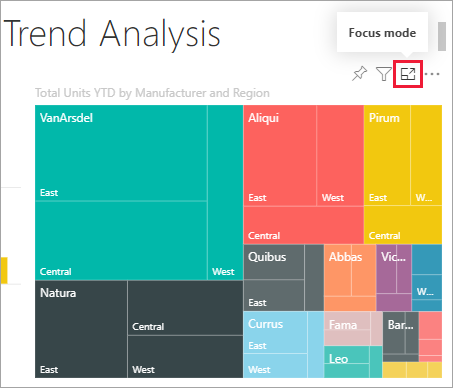
- Focus Mode
- Individual visuals can be expanded to a full screen view using "Focus Mode".
- Inspect any single dashboard tile or visual for a closer look.
[!div class="mx-imgBorder"]
- Alt Text Property
- Use the Alt Text property of visuals to provide a description of the visual content.
- Tab Order and Keyboard Navigation
- Manage keyboard accessibility and user workflow.
- Screen-Reader Compatibility
- High Contract Color View
How to apply Power BI's Accessibility features while creating reports.