Integrate logs with a Log Analytics workspace
You can use advanced logging in Azure to see users who signed in to your network and to see what users did while they were signed in to your network.
You've seen how to access the sign-in and audit logs and how you might use the logs to search for unexpected user behavior. Having access to this data is a significant first step in protecting your network and its assets and resources. Gathering and processing sign-in and activity log files can be labor-intensive. This process might identify suspicious user behavior after the event, but it still doesn't meet your security team's need for a real-time view of the behavior.
Azure Monitor can provide the real-time views and alerting your security team needs. You can use a Log Analytics workspace for Azure Monitor to hold, store, and visualize sign-in and activity log data. To reassure the security team in your organization, you want to learn more about Azure Monitor and how you can use it to identify suspicious sign-in behavior.
This unit describes how to set up a Log Analytics workspace for Azure Monitor. You then learn how to send log files to your Log Analytics workspace. Finally, you learn how to create alerts to notify you when suspicious user behavior or activity occurs. In a later exercise, you can try it yourself.
Prerequisites
To use a Log Analytics workspace to view and analyze Microsoft Entra logs, make sure that you have the following items available or set up:
- Access to a Log Analytics workspace.
- Access to Microsoft Entra logs.
- Access to Microsoft Entra diagnostics settings.
- A Microsoft Entra ID P1 or P2 or Premium 2 subscription.
- Any of the following Microsoft Entra roles:
- Security Administrator
- Security Reader
- Report Reader
- Global Administrator
Create a Log Analytics workspace
You know that Azure collects user data in the form of sign-in and audit log files, but you can't import the data directly into Azure Monitor. First, you must gather the log data in a Log Analytics workspace. Each Log Analytics workspace is unique and has its own data repository and configuration. When you configure the workspace, you can analyze the data by using log searches and table-based queries.
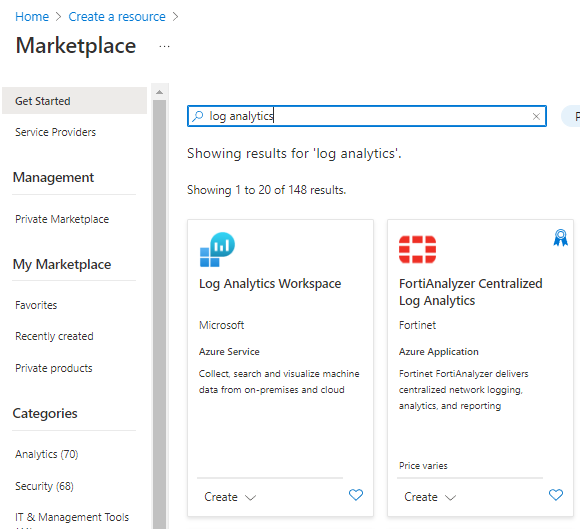
Creating a Log Analytics workspace is straightforward. In the Azure portal, search for log analytics to create a new Log Analytics workspace resource.
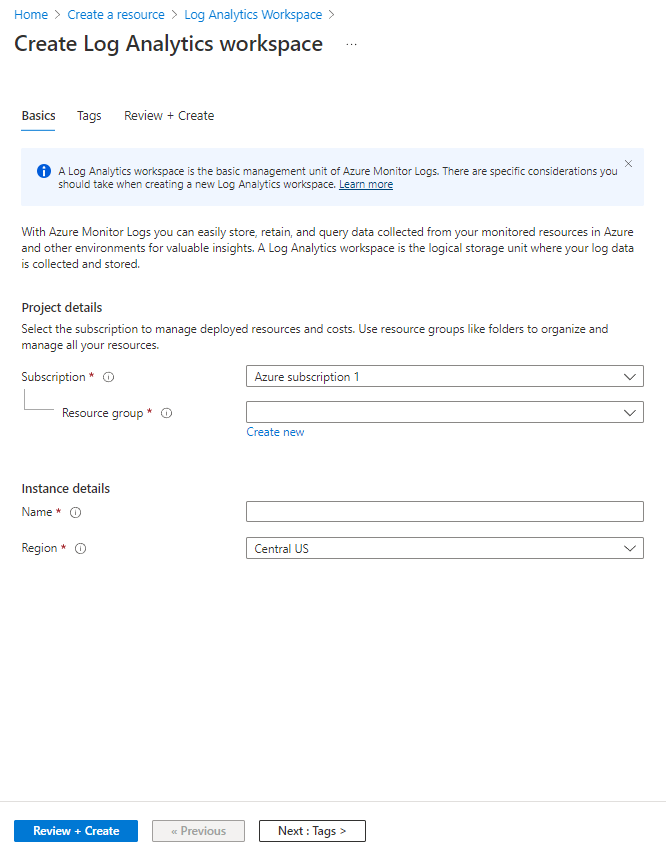
As you create a new Log Analytics workspace, select or enter details for the workspace. Be sure to create a new workspace, because the workspace is unique to the user who currently is signed in. Each workspace must have a name that's globally unique among Azure Monitor subscriptions. Optionally, you can create tags to use for the workspace,
The pricing tier is automatically assigned as Pay-as-you-go and is based on a per-gigabyte (GB) cost.
With a Log Analytics workspace created, you can gather and do analytics on your user audit and sign-in data.
Storage sizes for activity logs
It's important to understand how much storage your workspace is likely to consume. A typical sign-in event log is about 4 kilobytes (KB) in size, and the audit log takes up about 2 KB.
To put that into perspective, if your tenant has 1,000 users, your audit log would generate about 15,000 events each day. There would be a daily storage volume of about 30 megabytes (MB) per day or 900 MB per month. The numbers are a little larger for the sign-in logs. Assuming an Azure tenant of 1,000 users, the sign-in logs will generate 34,800 events per day, which is about 140 MB per day or 4 GB of storage per month.
Send logs to the Log Analytics workspace
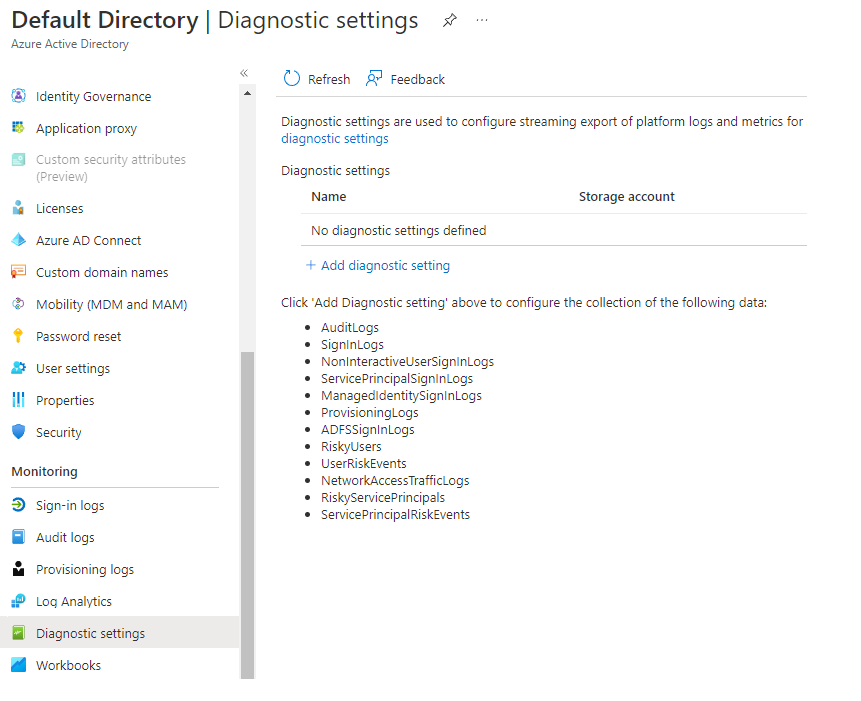
Now that you've created a Log Analytics workspace, you assign the user audit logs and sign-in logs. All the data you want to use in Azure Monitor logs must be stored in a Log Analytics workspace. In the Azure portal, go to your Microsoft Entra instance. Select the Monitoring tab, and then select Diagnostics settings.
To create a connection between the two log files and your Log Analytics workspace, select Add diagnostic setting.
Enter a name to use for the setting and select the logs you want to send to the workspace.
Select the Send to Log Analytics option, and then specify or create a Log Analytics workspace.
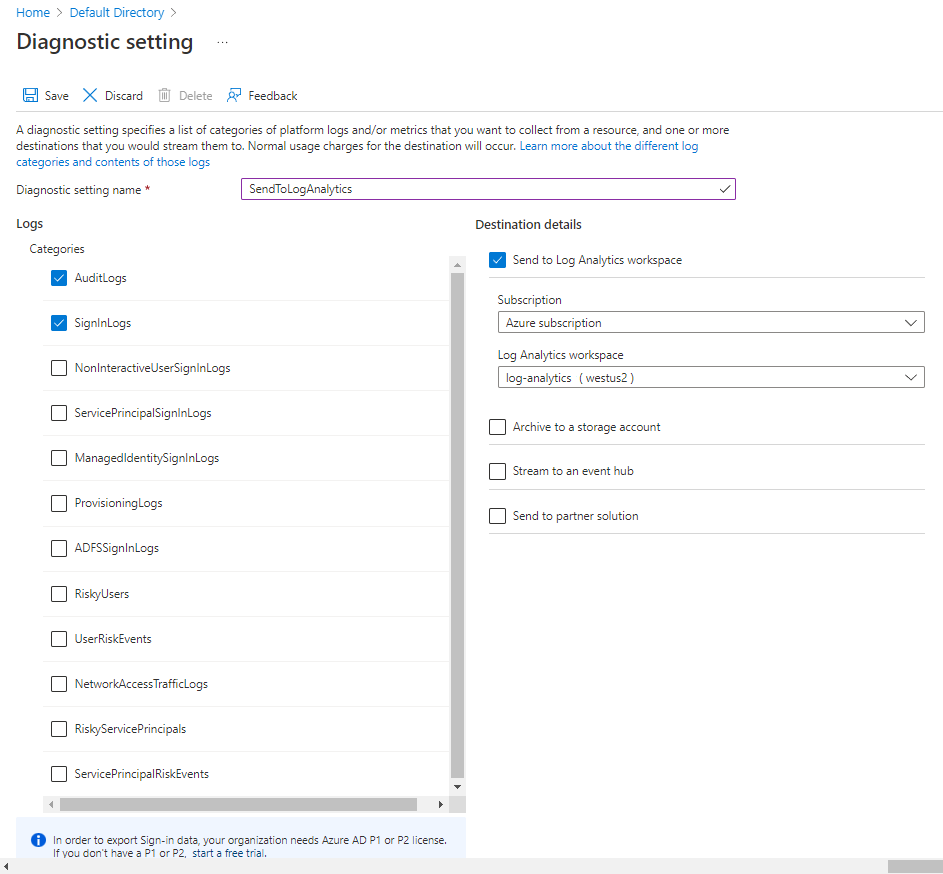
You've now set up a data streaming process that will push audit and sign-in data to the Log Analytics workspace. Because it's a new service, it takes about 15 minutes for any data to appear in the workspace.
Analyze the log files
You've set up your Log Analytics workspace to receive user activity data. Now you can use the power of Azure Monitor logs to view the activity within your environment. With Azure Monitor logs, you can query your data to spot trends, specific events, or correlate multiple data sources.
Log data schemas
The data streams for both the audit and sign-in logs are stored in your Log Analytics workspace in two separate tables, AuditLogs and SignInLogs. Each table has its own schema that you can use to query for data.
Write activity log queries
With the audit logs stored in your workspace tables, you can now run queries against them. You can write two types of queries, table-based and search-based. The schema structures in the preceding section show you all the fields you can query against.
The query language you use is Kusto, which is designed to process data and return a result set.
Each Kusto query follows a common pattern:
- A query always starts with the name of the table you're running the query against. Here, that name would be either SignInLogs or AuditLogs.
- Each command is separated by a pipe (|) and typically begins on a new line. You can have multiple pipes in a query.
Unless you nominate specific columns, the result set you see contains all schema fields.
The where command is the most common means of filtering the data in your query. When you write a condition to filter your data, the following expressions are valid:
| Expression | Description | Example |
|---|---|---|
| == | Check equality (case-sensitive) | Level == 8 |
| =~ | Check equality (case-insensitive) | EventSourceName =~ "microsoft-windows-security-auditing" |
| !=, <> | Check inequality (both expressions are identical) | Level != 4 |
and or |
Required between conditions | Level == 16 or CommandLine != "" |
Other common filter commands include:
| Command | Description | Example |
|---|---|---|
take *n* |
Ideally suited to small result sets. Take returns n rows from the result set in no particular order. | AuditLogs | Take 10 |
top *n* by *field* |
Use this filter command to return the top n rows, sorted by the nominated field. | AuditLogs | Top 10 by timeGenerated |
sort by *field* (desc) |
If you want to sort only the result set, you can use the sort command. You need to specify the field to sort on, and then you can optionally add the desc instruction to specify a descending sort pattern. | AuditLogs | Sort by timeGenerated desc |
| Where field (expression) value | The principal filtering command. You nominate the field, expression, and comparator value. You can stack multiple where commands, each separated by a pipe. | AuditLogs | where CreatedDateTime >= ago(2d) |
| project fields | If you want to restrict the result set to display only nominated fields or columns, you can use the project command with a comma-separated list of the fields. | AuditLogs | project timeGenerated, OperationName, ResourceGroup, Result |
You can use many other commands to build queries. To learn more about queries and filters, see the references at the end of this module.
Example sign-in queries
Suppose you want to know the most-used applications requested and signed in to over the last week. Your query would look like this example:
SigninLogs
| where CreatedDateTime >= ago(7d)
| summarize signInCount = count() by AppDisplayName
| sort by signInCount desc
Or, if you want to see how many of your users were flagged as risky in the last 14 days, you would use this query:
SigninLogs
| where CreatedDateTime >= ago(14d)
| where isRisky = true
Example audit query
Now, suppose you want to know the most common user event for the last week. You would use a query like this example:
AuditLogs
| where TimeGenerated >= ago(7d)
| summarize auditCount = count() by OperationName
| sort by auditCount desc
Use existing workbooks or templates in your Log Analytics workspace
You can use existing workbooks to display common views of your audit and sign-in data. If you don't find a workbook that does what you need, you can begin with a template and modify the query.
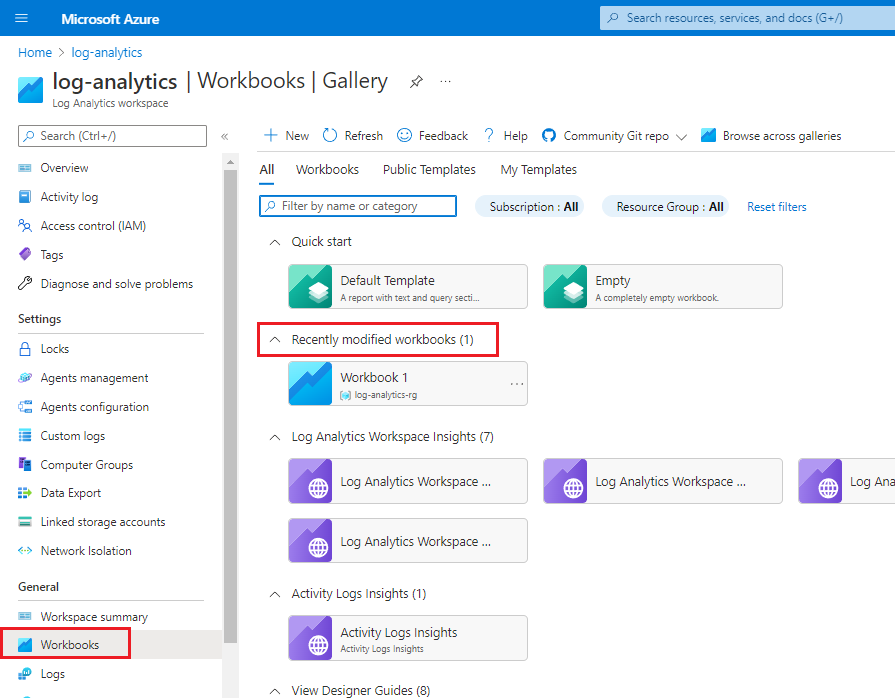
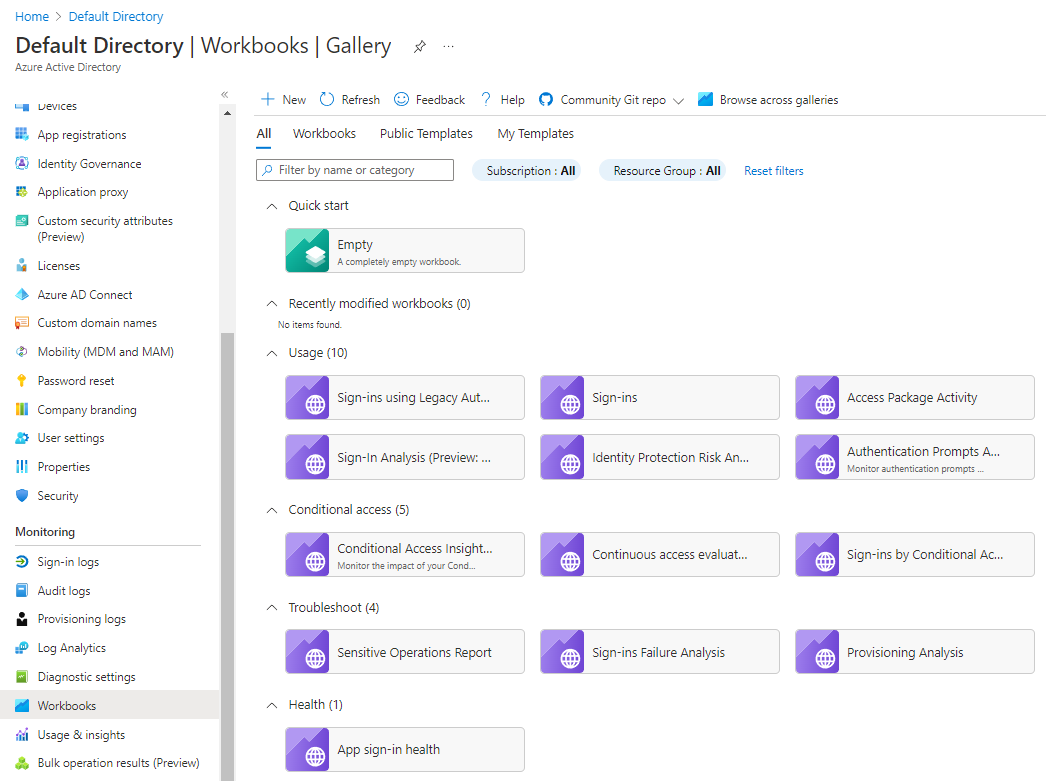
In your Log Analytics workspace in the Azure portal, in the left menu under General, select Workbooks.
If you don't find an existing workbook that has the query you need, you can select the Default template tile and create a query.
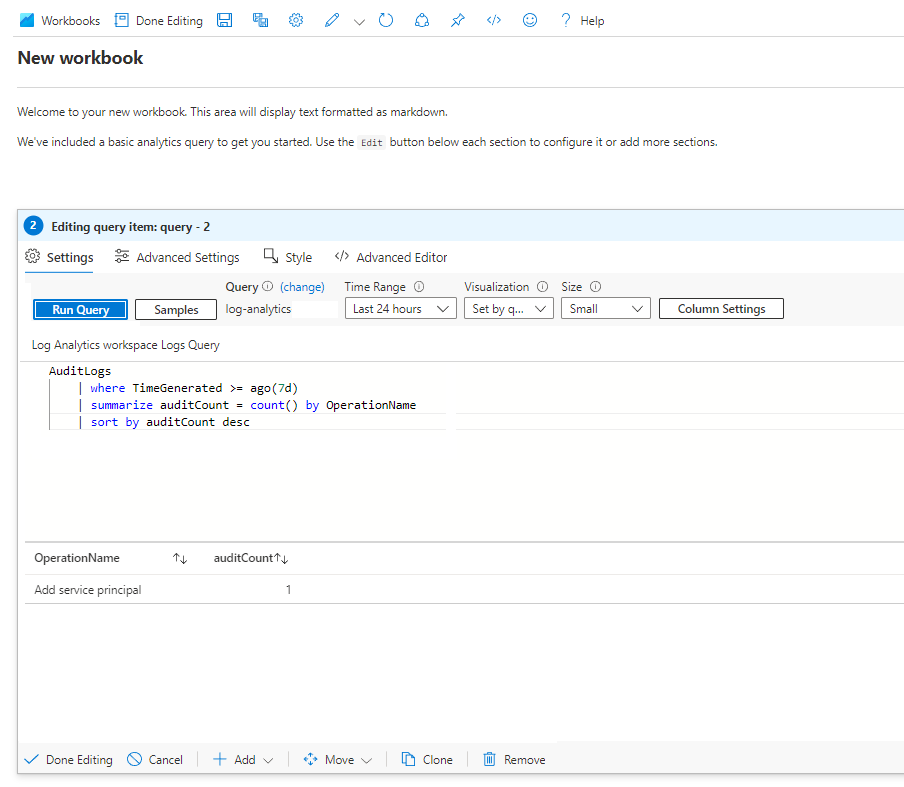
If you want to know the most common user event for last week, paste this query in your query editor:
AuditLogs
| where TimeGenerated >= ago(7d)
| summarize auditCount = count() by OperationName
| sort by auditCount desc
Run the query to check for results. When you're satisfied that you have the data you want, select Done editing, and then save the workbook.
Enter a descriptive name, like Common User Events Last 7 days, and then select or enter the subscription, resource group, and location you want to use, and then save the workbook.
To view the workbook, in the left menu under General, select Workbooks. Look for the workbook tile under Recently modified workbooks.