Explore notebook code
The following code blocks of the "Getting Started Guide For Microsoft Sentinel ML Notebooks" notebook provide a representative example of working with Microsoft Sentinel data.
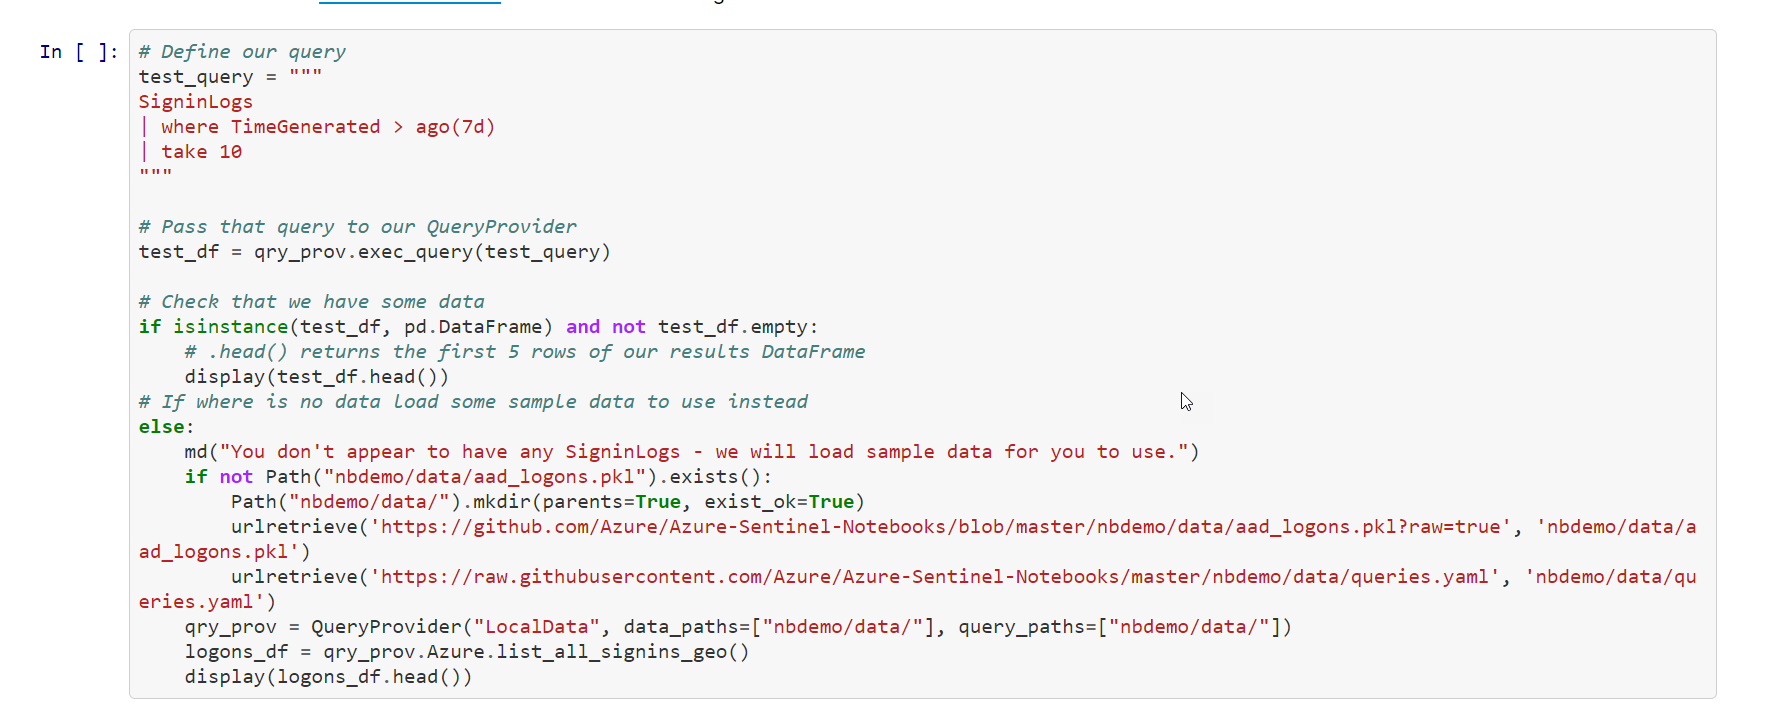
Code Block
In this snippet of code:
Create a new variable [test_query] that contains the KQL query.
Next, you run the query [qry_prov.exec_query()]. This utilizes the msticpy library to execute the KQL query in the Microsoft Sentinel Log Analytics related workspace. The results are stored in the [test_df] variable.
Next, display the first five rows with the xxx_xxxx.head() function.
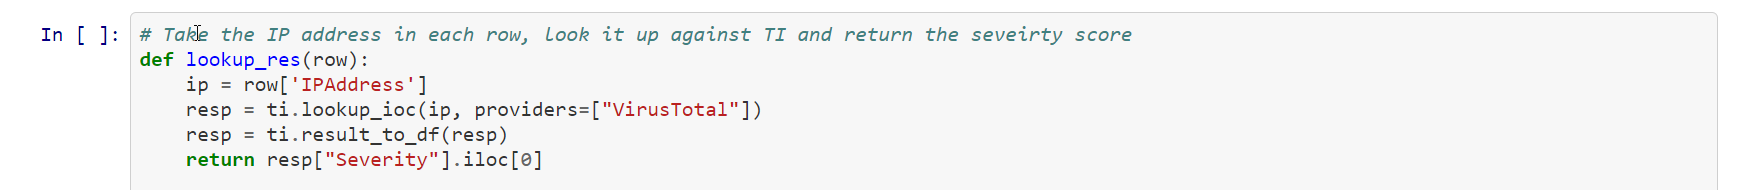
Code Block
In this snippet of code:
You create a new function called lookup_res that takes a variable row.
Next, you save the IP address stored in row to the variable [ip].
The next line of code uses the msticpy function [ti.lookup_ioc()] to query the ThreatIntelligenceIndicator table for a row that is sourced from VirusTotal with a matching ip-address.
Next, the msticpy function [ti.result_to_df()] will return a DataFrame representation of response.
The new function returns the Severity of the IP address.
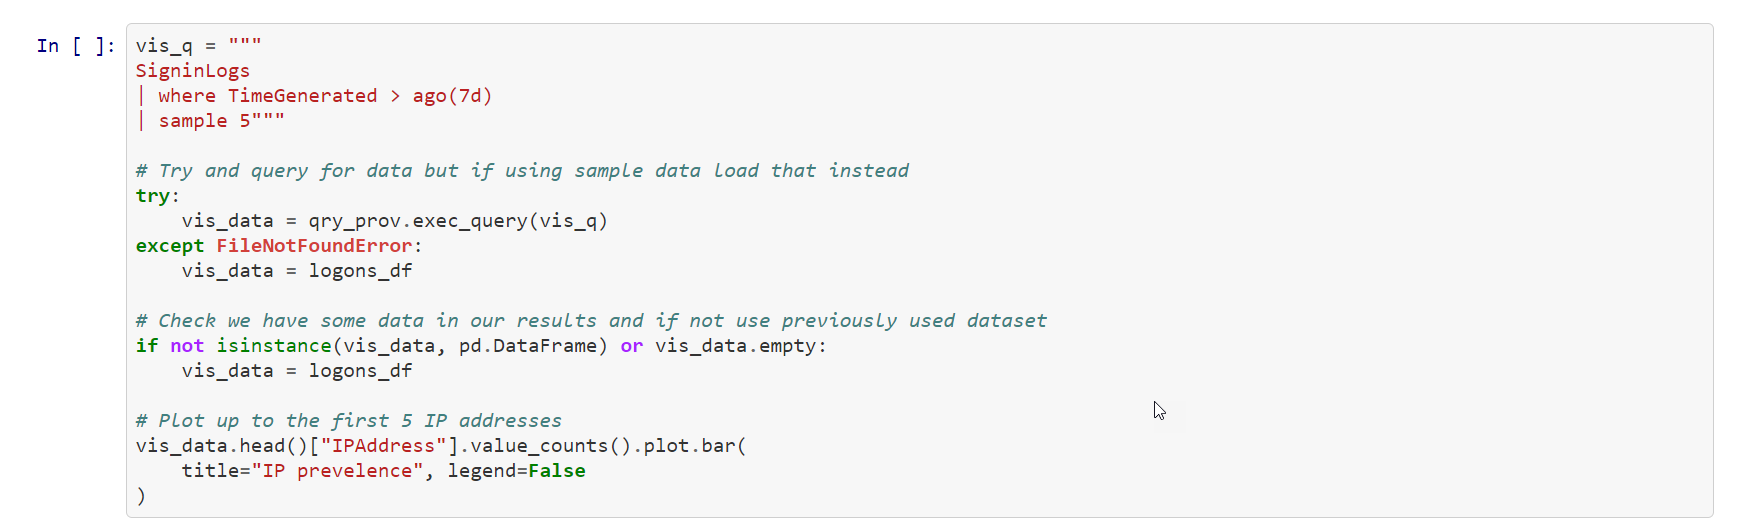
Code Block
In this snippet of code:
Create a new variable [vis_q] that contains the KQL query.
Next, you run the query [qry_prov.exec_query()]. This utilizes the msticpy library to execute the KQL query in the Microsoft Sentinel Log Analytics related workspace. The results are stored in the [vis_data] variable.
Then, [qry_prov.exec_query()] returns a pandas DataFrame that provides visualization features. You then plot a bar graph with the unique IP addresses and how many times they were used in the first five entries of the Dataframe.