Apply conditional formatting
Analysts use conditional formatting to help them visually explore and analyze data, detect critical issues, and identify patterns and trends. The colors in conditional formatting work similarly to the Colors Marks card in Tableau. You can divide conditional formatting into three different types: color scale, rules, and field values.
Color scale
Color scale determines whether the color will be a continuous value or a diverging color. This scale is based on a numeric value.
Rules
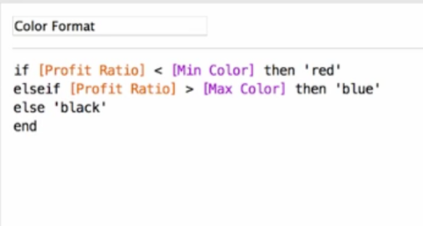
Rules are a new concept for Tableau analysts. Typically, analysts would create separate IF/THEN calculations, associating a range of values to strings or numbers. Then, analysts would drop the calculations onto the Marks card to change the color depending on those strings or numbers.
In Power BI, this functionality is built straight into the product. You can create a series of IF/THEN statements and associate them to a specific color.
Field values
Field values allow analysts to use a color that's denoted in their data. For example, if you have a column that declares the color, either as natural language (like the text "green") or code (#00ff00), Power BI can interpret these values and convert them into color.
Tip
You can load companion files that declare certain colors within your data.

