Lab 05B Develop a table report part 2
In this 20-minute lab, your students will add data visualizations to the Table Report that you created in the prior labs.
Your student's tasks in this lab are to:
- Add data bars
- Add indicators
Warning
You must successfully complete Lab 05A before commencing this lab
Lab document available at <CourseFolder>\PowerBIPRIAD\Lab05B
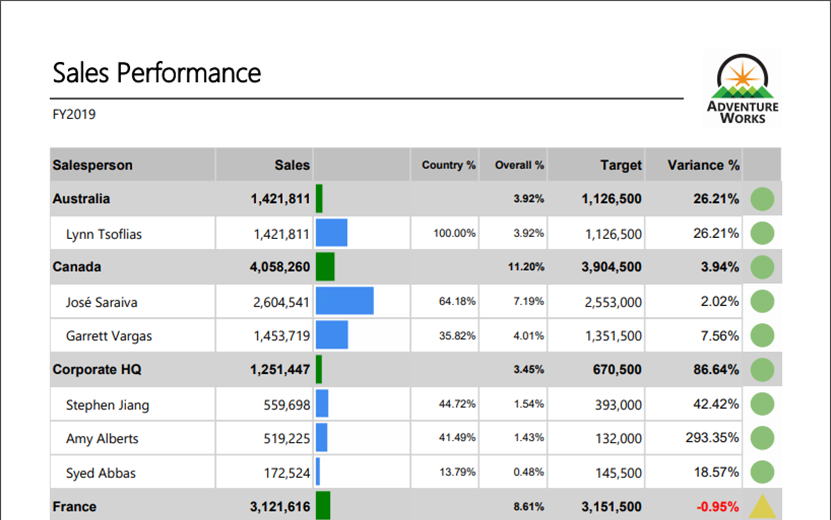
The final report will look like the following:
Tip
Depending on the skill level of your students, you may want to deliver this as an instructor-led lab to help them get though the steps smoothly.
Important
You will need to run this and all of the other labs in this course prior to teaching the course.