Exercise: Protect, monitor, and tune a migrated database
You work as a database developer for the AdventureWorks organization. AdventureWorks has been selling bicycles and bicycle parts directly to end-consumers and distributors for over a decade. Their systems store information in a database that you have previously migrated to Azure Database for PostgreSQL.
After having performed the migration, you want assurance that the system is performing well. You decide to use the Azure tools available to monitor the server. To alleviate the possibility of slow response times caused by contention and latency, you decide to implement read replication. You need to monitor the resulting system and compare the results with the flexible server architecture.
In this exercise, you'll perform the following tasks:
- Configure Azure metrics for your Azure Database for PostgreSQL service.
- Run a sample application that simulates multiple users querying the database.
- View the metrics.
Setup the environment
Run these Azure CLI commands in the Cloud Shell to create an Azure database for PostgreSQL, with a copy of the adventureworks database. The last commands will print the server name.
SERVERNAME="adventureworks$((10000 + RANDOM % 99999))"
PUBLICIP=$(wget http://ipecho.net/plain -O - -q)
git clone https://github.com/MicrosoftLearning/DP-070-Migrate-Open-Source-Workloads-to-Azure.git workshop

az postgres server create \
    --resource-group <rgn>[sandbox resource group name]</rgn> \
    --name $SERVERNAME \
    --location westus \
    --admin-user awadmin \
    --admin-password Pa55w.rdDemo \
    --version 10 \
    --storage-size 5120

az postgres db create \
    --name azureadventureworks \
    --server-name $SERVERNAME \
    --resource-group <rgn>[sandbox resource group name]</rgn>

az postgres server firewall-rule create \
    --resource-group <rgn>[sandbox resource group name]</rgn> \
    --server $SERVERNAME \
    --name AllowMyIP \
    --start-ip-address $PUBLICIP --end-ip-address $PUBLICIP

PGPASSWORD=Pa55w.rdDemo psql -h $SERVERNAME.postgres.database.azure.com -U awadmin@$SERVERNAME -d postgres -f workshop/migration_samples/setup/postgresql/adventureworks/create_user.sql

PGPASSWORD=Pa55w.rd psql -h $SERVERNAME.postgres.database.azure.com -U azureuser@$SERVERNAME -d azureadventureworks -f workshop/migration_samples/setup/postgresql/adventureworks/adventureworks.sql 2> /dev/null

echo "Your PostgreSQL server name is:\n"
echo $SERVERNAME.postgres.database.azure.com
Configure Azure metrics for your Azure Database for PostgreSQL service
Using a web browser, open a new tab and navigate to the Azure portal.
In the Azure portal, select All resources.
Select the Azure Database for PostgreSQL server name starting with adventureworks.
Under Monitoring, select Metrics.
On the chart page, add the following metric:
Property Value Scope adventureworks[nnn] Metric Namespace PostgreSQL server standard metrics Metric Active Connections Aggregation Avg This metric displays the average number of connections made to the server each minute.
Select Add metric, and add the following metric:
Property Value Scope adventureworks[nnn] Metric Namespace PostgreSQL server standard metrics Metric CPU percent Aggregation Avg Select Add metric, and add the following metric:
Property Value Scope adventureworks[nnn] Metric Namespace PostgreSQL server standard metrics Metric Memory percent Aggregation Avg Select Add metric, and add the following metric:
Property Value Scope adventureworks[nnn] Metric Namespace PostgreSQL server standard metrics Metric IO percent Aggregation Avg These final three metrics show how resources are being consumed by the test application.
Set the time range for the chart to Last 30 minutes.
Select Pin to Dashboard, and then select Pin.
Run a sample application that simulates multiple users querying the database
In the Azure portal, on the page for your Azure Database for PostgreSQL server, under Settings, select Connection Strings. Copy the ADO.NET connection string to the clipboard.
Move to the ~/workshop/migration_samples/code/postgresql/AdventureWorksSoakTest folder.
cd ~/workshop/migration_samples/code/postgresql/AdventureWorksSoakTestOpen the App.config file using the code editor:
code App.configReplace the value of Database with azureadventureworks, and replace ConectionString0 with the connection string from the clipboard. Change the User Id to azureuser@adventureworks[nnn], and set the Password to Pa55w.rd. The completed file should look similar to the example below:
<?xml version="1.0" encoding="utf-8" ?>
<configuration>
    <appSettings>
        <add key="ConnectionString0" value="Server=adventureworks101.postgres.database.azure.com;Database=azureadventureworks;Port=5432;User Id=azureuser@adventureworks101;Password=Pa55w.rd;Ssl Mode=Require;" />
        <add key="ConnectionString1" value="INSERT CONNECTION STRING HERE" />
        <add key="ConnectionString2" value="INSERT CONNECTION STRING HERE" />
        <add key="NumClients" value="100" />
        <add key="NumReplicas" value="1"/>
    </appSettings>
</configuration>
Note
Ignore the ConnectionString1 and ConnectionString2 settings for now. You will update these items later in the lab.
Save the changes and close the editor.
At the Cloud Shell prompt, run the following command to build and run the app:
dotnet runWhen the app starts, it will spawn a number of threads, each thread simulating a user. The threads perform a loop, running a series of queries. You will see messages such as those shown below starting to appear:
Client 48 : SELECT * FROM purchasing.vendor
Response time: 630 ms

Client 48 : SELECT * FROM sales.specialoffer
Response time: 702 ms

Client 43 : SELECT * FROM purchasing.vendor
Response time: 190 ms

Client 57 : SELECT * FROM sales.salesorderdetail
Client 68 : SELECT * FROM production.vproductanddescription
Response time: 51960 ms

Client 55 : SELECT * FROM production.vproductanddescription
Response time: 160212 ms

Client 59 : SELECT * FROM person.person
Response time: 186026 ms

Response time: 2191 ms

Client 37 : SELECT * FROM person.person
Response time: 168710 ms
Leave the app running while you perform the next steps.
View the metrics
Return to the Azure portal.
In the left-hand pane, select Dashboard.
You should see the chart displaying the metrics for your Azure Database for PostgreSQL service.
Select the chart to open it in the Metrics pane.
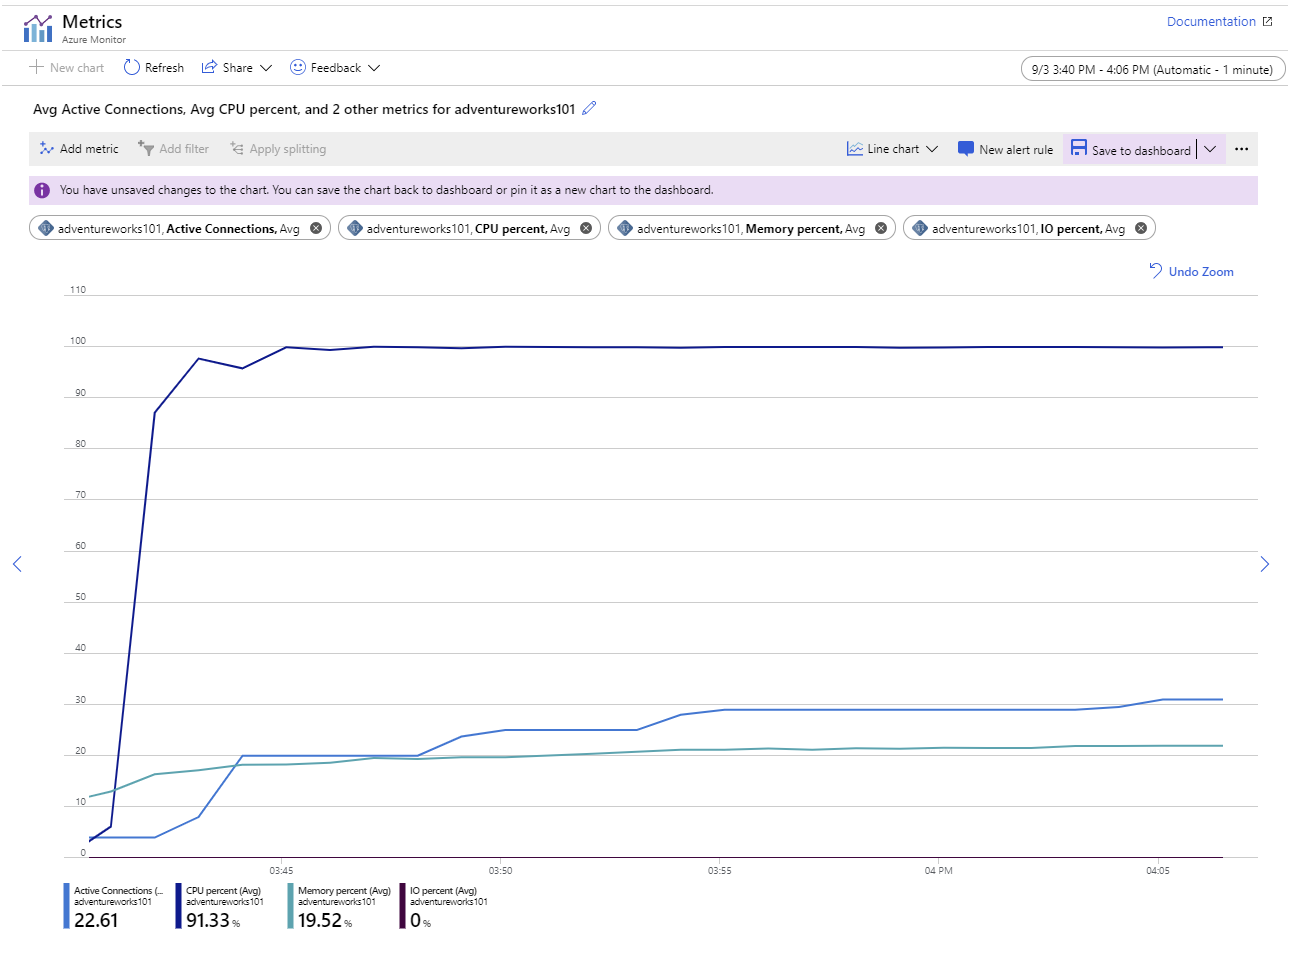
Allow the app to run for several minutes (the longer the better). As time passes, the metrics in the chart should resemble the pattern illustrated in the following image:
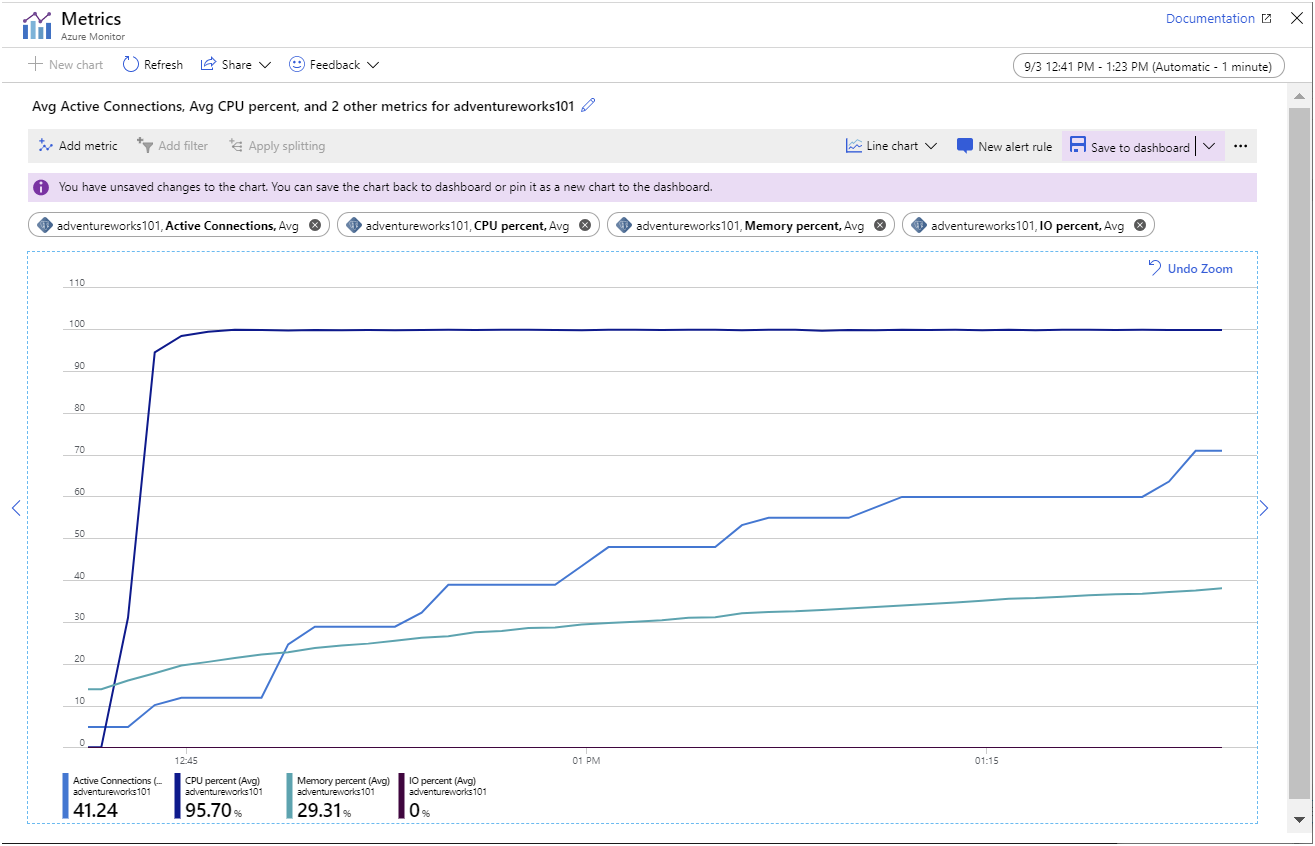
This chart highlights the following points:
- The CPU is running at full capacity; utilization reaches 100% very quickly.
- The number of connections slowly rises. The sample application is designed to start 101 clients in quick succession, but the server can only cope with opening a few connections at a time. The number of connections added at each "step" in the chart is getting smaller, and the time between "steps" is increasing. After approximately 45 minutes, the system was only able to establish 70 client connections.
- Memory utilization is increasing consistently over time.
- IO utilization is close to zero. All the data required by the client applications is currently cached in memory.
If you leave the application running long enough, you will see connections starting to fail, with the error messages shown in the following image.
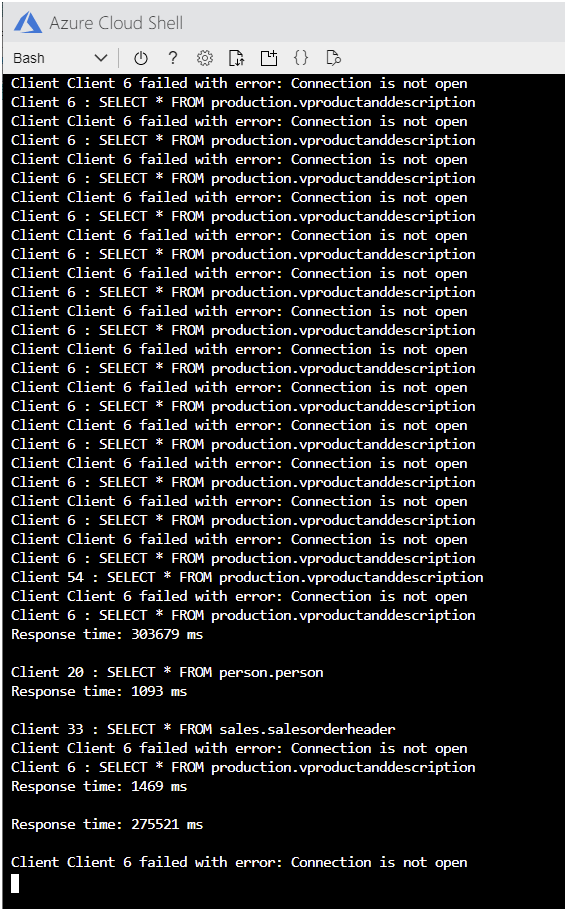
In the Cloud Shell, press Enter to stop the application.
Configure the server to collect query performance data
In the Azure portal, on the page for your Azure Database for PostgreSQL server, under Settings, select Server parameters.
On the Server parameters page, set the following parameters to the values specified in the table below.
Parameter Value pg_qs.max_query_text_length 6000 pg_qs.query_capture_mode ALL pg_qs.replace_parameter_placeholders ON pg_qs.retention_period_in_days 7 pg_qs.track_utility ON pg_stat_statements.track ALL pgms_wait_sampling.history_period 100 pgms_wait_sampling.query_capture_mode ALL Select Save.
Examine the queries run by the application using Query Store
Return to the Cloud Shell, and restart the sample app:
dotnet runAllow the app to run for 5 minutes or so before continuing.
Leave the app running and switch to the Azure portal
On the page for your Azure Database for PostgreSQL server, under Intelligent performance, select Query Performance Insight.
On the Query Performance Insight page, on the Long running queries tab, set Number of Queries to 10, set Selected by to avg, and set the Time period to Last 6 hrs.
Above the chart, select Zoom in (the magnifying glass icon with the "+" sign) a couple of times, to home in on the latest data.
Depending on how long you have let the application run, you will see a chart similar to that shown below. Query Store aggregates the statistics for queries every 15 minutes, so each bar shows the relative time consumed by each query in each 15 minute period:
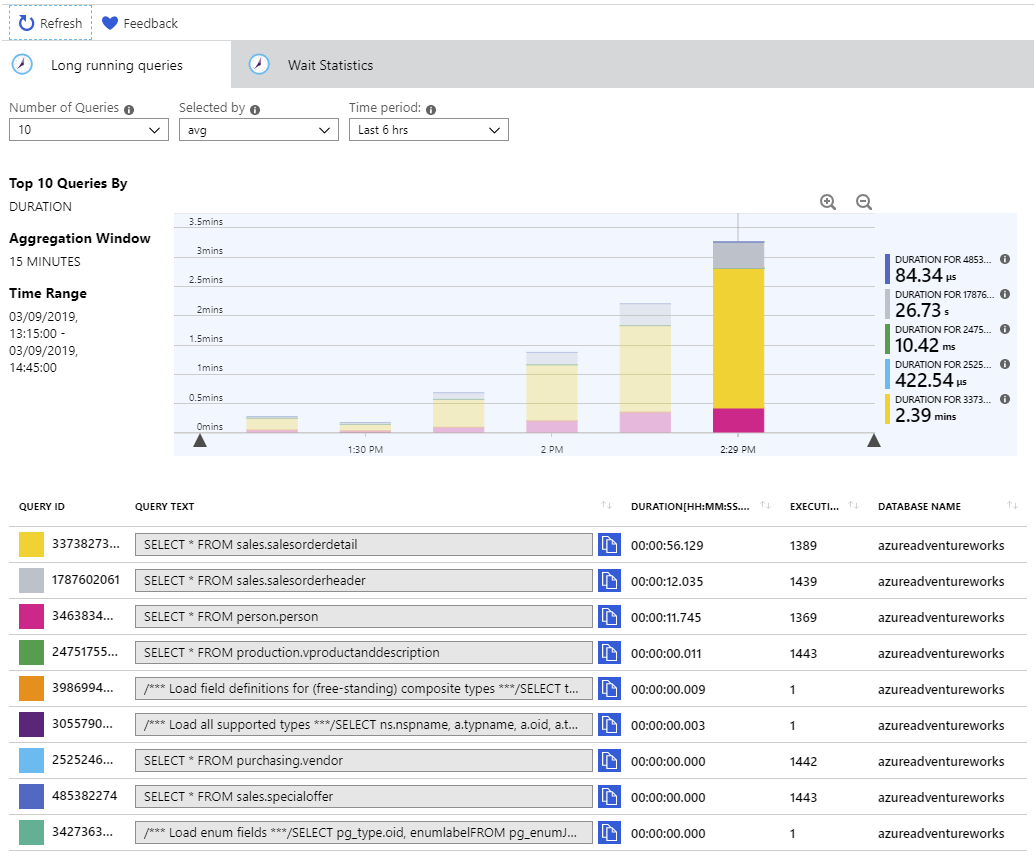
Hover the mouse over each bar in turn to view the statistics for the queries in that time period. The three queries that the system is spending most of its time performing are:
SELECT * FROM sales.salesorderdetail
SELECT * FROM sales.salesorderheader
SELECT * FROM person.person
This information is useful for an administrator monitoring a system. Having an insight into the queries being run by users and apps enables you to understand the workloads being performed, and possibly make recommendations to application developers on how they can improve their code. For example, is it really necessary for an application to retrieve all 121,000+ rows from the sales.salesorderdetail table?
Examine any waits that occur using Query Store
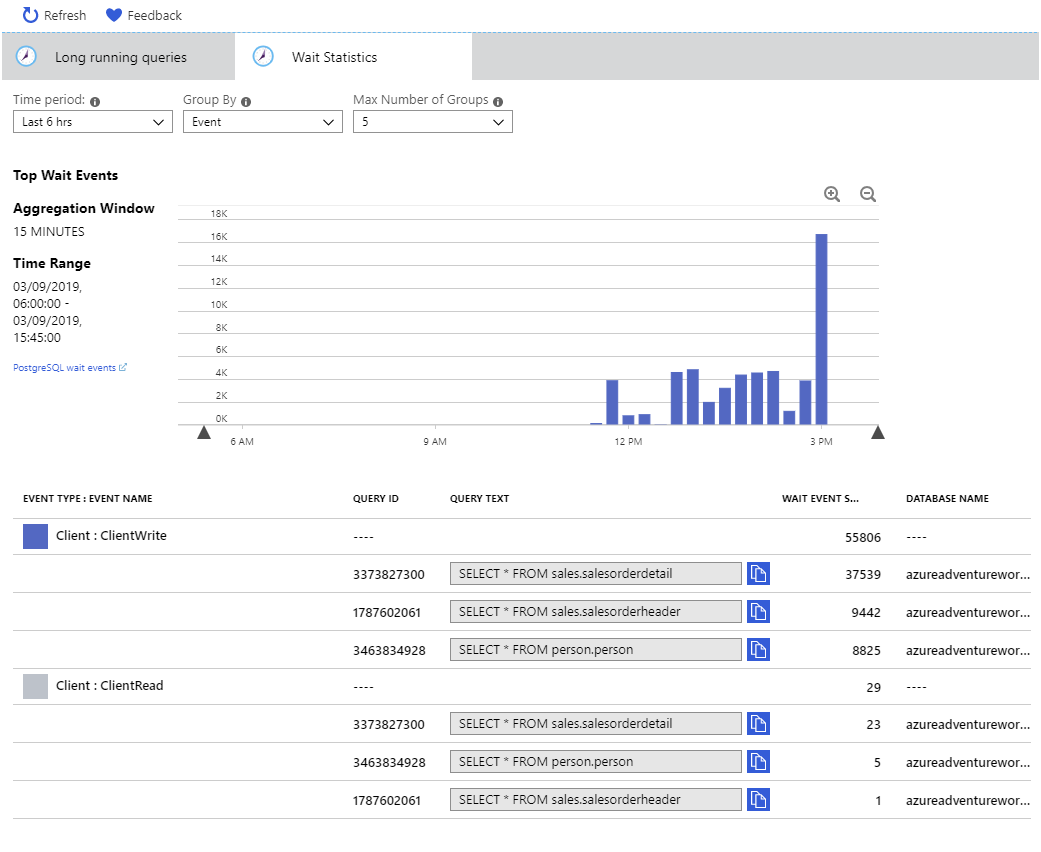
Select the Wait Statistics tab.
Set the Time period to Last 6 hrs, set Group By to Event, and set the Max Number of Groups to 5.
As with the Long running queries tab, the data is aggregated every 15 minutes. The table below the chart shows that the system has been the subject of two types of wait event:
- Client: ClientWrite. This wait event occurs when the server is writing data (results) back to the client. It does not indicate waits incurred while writing to the database.
- Client: ClientRead. This wait event occurs when the server is waiting to read data (query requests or other commands) from a client. It is not associated with time spent reading from the database.
Note
Read and writes to the database are indicated by IO events rather than Client events. The sample application does not incur any IO waits as all the data it requires is cached in memory after the first read. If the metrics showed that memory was running low, you would likely see IO wait events start to occur.
Return to the Cloud Shell, and press Enter to stop the sample application.
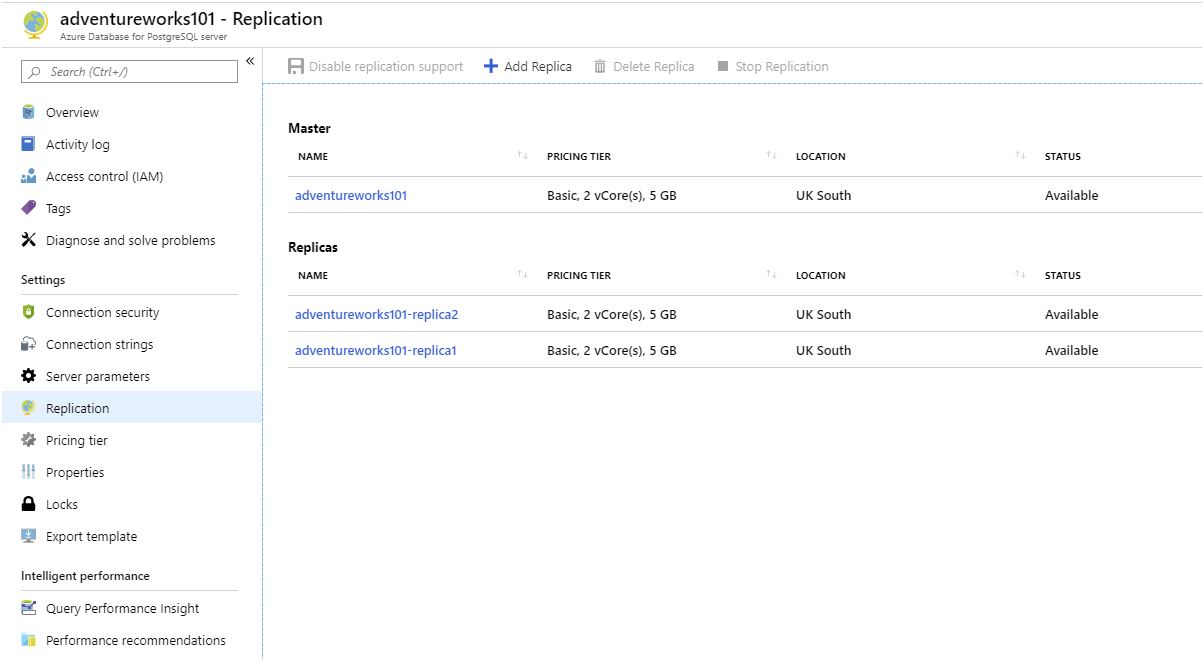
Add replicas to the Azure Database for PostgreSQL service
In the Azure portal, on the page for your Azure Database for PostgreSQL server, under Settings, select Replication.
On the Replication page, select + Add Replica.
On the PostgreSQL server page, in the Server name box, type adventureworks[nnn]-replica1, and then select OK.
When the first replica has been created (it will take several minutes), repeat the previous step and add another replica named adventureworks[nnn]-replica2.
Wait until the status of both replicas changes from Deploying to Available before continuing.
Configure the replicas to enable client access
- Select the name of the adventureworks[nnn]-replica1 replica. You will be taken to the page for the Azure Database for PostgreSQL page for this replica.
- Under Settings, select Connection security.
- On the Connection security page, set Allow access to Azure services to ON, and then select Save. This setting enables applications that you run using the Cloud Shell to access the server.
- When the setting has been saved, repeat the previous steps and allow Azure services to access the adventureworks[nnn]-replica2 replica.
Restart each server
Note
Configuring replication does not require you to restart a server. The purpose of this task is to clear memory and any extraneous connections from each server, so that the metrics gathered when running the application again are clean.
- Go to the page for the adventureworks[nnn] server.
- On the Overview page, select Restart.
- In the Restart server dialog box, select Yes.
- Wait for the server to be restarted before continuing.
- Following the same procedure, restart the the adventureworks[nnn]-replica1 and adventureworks[nnn]-replica2 servers.
Reconfigure the sample application to use the replicas
In the Cloud Shell, edit the App.config file.
code App.configAdd the connections strings for the ConnectionString1 and ConnectionString2 settings. These values should be the same as that of ConnectionString0, but with the text adventureworks[nnn] replaced with adventureworks[nnn]-replica1 and adventureworks[nnn]-replica2 in the Server and User Id elements.
Set the NumReplicas setting to 3.
The App.config file should now look similar this:
<configuration>
    <appSettings>
        <add key="ConnectionString0" value="Server=adventureworks101.postgres.database.azure.com;Database=azureadventureworks;Port=5432;User Id=azureuser@adventureworks101;Password=Pa55w.rd;Ssl Mode=Require;" />
        <add key="ConnectionString1" value="Server=adventureworks101-replica1.postgres.database.azure.com;Database=azureadventureworks;Port=5432;User Id=azureuser@adventureworks101-replica1;Password=Pa55w.rd;Ssl Mode=Require;" />
        <add key="ConnectionString2" value="Server=adventureworks101-replica2.postgres.database.azure.com;Database=azureadventureworks;Port=5432;User Id=azureuser@adventureworks101-replica2;Password=Pa55w.rd;Ssl Mode=Require;" />
        <add key="NumClients" value="100" />
        <add key="NumReplicas" value="3"/>
    </appSettings>
</configuration>
Save the file and close the editor.
Start the app running again:
dotnet runThe application will run as before. However, this time, the requests are distributed across the three servers.
Allow the app to run for a few minutes before continuing.
Monitor the app and observe the differences in the performance metrics
Leave the app running and return to the Azure portal.
In the left-hand pane, select Dashboard.
Select the chart to open it in the Metrics pane.
Remember that this chart displays the metrics for the adventureworks*[nnn]* server, but not the replicas. The load for each replica should be much the same.
The example chart illustrates the metrics gathered for the application over a 30 minute period, from startup. The chart shows that CPU utilization was still high, but memory utilization was lower. Additionally, after approximately 25 minutes, the system had established connections for over 30 connections. This might not seem a favorable comparison to the previous configuration, which supported 70 connections after 45 minutes. However, the workload was now spread across three servers, which were all performing at the same level, and all 101 connections had been established. Furthermore, the system was able to carrying on running without reporting any connection failures.
You can address the issue of CPU utilization by scaling up to a higher pricing tier with more CPU cores. The example system used in this lab runs using the Basic pricing tier with 2 cores. Changing to the General purpose pricing tier will give you up to 64 cores.
Return to the Cloud Shell and press enter, to stop the app.
You have now seen how to monitor server activity using the tools available in the Azure portal. You have also learned how to configure replication, and seen how creating read-only replicas can distribute the workload in read-intensive data scenarios.