Monitor and visualize data
Microsoft Sentinel Logs provide you access to the various logs collected from the security connectors. Microsoft Sentinel collects these logs from its integrated connectors and stores them in the Azure Log Analytics workspace.
Log Analytics workspace
The Log Analytics workspace is a repository that stores data and configuration information. You can create queries to filter important information, which you can then use to create analytics rules and detect threats. For example, you can use Microsoft Sentinel Logs to search data from multiple sources, aggregate large data sets, and perform complex operations to locate potential security threats and vulnerabilities.
Explore the Microsoft Sentinel Logs page
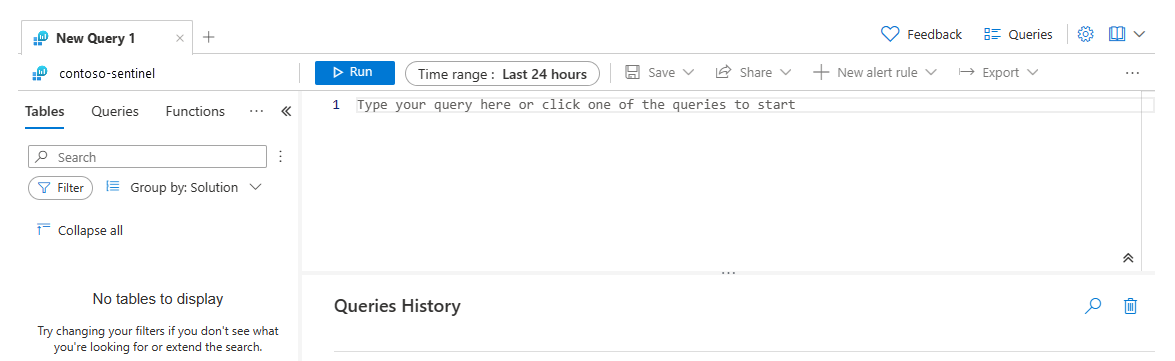
You can search for specific logs on the Microsoft Sentinel Logs page. View the page by selecting Logs in the navigation pane in Microsoft Sentinel.
The Logs page has these main parts:
- The page header contains links to the Queries, settings, and help section.
- The Tables pane displays collected data from the logs in tables, each comprising multiple columns.
- The query pane is where you write your own query expressions.
- The query result pane displays the results of your queries.
Queries
When you select the Queries link on the page header, a new window opens, where you can select from some of the predefined sample queries. From the Queries drop-down menu, you can filter these queries based on:
- Category
- Query Type
- Resource Type
- Solution
- Topic
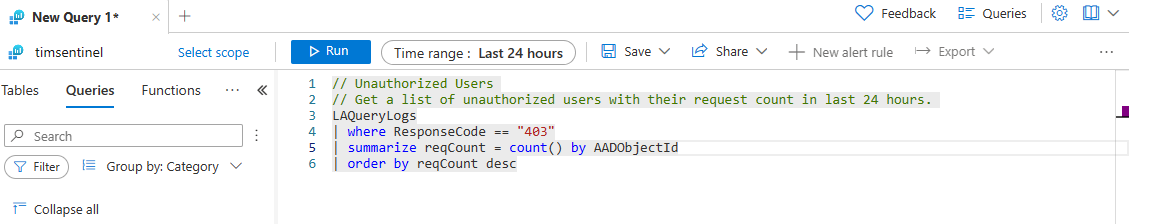
Select Run to start a predefined query. This action redirects you to the query pane. You can observe the query structure and the results. To address Contoso's concern about unauthorized users, run the predefined query Unauthorized Users.
Query Explorer
Use the Query Explorer to access your previously saved queries. You can also access some Solution Queries that basically filter the most common queries that you can use to filter the data. From the Solution Queries list, you can either run the query or organize the query in the favorites section by selecting the star symbol.
Tables pane
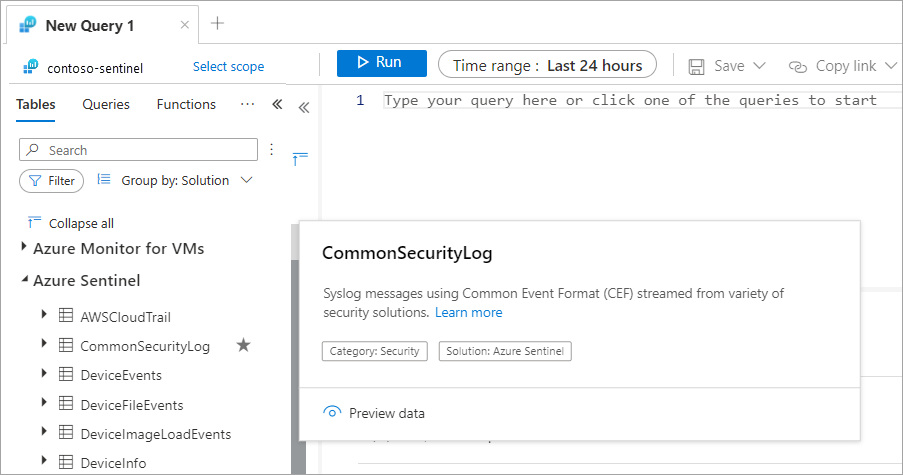
The Tables pane groups logs from different solutions into tables. You can expand the solution group and observe all the logs that are collected. You can also select one of the logs from the tables pane. You can preview the data or add that log to the Favorites section.
The following screenshot displays the logs collected in Microsoft Sentinel solution.
Queries pane
Use the Queries pane to create queries that retrieve data based on the expression that you provide. The Queries pane helps you to write an accurate query by providing suggestions and automatically filling the expected elements of the query.
Take advantage of the capabilities of the Kusto Query Language (KQL) to write a query that retrieves data from the logs. The following example illustrates how to use KQL code in your queries to identify deleted virtual machines.
AzureActivity
| where OperationName == 'Delete Virtual Machine'
| where ActivityStatus == 'Accepted'
| extend AccountCustomEntity = Caller
| extend IPCustomEntity = CallerIpAddress
Header toolbar
The header toolbar provides more interaction with the query, as displayed in the following screenshot.
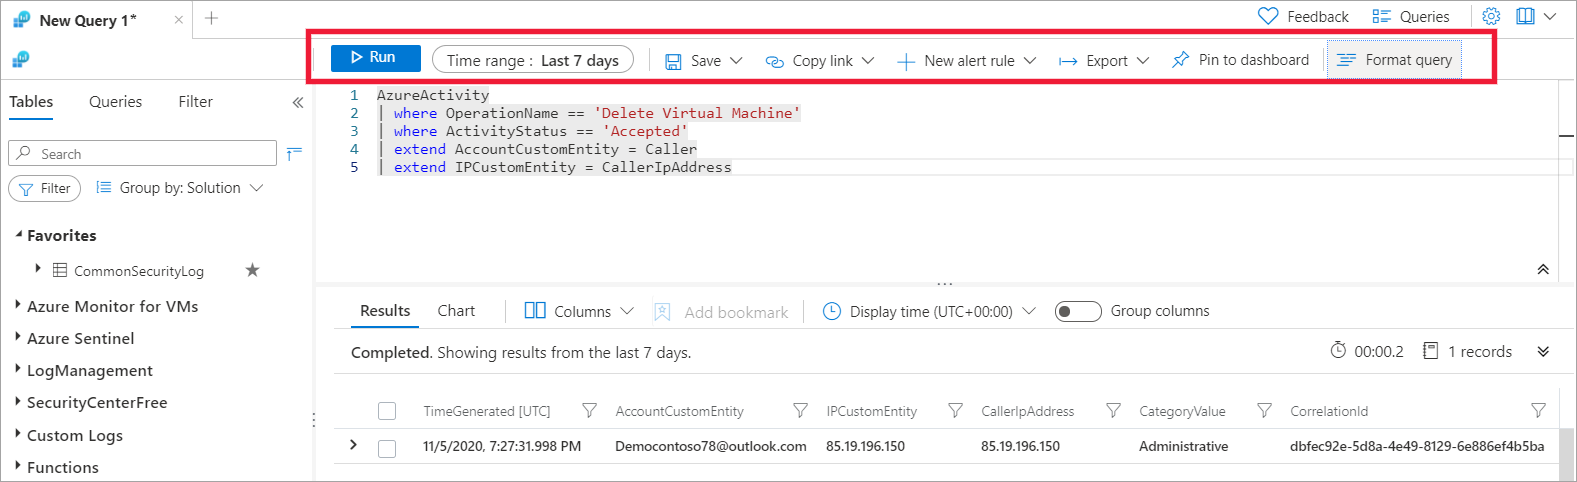
Save the query from the Query pane by selecting Save. This action opens a new window, where you're prompted to enter the name of the saved query and category. Saved queries appear in the query explorer.
In the Time Range field, you can provide a different time to change the time range for which you want to display the results of the query.
Create a link for the query and share with other team members by selecting Copy link to query. You can also copy the query text.
From the header toolbar in the Query pane, you can create either a New Azure Monitor alert or a New Microsoft Sentinel alert. If you opt to create a new Microsoft Sentinel alert, you'll be directed to the next steps for creating an analytics rule.
Export the query into one of the following formats:
- Export to CSV. Export all the columns, both visible and hidden, into a CSV file that you can open with Microsoft Excel.
- Export to CSV-Displayed Columns. Export only those columns that are displayed in the results windows of the query.
- Export to Power BI (M query). Create and download a PowerBIQuery.txt file that you can open with Microsoft Power BI application.
You can pin the results of the query into a private or shared dashboard to quickly examine the results of the query.
You can use Format query on the header toolbar to make the query more readable.
Note
You can export or pin the query only if the query expression generates data in the query result section.
Query results
Under Results, you can observe the results of the query. You can also present the results using a chart, or hide and display other columns to filter the query results.